

Structure of Macrobenthic Assemblages and Its Relationship with Environmental Variables in the East China Sea of Xiangshan


Structure of Macrobenthic Assemblages and Its Relationship with Environmental Variables in the East China Sea of Xiangshan
Haozhen Liu1, Xiangfu Li2, Yinong Wang1,*, Xun Liu3,4, Li Wang1, Dong Liu1, Chen Chen1, Jinjing Li1, Haifeng Jiao5 and Zhongjie You1,5

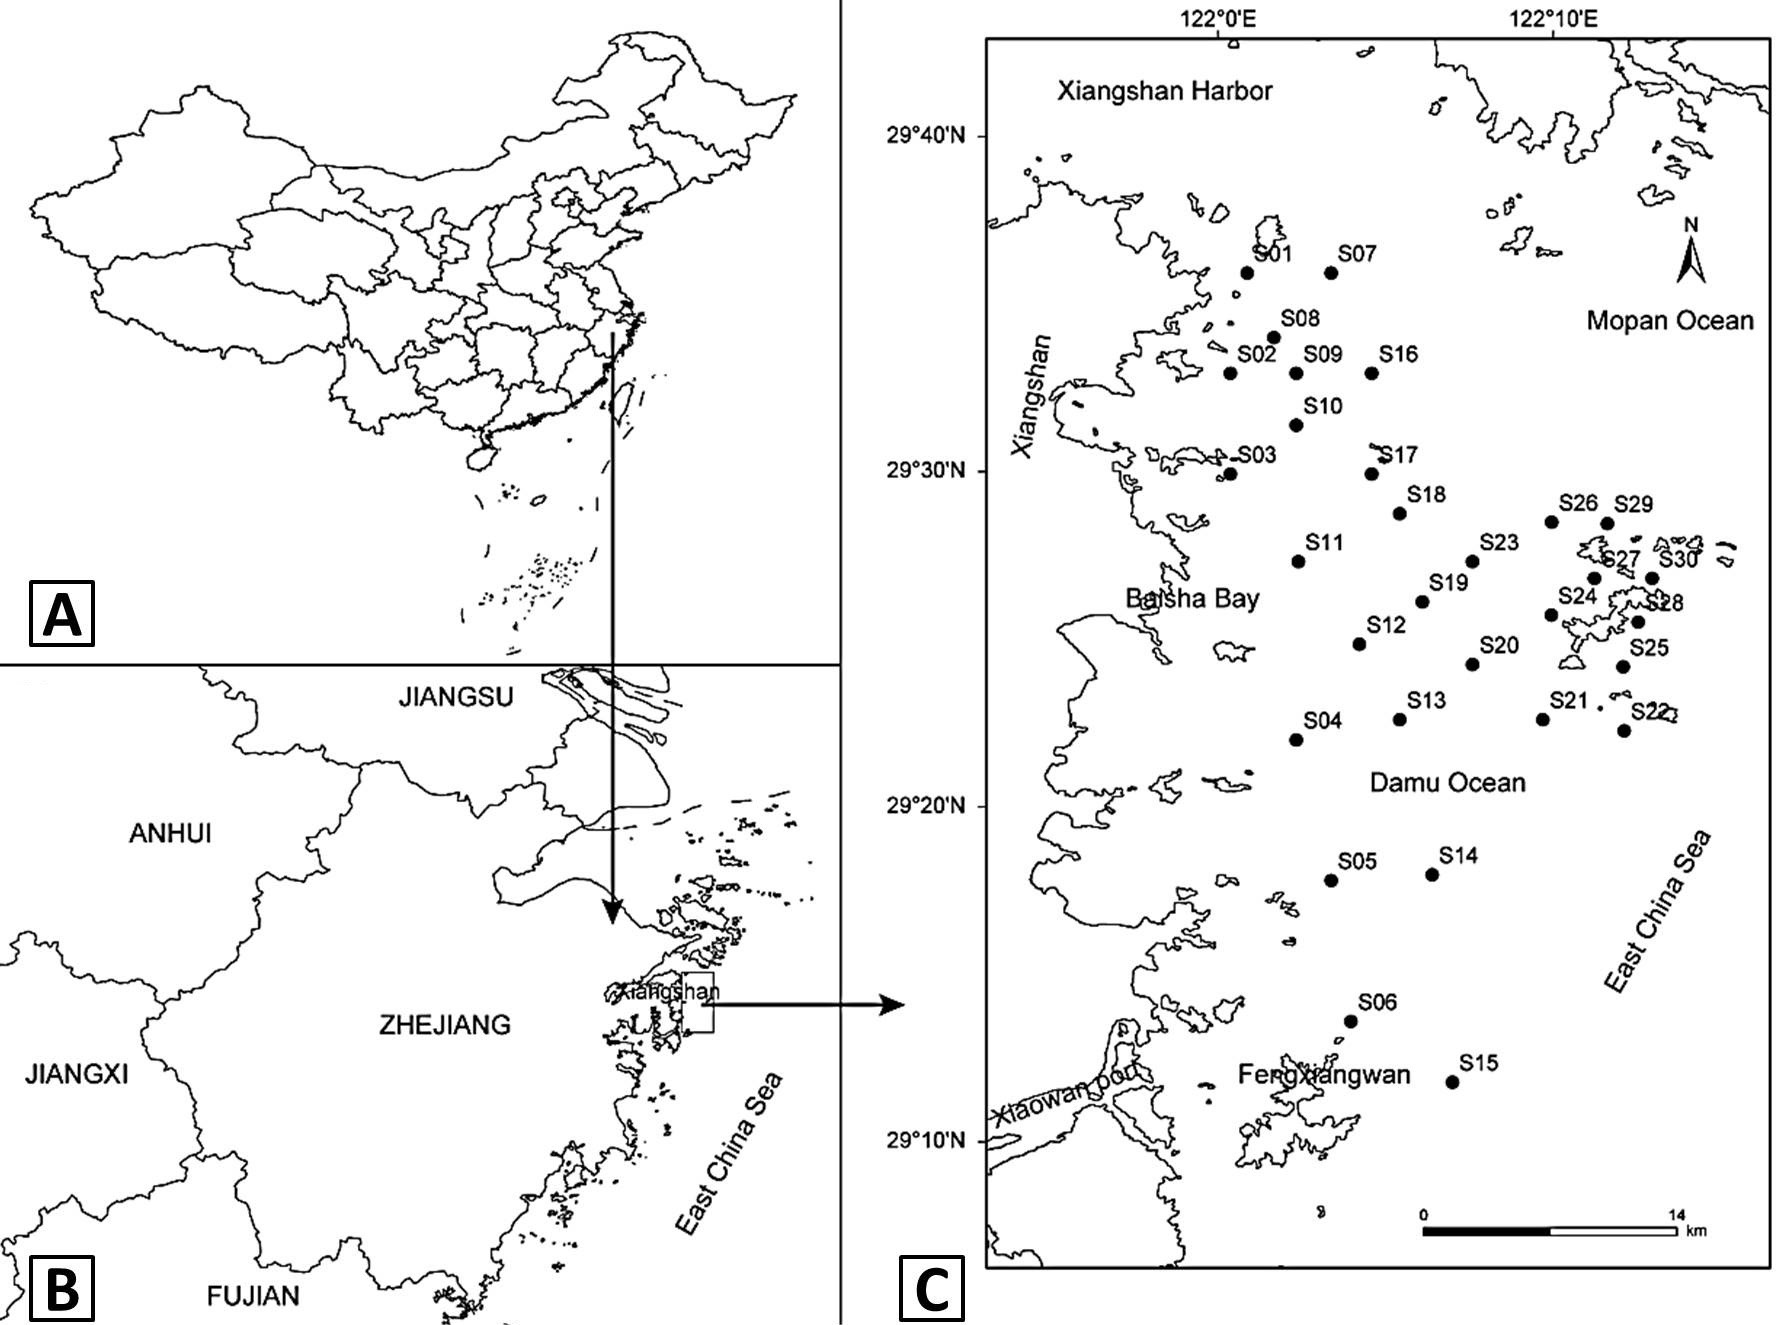
Maps of the study area and sampling design: A, Location of the Zhejiang Province in China; B, Location of the Xiangshan County in Zhejiang Province; C, Map of the Northern Xiangshan County and sampling design. Total of 30 sampling stations were designed to collect macrobenthos and to investigate physicochemical characteristics of water column and sediments.
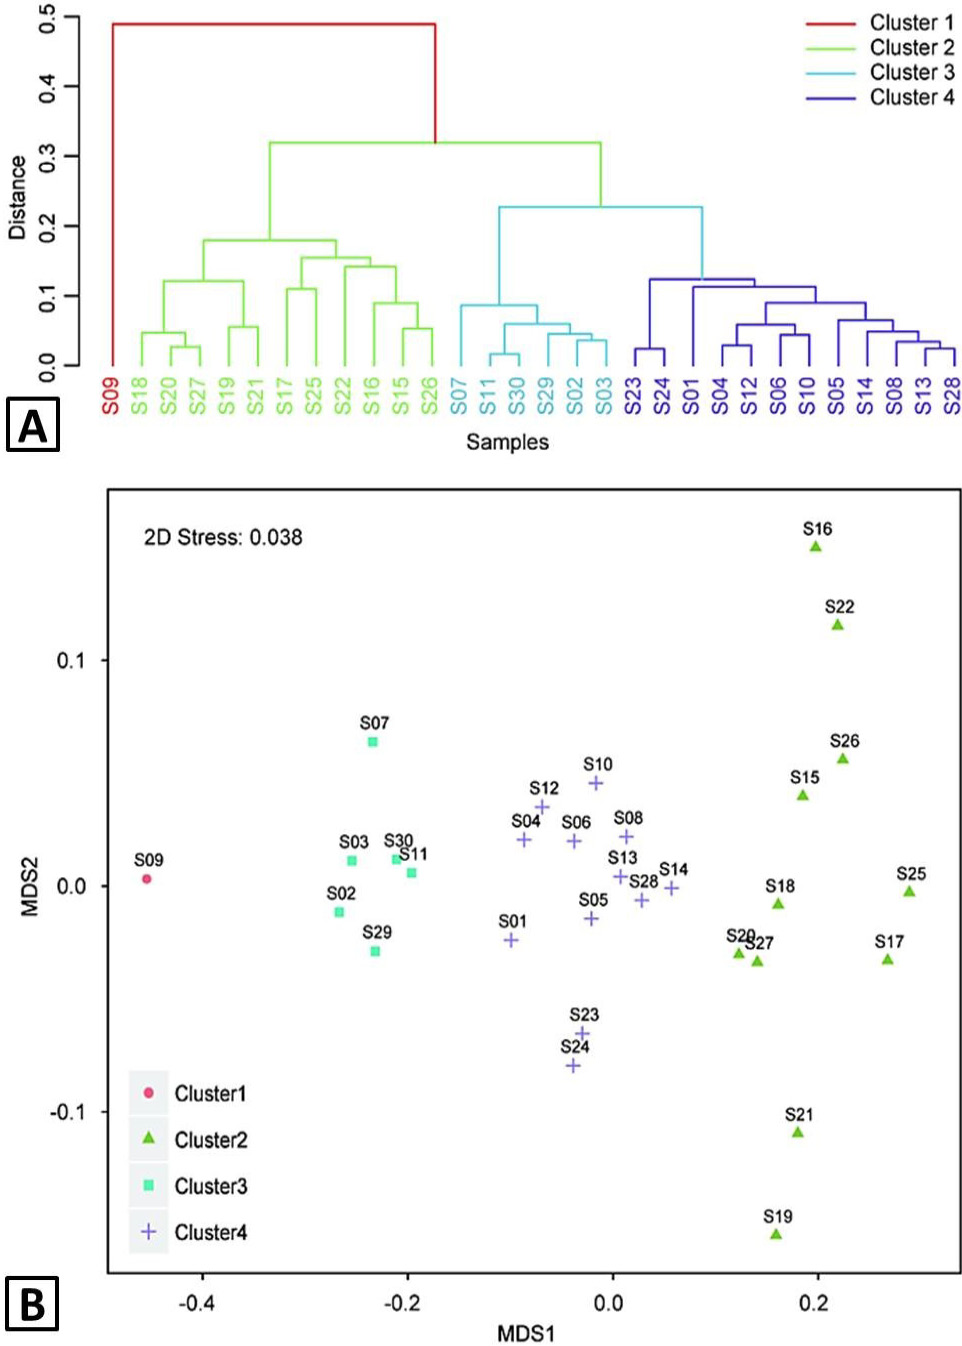
Clusters in the study sites generated by (A) cluster analysis and (B) MDS ordination based on square-root transformed and normalized environmental variables of water column and sediments. Euclidean distances were used as a dissimilarity measure both in cluster analysis and MDS ordination. Average method was used in cluster analysis.

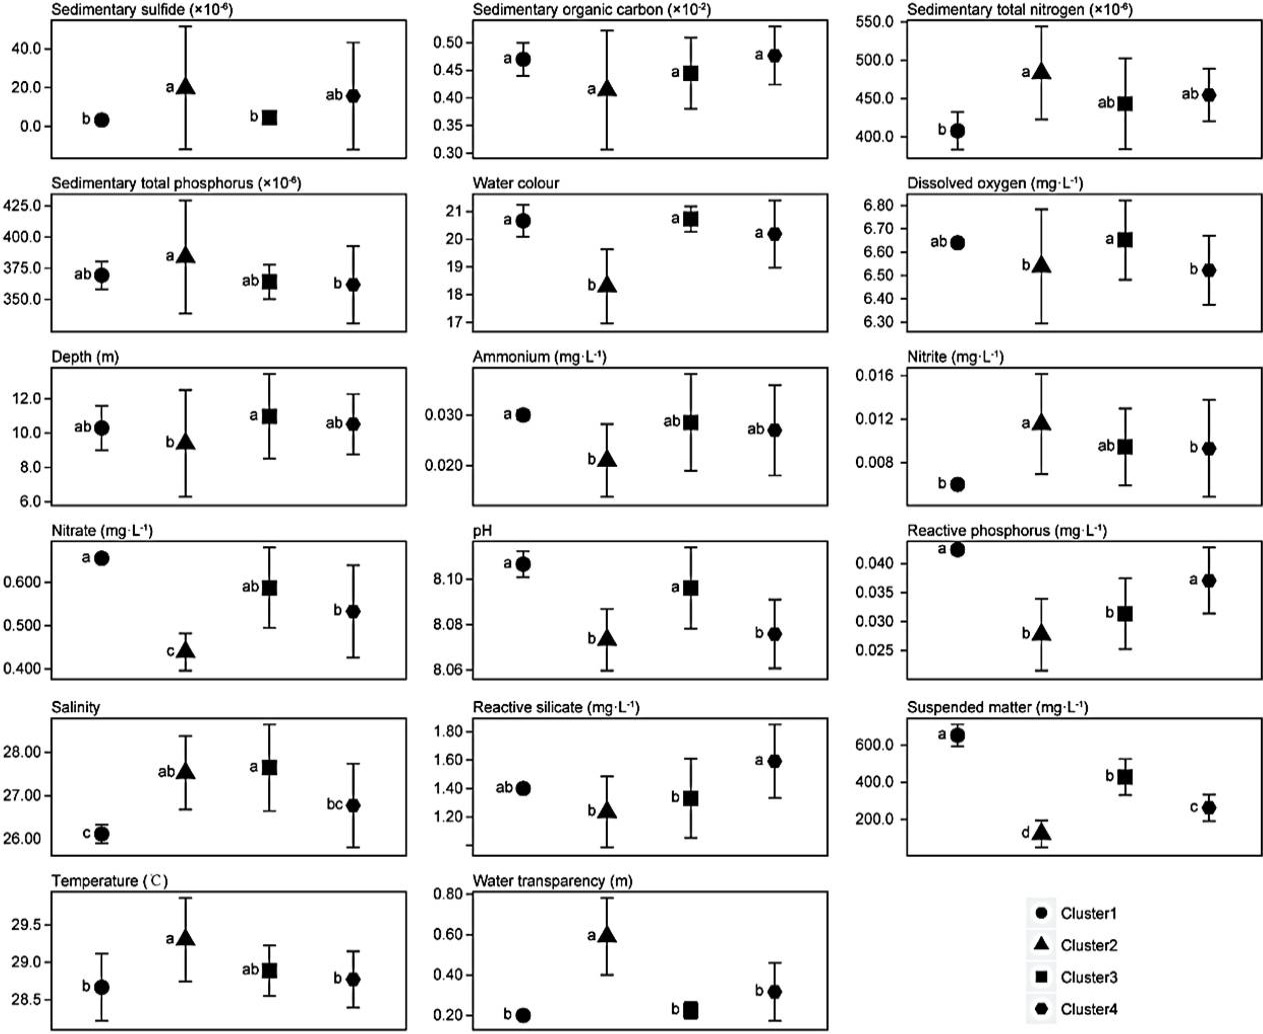
Environmental variables of water column and sediments in each cluster (Mean ± SD). Letters indicate significant differences among clusters (P < 0.05) as detected by Fisher-LSD test (sediment sulfide, sediment total phosphorus, depth, nitrite and dissolved oxygen) and Duncan test (others) based on permutation test model of variance analysis. And before these test, permutation test of variance analysis was done of environmental variables.

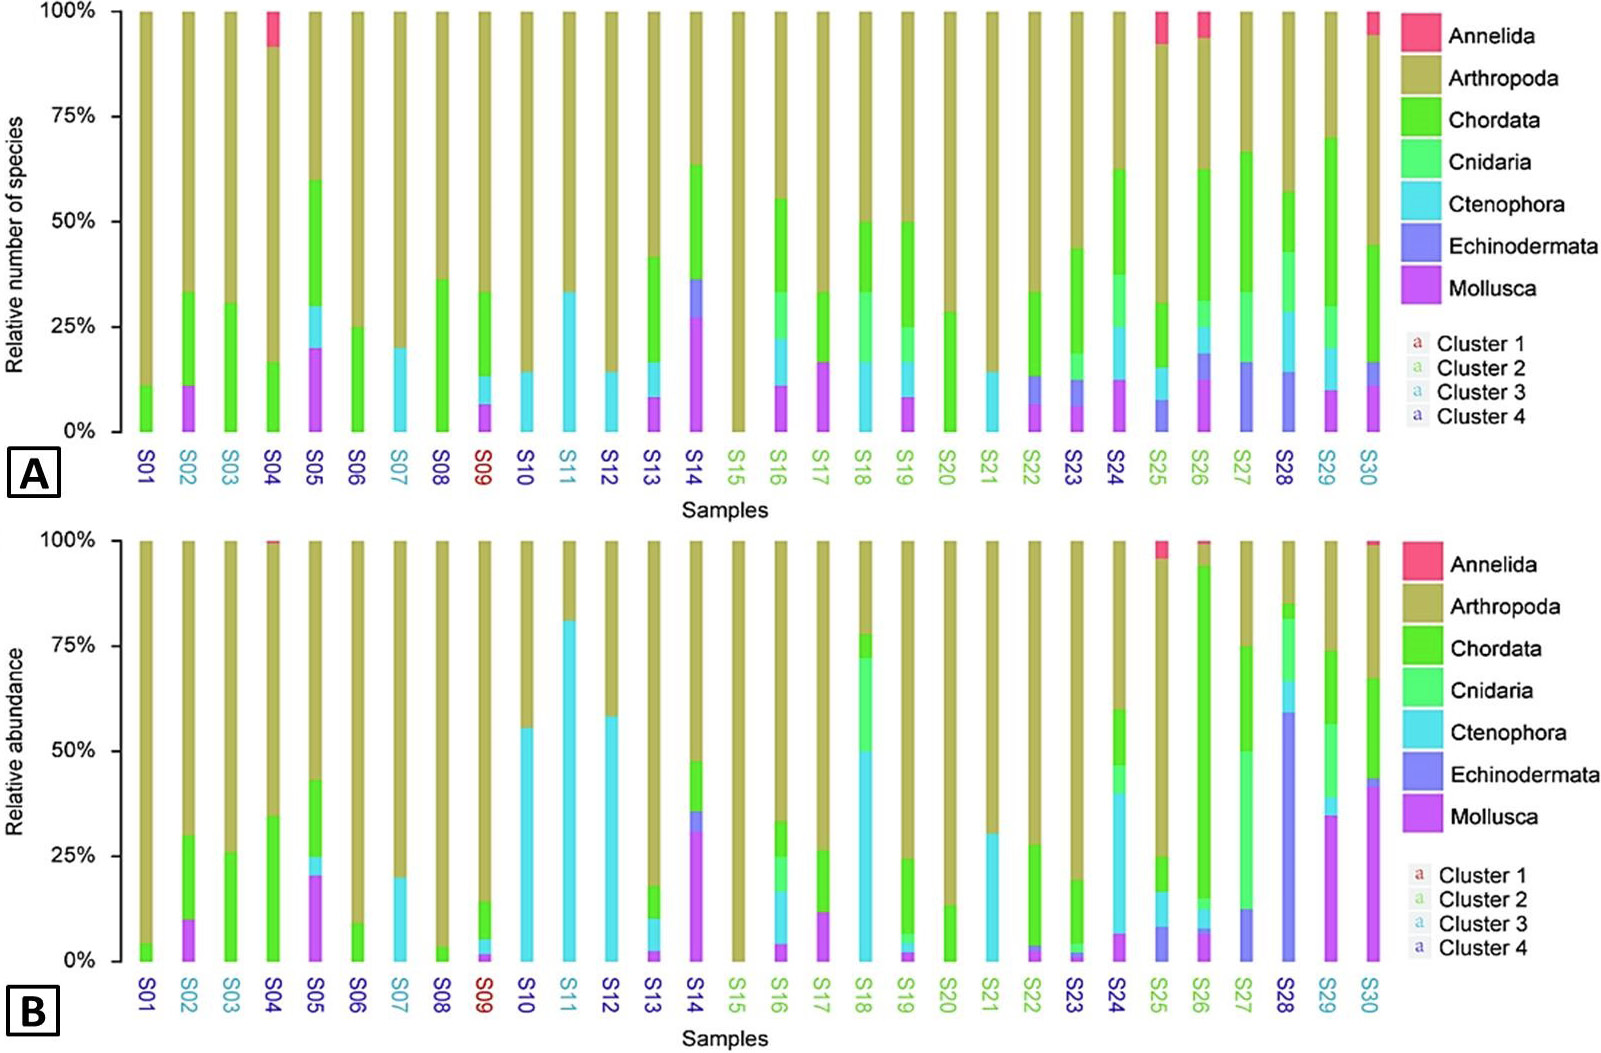
The relative number of species (A) and the relative abundance of taxonomic groups (B) in every sampling stations.
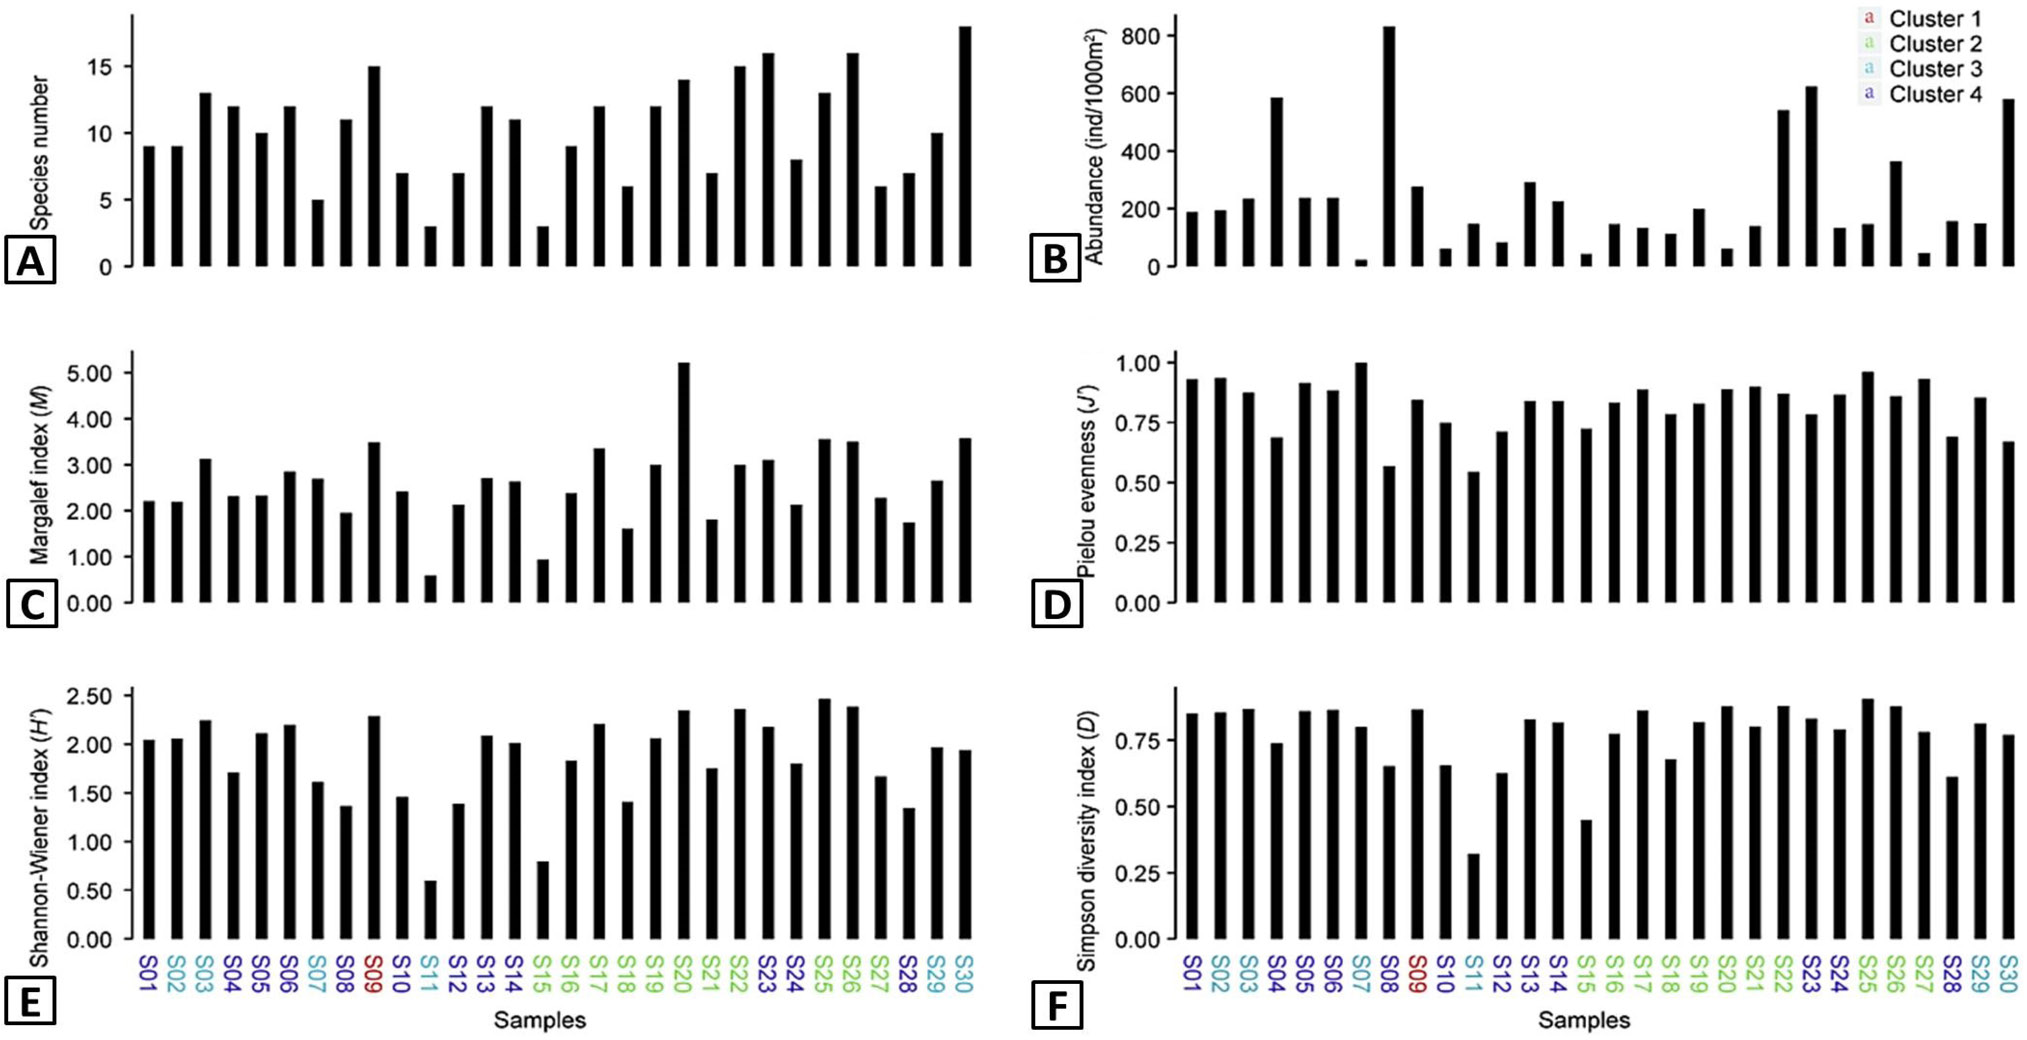
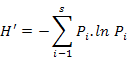
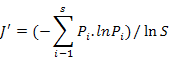
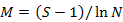
Species number (A), abundance (B), Magalef index (M) (C), Pielou evenness (J’) (D), Shannon-Wiener index (H’) (E) and Simpson diversity index (D) (F) in every sampling stations.
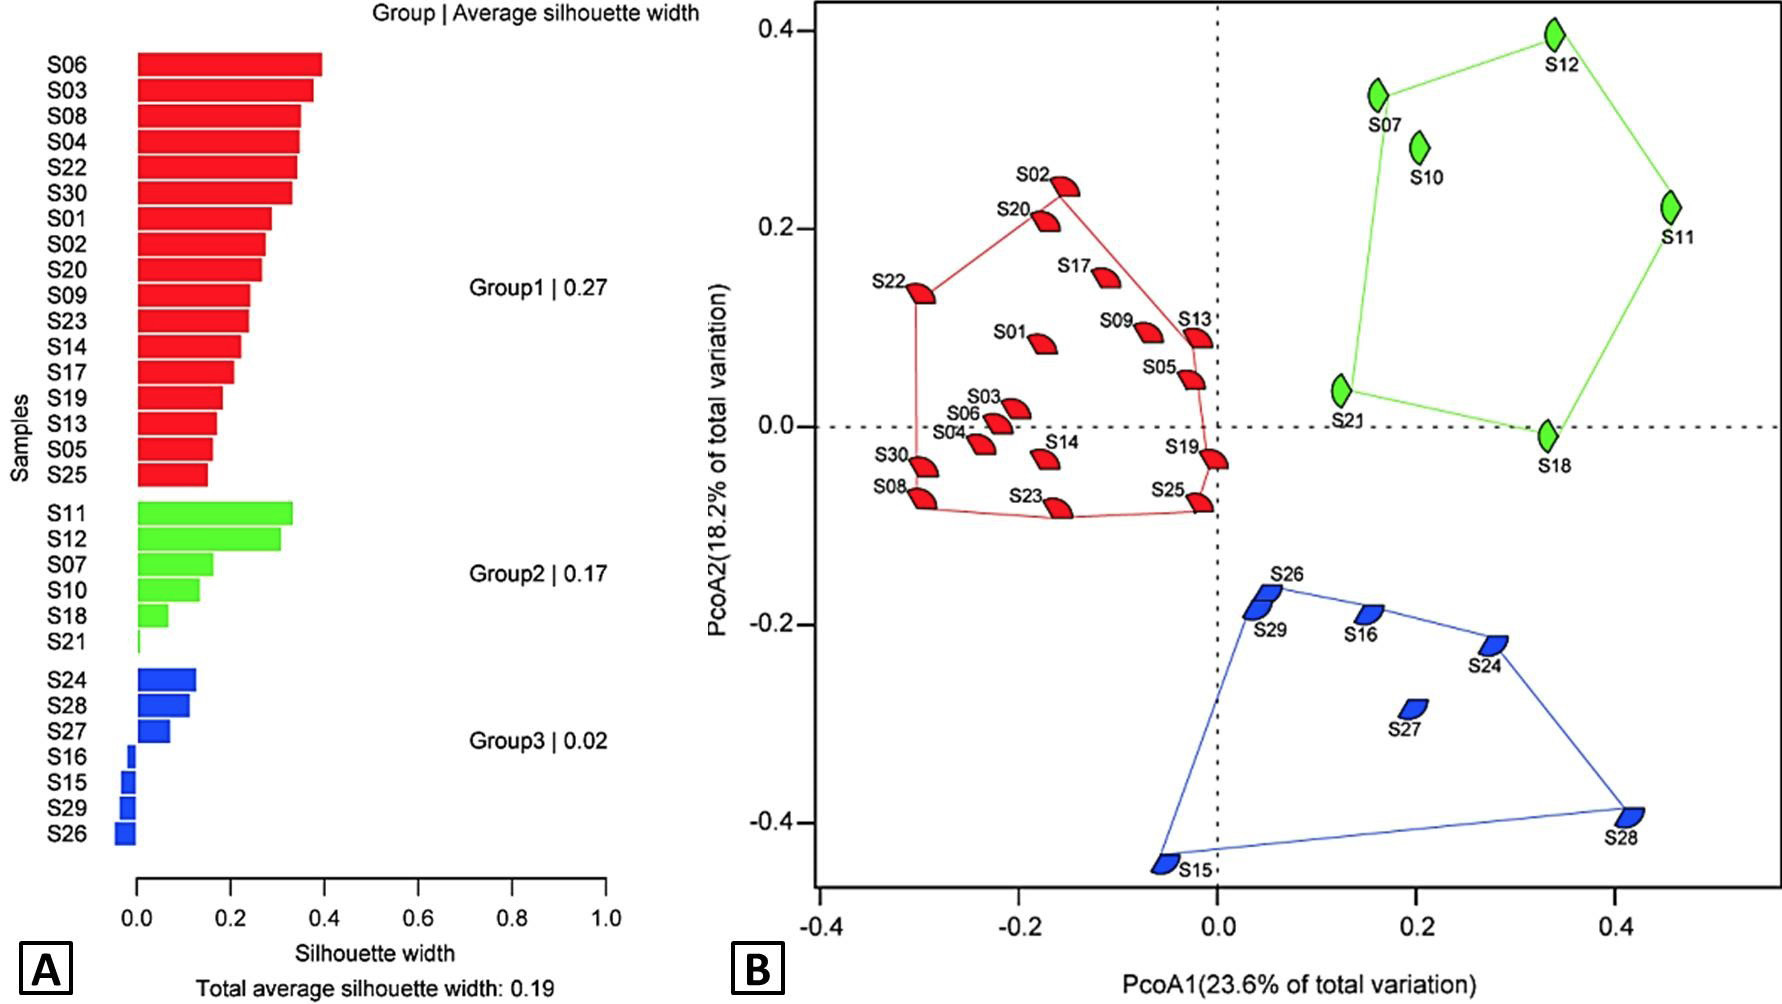
Clusters in the study sites were generated by (A) Fuzzy clustering analysis and (B) PcoA ordination based on fourth root transformed abundances and Bray-Curtis dissimilarity in every sampling stations.

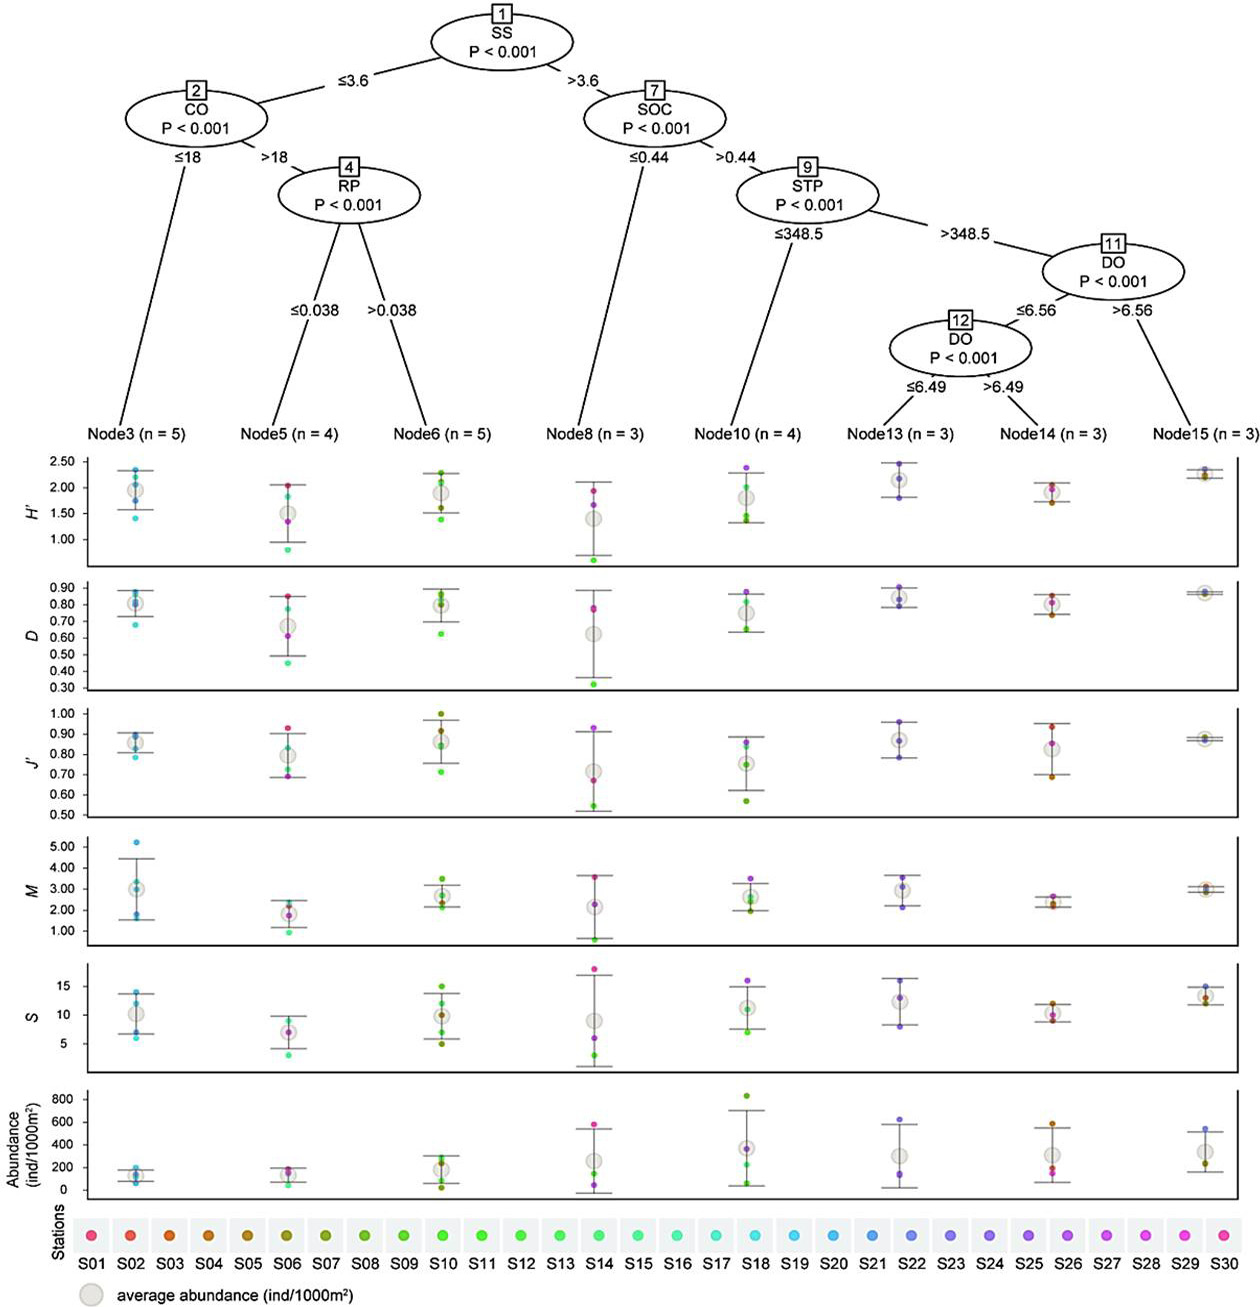
Conditional inference tree for total abundance and richness indexes with environmental variables of every sampling stations based on fourth root transformed responses. For each inner node, the Teststatistic P-values are given and the conditional independence tests as α = 0.05, the response variables are displayed for each terminal node (Mean ± SD). The units of each environmental variables are showed in Figure 3. Environmental variables code: SS, Sedimentary sulfide; SOC, Sedimentary organic carbon; STP, Sedimentary total phosphorus; DO, Dissolved oxygen; CO, Water colour; RP, Reactive phosphorus.

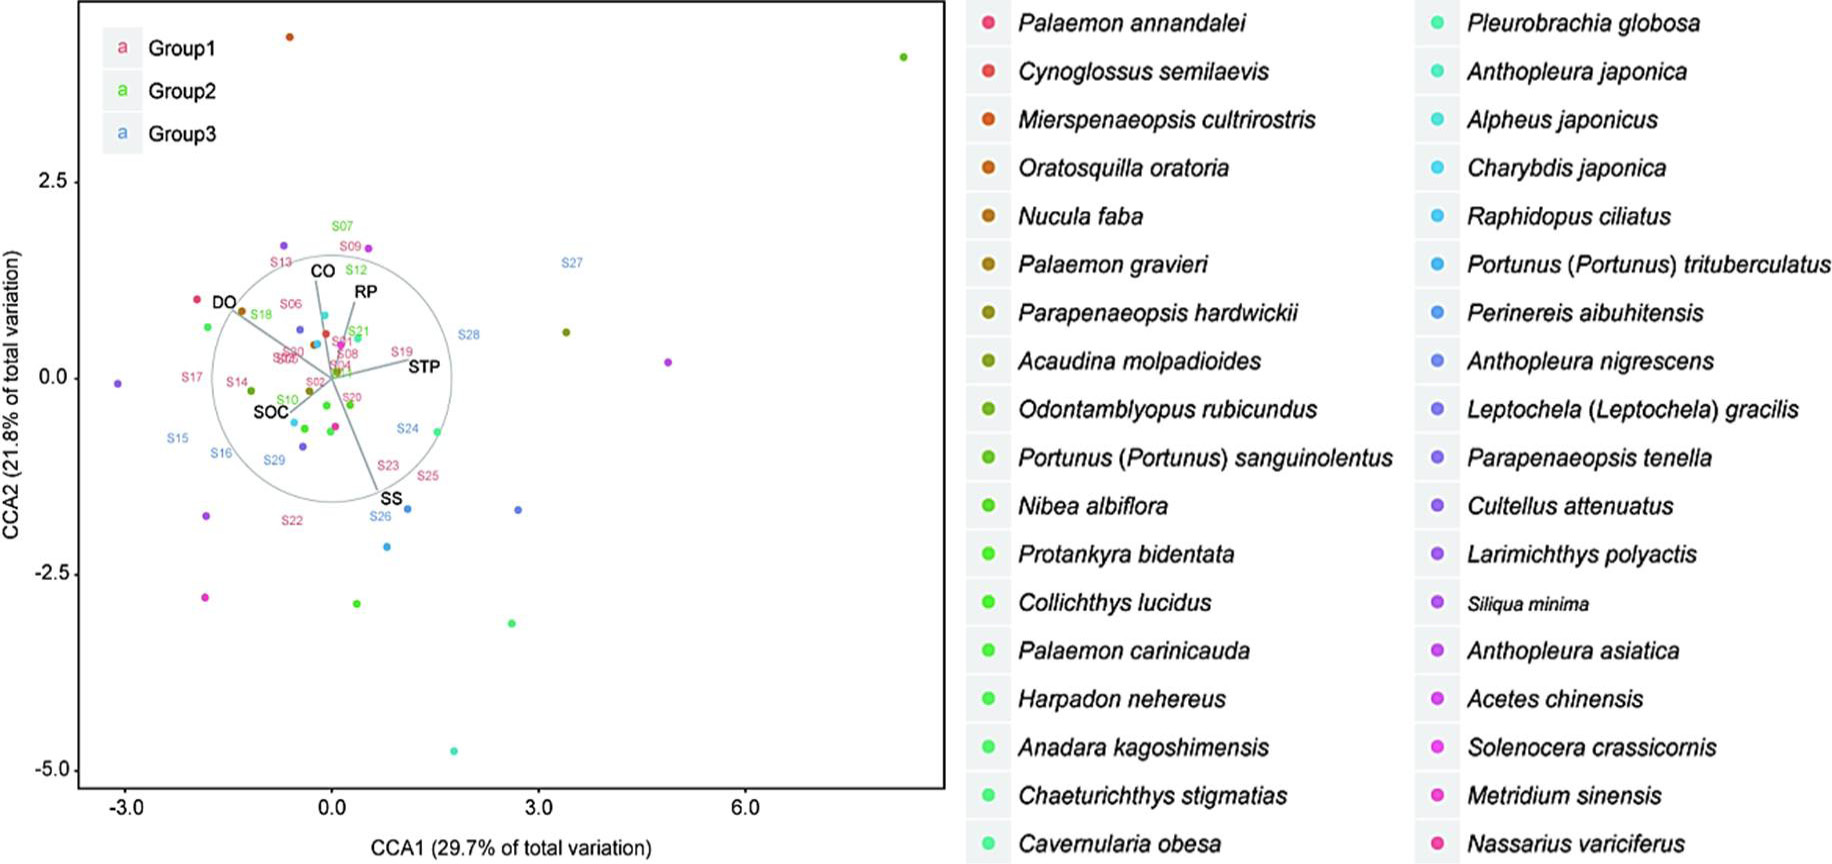
CCA ordination among the species, sampling stations and environmental variables was built based on fourth root transformed abundances and log(x+1) transformed fitted-environmental variables that selected from conditional inference tree analysis. The length of the arrow is adjusted to 2.76times for the physical size of the plot. Environmental variables code: SS, Sedimentary sulfide; SOC, Sedimentary organic carbon; STP, Sedimentary total phosphorus; DO, Dissolved oxygen; CO, Water colour; RP, Reactive phosphorus.


