

Stock Evaluation of the Data-Limited Fisheries: A Case Study of Five Major Commercially Important Fishes from the Western Indian Ocean, Pakistan


Stock Evaluation of the Data-Limited Fisheries: A Case Study of Five Major Commercially Important Fishes from the Western Indian Ocean, Pakistan
Hasnain Raza1,2, Qun Liu1*, Muhammad Tariq Hanif2 and Yanan Han1
1College of Fisheries, Ocean University of China, Qingdao 266003, China
2Marine Fisheries Department, Government of Pakistan, Karachi 74000, Pakistan
ABSTRACT
Evaluating the stock status is one of the most fundamental part of the dynamic cycle of fisheries management intended to secure our aquatic resources. Indeed the stock assessments not only provide a technical foundation for setting up yearly fisheries harvest levels but also offers a wide variety of other fishery-related measures for management purposes. To do so, we used two newly developed Catch-based Monte Carlo method of estimating MSY (CMSY) and the Bayesian state-space Schaefer production model (BSM) based on the catch and effort time series data from (1993-2017) from the Western Indian Ocean (WIO), Pakistan. The five major fish species of commercial importance exploited by heterogeneous fishing fleets in the Exclusive Economic Zones (EEZs) of Pakistan have been undertaken as a case study for the stock evaluation. Altogether, both the models estimated largely similar results. The stock status results indicate that Euthynnus affinis and Rachycentron canadum were healthy, while Scomberomorus commerson and Parastromateus niger were overfished and Lutjanus argentimaculatus was strongly overfished. However, all the stocks were subjected to overfishing. Therefore, the parameters estimated from our study may be used as indicators for the sustainable management of the fisheries in the country.
Article Information
Received 08 November 2021
Revised 23 December 2021
Accepted 11 January 2022
Available online 12 May 2022
(early access)
Published 25 February 2023
Authors’ Contribution
HR was responsible for collecting and processing the data and completed the first draft under the supervision of QL. MTH guided on data analysis and contributed to the editing of the submitted manuscript along with YH.
Key words
Western Indian Ocean (WIO) Pakistan, data-limited stock evaluation, CMSY, BSM
DOI: https://dx.doi.org/10.17582/journal.pjz/20211108201136
* Corresponding author: qunliu@ouc.edu.cn
0030-9923/2023/0003-1099 $ 9.00/0
Copyright 2023 by the authors. Licensee Zoological Society of Pakistan.
This article is an open access article distributed under the terms and conditions of the Creative Commons Attribution (CC BY) license (https://creativecommons.org/licenses/by/4.0/).
INTRODUCTION
The world’s fisheries have been threatened by stock depletion. Despite massive efforts to improve fisheries management, the success rate is still limited (Beddington et al., 2007). Evaluating and reporting stock status requires comprehensive data. Conversely, most global fisheries were data-poor or data-limited in reality, and the tendency against estimating data-limited stock status for efficient management decisions is rising (Dowling et al., 2019). The worldwide fisheries dilemma has been driven by unsustainable resource exploitation for decades. Eventually, this would cause the collapse of world fisheries (Pauly et al., 1998). The rapid reduction in major fish stocks has raised serious concerns about the effects of overfishing on aquatic resources (Myers and Worm, 2003). In particular, overfishing has been considered for the collapse of the world’s fisheries stocks, albeit the fact that 63% of the assessed fish stocks require rebuilding and lower exploitation rates to reverse the global depletion process (Worm et al., 2009).
Pakistan has a coastline of 990 km long, split into two parts, i.e., Sindh and Balochistan coast. However, the maritime zones covered an area of 240,000 square km with the extension of 350 square nautical miles (nmi) of the continental area from the coast (Pakistan, 2016) (Fig. 1). The fisheries sector of the country accounted for less than 0.4% of the Gross Domestic Production (GDP). Yet, the marine sector plays a pivotal role in the economic upsurge for the peoples along the coastal belt of the Sindh and Balochistan provinces. Notably, the marine capture production was reported to be 360,000 tons in 2015, although the fish production was peaked in the early 90’s and declined after 2000. In fact, most of the fish stock has been overfished, apart from a few stocks indicating low fishing mortality and signs of producing sustainable catches in the future (Patil et al., 2018).
The focal objective of this study is to produce robust and reliable estimates by applying a data-limited approach to assess the stock status of selected fish stocks of commercial importance. To do so, the Catch-based Monte Carlo Method of estimating MSY (CMSY) and Bayesian State-Space Surplus Production Modelling (BSM) approach have been used for the evaluation of the stocks (Froese et al., 2017). In the literature, several studies also demonstrated the similar (CMSY and BSM) method to assess the fish stocks of their relevant eco-regions (Ju et al., 2020; Wang et al., 2020; Ren and Liu, 2020; Liang et al., 2020; Rabby et al., 2019).
The CMSY method mainly relies on the Monte Carlo technique to estimate fisheries reference points from catch time-series data, species resilience and qualitative stocks status knowledge of the data-limited stocks. Alternatively, the Bayesian state-space method (BSM) fitted the catch and abundance index (CPUE) data. Provided that, the informative priors of the unexploited stock size (k), relative biomass and catchability coefficient (q) were derived from population dynamics of the species under evaluation. Ultimately, both the models gave robust predictions of the maximum net productivity (r), carrying capacity (k), maximum sustainable yield (MSY) and the estimates of stock status B/BMSY and F/FMSY (Froese et al., 2017). The results will help to understand the stock status of exploited fishery stocks to enable effective management decisions.
In this study, we assessed five major stocks of commercial importance in the Western Indian Ocean (WIO), Pakistan, namely Scomberomorus commerson, Euthynnus affinis, Rachycentron canadum, Parastromateus niger and Lutjanus argentimaculatus using CMSY and BSM approach. This study provided an understanding of the latest methodology to estimate the fisheries reference points with catch and effort time-series data.
MATERIALS AND METHODS
Data acquisition
In this study, the database termed FishStatJ serves as the key source of global data to evaluate and interpret the fisheries trends at the national level (Jacquet et al., 2010). The FAO global capture production database (http://www.fao.org/fishery/statistics/software/fishstatj/en) was used to compile fishery-dependent catch time-series data for five major commercially significant fish species from 1993 to 2017 (FAO, 2019). The effort data for the same period were compiled from the ‘Handbook of Fisheries Statistics of Pakistan’ and acquired from data sheets of the Marine Fisheries Department, Government of Pakistan (MFD, 2017). The catch data are in tons-live weight and efforts are in a number of fishing boats in each year viz. namely Trawlers, Gillnetters and trolling in the Western Indian Ocean (WIO), Pakistan. The statistical summary of the observed catch data from the fishery for case study stocks are presented in (Table I). Stock status definition based on the criterion of stock status by Froese et al. (2016, 2018) and Palomares et al. (2018). The abundance index or catch-per-unit-effort (CPUE) is calculated by using the formula (Jul-Larsen et al., 2003).
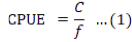
Where, C is catch and f is fishing effort.
Table I. Catch (tons) statistics of the five major stocks.
|
Stock |
Mean±SD (Range) |
|
Scomberomorus commerson |
9512.48±1977.69 (7049-13941) |
|
Euthynnus affinis |
2935.84±1437.12 (1210-6236) |
|
Rachycentron canadum |
2448.72±829.36 (1136-3923) |
|
Parastromateus niger |
2381.84±626.88 (1675-4914) |
|
Lutjanus argentimaculatus |
2124±662.46 (1121-3195) |
CMSY model (Catch-based Monte Carlo Method)
Surplus production models (SPM) are among the simplest and most extensively used methods to assess and manage fishery stocks. These models often required limited catch and effort data for the estimation of fisheries reference points such as MSY, biomass, depletion level and optimal fishing effort (Bonfil, 2005).
However, the CMSY method provides an alternate tool for estimating the fisheries biological reference points based on catch and resilience information of the species (Froese et al., 2017). Henceforth the modeling framework of CMSY to estimate MSY and relevant fisheries reference points based on Schafer’s (1954) model formulation:
Bt+1 = Bt + rBt (1- Bt / K) - Ct …(2)
Where Bt is the fish biomass at time t, r is the intrinsic rate of population growth, carrying capacity K and Ct is the catch in weights. CMSY algorithm detects the “viable r-k” pairs through the Monte Carlo filtration approach. Froese et al. (2017) demonstrated that the viable r-k pairs are found at the tip of the logarithmic triangular-shaped plot (highest r-values) due to the fact that r is termed as the maximum net productivity for the examined fish stock. Whilst, previously it was assumed that viable r-k pairs as the geometric mean of the distribution (Martell and Froese, 2013).
Setting-up analysis phase of CMSY
Prior ranges of resilience r from the ecological point of view, the species resilience is defined as the degree or measure of the species ability to absorb the ecological disturbance and adjust by enduring the perturbations and still persistent (Holling, 1973). The prior boundaries of the five fish species resilience were drawn from FishBase (Froese and Pauly, 2019) (Table II).
Table II. Prior ranges and status of species resilience r from FishBase (Froese and Pauly, 2019).
|
Stocks |
Resilience |
|
|
Prior ranges r |
Status |
|
|
Scomberomorus commerson |
0.51 – 1.15 |
Medium |
|
Euthynnus affinis |
0.37 – 0.85 |
Medium |
|
Rachycentron canadum |
0.41 – 0.94 |
Medium |
|
Parastromateus niger |
0.37 – 0.85 |
Medium |
|
Lutjanus argentimaculatus |
0.34 – 0.76 |
Medium |
Prior ranges of unexploited stock size k
The maximum catch of the species were used to determine the prior ranges of the carrying capacity (k). The prior boundaries of k has been summarized in Equations 3 and 4 as follows;
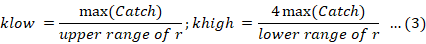

Where klow and khigh are lower and upper limits of the prior range of k. The Equation 3 accounts for the stocks with low prior biomass, while Equation 4 applied for the stocks with high prior biomass at the end of the given time series dataset. Additionally, the data were smoothed by 3 years of moving average in order to reduce the influence of extreme values of catches (Froese et al., 2017).
Prior ranges of initial, intermediate and final relative biomass ranges (Bt/k)
In this study, the initial prior biomass (Bstart/k) was set to a medium depletion level as 0.2–0.6. Similarly, the intermediate prior biomass (Bint/k) ranges for the P. niger was set to high as 0.5–0.9 due to increased fishing pressure on the exploitable stock. Alternatively, all other 4 stocks have medium level of depletion. Lastly, the final or end prior (Bend/k) biomass ranges for the stocks such as R. canadum (Cobia), S. commerson (narrow-barred Spanish Mackerel) and E. affinis (Kawakawa) was set to high 0.5 - 0.9, apart from L. argentimaculatus (Mangrove red snapper) and P. niger (black pomfret) which was set as medium depletion level 0.2-0.6 (Table III).
BSM model (Bayesian state-space Schaefer surplus production method)
The added information of the relative abundance CPUE in a given time series may provide a cutting-edge approach to assess the data-poor fisheries in the form of Bayesian state-space surplus production models (Best and Punt, 2020). The uncertainty in stock status estimates may overwhelm using the Bayesian estimation approach in the fisheries stock assessment and conveying reliable scientific advice to stakeholders regarding exploitable biomass over time (Brodziak and Ishimura, 2011). For the management advice, the state space Bayesian Schaefer method has been augmented with the CMSY R code. In addition, the program termed as Just another Gibbs Sampler JAGS was used for the analysis of Bayesian hierarchal models with Markov Chain Monte Carlo MCMC algorithm to sample out the parameters probability distributions (Plummer, 2003).
Table III. Suggested prior biomass ranges of the stock under assessment from Supplementary material (Froese et al., 2017).
|
Stocks |
Bstart/k |
Bint/k |
Bend/k |
|
Scomberomorus commerson |
0.2 - 0.6 |
0.2 - 0.6 |
0.5 - 0.9 |
|
Euthynnus affinis |
0.2 - 0.6 |
0.2 - 0.6 |
0.5 - 0.9 |
|
Rachycentron canadum |
0.2 - 0.6 |
0.2 - 0.6 |
0.5 - 0.9 |
|
Parastromateus niger |
0.2 - 0.6 |
0.5 - 0.9 |
0.2 - 0.6 |
|
Lutjanus argentimaculatus |
0.2 - 0.6 |
0.2 - 0.6 |
0.2 – 0.6 |
Note: Default biomass ranges from Froese et al., 2017; Low= 0.01- 0.4, Medium= 0.2 – 0.6, High= 0.5 – 0.9, respectively.
Setting-up analysis phase of BSM
The relative stock abundance data of the examined stocks conceive in terms of units of number per fishing hour /boat or derived estimates of relative biomass from fishery-independent survey catches. Typically such abundance index can be expressed with the catchability coefficient q:
CPUEt = qBt … (5)
Where CPUEt, Bt and q were the mean catch per unit of effort, biomass and catchability coefficient, respectively. By substituting the abundance index CPUE into the Schaefer production model, we can get Equation 6.
CPUEt = CPUEt+r (1-CPUEt /(qk)) CPUEt - qCt …(6)
The lower and higher priors of catchability coefficient q for the recent high prior biomass can be calculated from Equations 7 and 8.
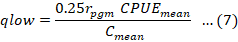
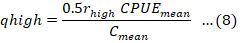
Where qlow is lower and qhigh is upper prior for catchability coefficient for stocks with high current biomass, the geometric mean of the prior range for r is rpgm, the upper prior range for r is rhigh, CPUEmean is the average of catch per unit effort for final 5 or 10 years, and Cmean is the average catch in a similar period. When the stocks are with low recent prior biomass, the multipliers were changed and derived from Equations 9 and 10, respectively.

However, the mean catch and CPUEmean were taken for the last 5 years for medium or high and 10 years for low or very low resilience species.
RESULTS
The estimates of fisheries reference points (r, k, MSY, B/BMSY and F/FMSY) and stock status distributed in the Western Indian Ocean (WIO), Pakistan are in Table IV. The estimates from the CMSY method for Scomberomorus commerson (r= 0.956, k= 43600 t, MSY=10400 t), Euthynnus affinis (r= 0.689, k= 23900 t, MSY=4120 t), Rachycentron canadum (r= 0.763, k= 15100 t, MSY=2880 t), Parastromateus niger (r= 0.689, k= 14400 t, MSY=2480t) and Lutjanus argentimaculatus (r= 0.613, k = 16200 t, MSY=2470 t). Similarly, the results from BSM method indicate the estimates for S. commerson (r = 0.531, k = 70700 t, MSY=9390 t), E. affinis (r = 0.418, k = 34300 t, MSY=3590 t), R. canadum (r = 0.491, k = 21800 t, MSY=2680 t), P. niger (r = 0.689, k = 13500 t, MSY=2330 t) and L. argentimaculatus (r = 0.516, k = 16200 t, MSY=2040 t), respectively.
The B/BMSY estimates of Cobia (R. canadum) and Kawaka (E. affinis) were > = 1 in BSM, which shows that both stocks in healthy state. The stocks S. commerson and P. niger were < 1 in BSM, which signifies overfished. The L. argentimaculatus was < 0.5 indicating the strongly overfished state and outside of the safe biological limit criterion of stock status. In all the cases, the estimates of fishing mortality ratio F/FMSY > 1, which indicates overfishing. It is evident from the results that a considerable amount of fishing pressure has been exerted from a fishery which led the fish stocks fully and strongly overfished. Figures 2-6 represents the catch trends (highest to lowest peaks) with data smoothed three-years moving average, Relative biomass B/k level, Equilibrium curve, Exploitation rate and Kobe plot for each stock catch and effort data during 1993 to 2017.
DISCUSSION
CMSY and BSM conceptualization, limitations and trends
The concept of CMSY is the modified form of the Catch-at-MSY model. Whilst, the modeling framework of Stock Reduction Analysis (SRA) (Froese et al., 2017) was the motivation behind the Catch-at-MSY. Even though, the SRA does not explicitly fall under the production models category. It is a unique method to estimate the sustainability curve by using the exponential form of catch equations and yearly catches logged in terms of species weight (Froese et al., 2017; Martell and Froese, 2013; Kimura et al., 1984). The BSM was instigated on the Bayesian state-space modeling approach. Both methods can estimate the standard fisheries reference points MSY= r k/4, FMSY = 0.5 r and BMSY = 0.5 k, respectively. Prior to this, the CMSY and BSM approach have the ability to produce robust and accurate estimates of fisheries reference points but in generally dependent on the careful selection of prior ranges for the stocks under evaluation. Due to this limitation, the wrong selection of prior ranges may lead the analysis to produce highly biased estimates (Froese et al., 2017).
The results of our findings and trends from CMSY and BSM of five commercially important fish stocks captured by Pakistani fishing fleets were similar in aspects of r and k estimations, stock size trajectory, and exploitation ratio, which are discussed as under.
Scomberomorus commerson (Narrow- Barred Spanish Mackerel, Lacepede, 1800)
S. commerson belongs to the family Scombridae, locally termed as Ghore, and has a wide distribution from Indo-Pacific Asia to southeastern Australia. Commonly a pelagic fish inhabiting the shallow water, dominantly caught by gillnetters through pelagic and set gillnets and feeds on schools of small fishes such as clupeids, anchovies, carangids and sardines (Psomadakis et al., 2014; Froese and Pauly, 2019). The species is commercially important and consumed locally in small quantities. Neritic tuna (Spanish mackerel) contributes a catch share of 20.2% of the total large pelagic fish landings in the country. However, a sudden drop of catch share has
Table IV. Results of the estimates of the fisheries reference points (r, k, MSY, B/BMSY, F/FMSY) and stock status of the five major exploited stocks in Pakistani water’s using CMSY and BSM methods.
|
|
|
S. commerson |
E. affinis |
R. canadum |
P. niger |
L. argentimaculatus |
|
CMSY |
r |
0.956 |
0.689 |
0.763 |
0.689 |
0.613 |
|
(0.783 - 1.17) |
(0.566 - 0.839) |
(0.628 - 0.928) |
(0.566 - 0.839) |
(0.499 - 0.75) |
||
|
K |
43600 |
23900 |
15100 |
14400 |
16200 |
|
|
(33500 - 56800) |
(17800 - 32100) |
(11700 - 19500) |
(10900 - 19000) |
(12400 - 21100) |
||
|
MSY |
10400 |
4120 |
2880 |
2480 |
2470 |
|
|
(91700 - 11800) |
(3390 - 5000) |
(2550 -3260) |
(2110 - 2910) |
(2110 - 2910) |
||
|
B2017/k |
0.6 |
0.6 |
0.52 |
0.52 |
0.5 |
|
|
(0.502 - 0.613) |
(0.502 - 0.607) |
(0.501 - 0.584) |
(0.242 - 0.597 ) |
(0.288 - 0.598) |
||
|
F2017/FMSY |
0.998 |
1.23 |
1.31 |
0.969 |
0.481 |
|
|
BSM |
r |
0.531 |
0.418 |
0.491 |
0.689 |
0.516 |
|
(0.419 - 0.672) |
(0.315 - 0.556 ) |
(0.362 - 0.665) |
(0.536 - 0.886) |
(0.499 - 0.752 ) |
||
|
K |
70700 |
34300 |
21800 |
13500 |
16200 |
|
|
(56300 - 88900) |
(25700 - 45800) |
(16800 - 28400) |
(10700 - 17100) |
(12400 - 21100) |
||
|
MSY |
9390 |
3590 |
2680 |
2330 |
2040 |
|
|
(8280 - 1060) |
(2610 - 4920) |
(2130 - 3360) |
(2150 - 2520) |
(1720 - 2430) |
||
|
B2017/BMSY |
0.9 |
1.12 |
1.14 |
0.7 |
0.4 |
|
|
(0.731 – 1.02) |
(0.882 – 1.46) |
(0.895 – 1.52) |
(0.469 - 0.889) |
(0.31 - 0.43) |
||
|
F2017/FMSY |
1.4 |
1.36 |
1.28 |
1.63 |
2.37 |
|
|
BMSY |
35400 |
17100 |
10900 |
6750 |
7930 |
|
|
(28200 - 44400) |
(12800 - 22900) |
(83900 - 14200) |
(5330 - 8550) |
(6430 - 9770) |
||
|
B2017 |
30300 |
19100 |
12500 |
4410 |
2840 |
|
|
(26000 – 36200) |
(15100 – 25100) |
(97700 – 16600) |
(3100 – 6000) |
(2440 – 3880) |
||
|
Stock status |
Overfished |
Healthy |
Healthy |
Overfished |
Strongly overfished |
|
Note: Stock status, F/FMSY and B/BMSY in the last year of time series; estimates in small brackets are the 95% confidence limits.
been reported of neritic tuna during the last 15 years that is less than 5% of the total tuna landings (Khan, 2017). A sharp decline was observed during the beginning of the time series of catch data. Later two catch peaks have been detected in the year 2014 and 2016 (Fig. 2A). The stock evaluation of neritic tuna is somehow a challenging task due to the data-limited or data-poor scenario. the Indian Ocean Tuna Commission (IOTC) often assessing the fish stocks of the Indian Ocean by using similar catch-based methods and implied that the stocks of S. commerson have been overfished due to overfishing (Martin, 2015). However, the current stock evaluation estimates predicted the lower biomass B2017 = 30300t at BMSY = 35400t, which shows the amount of biomass in the water for the stock was insufficient to produce long-term sustainable biomass in the future. Similarly, the estimates of biological and fisheries reference point B2017/BMSY = 0.9 and F2017/FMSY= 1.4 suggested that the stock is “overfished” subject to “overfishing”. The estimates and findings observed from this study mirror to those of the previous studies that have examined the stock status of the S. commerson in the region.
Euthynnus affinis (Kawakawa, Little or Mackerel Tuna Cantor, 1849)
E. affinis also belongs to the family Scombridae, locally termed as Chunki or Budki. An epipelagic and neritic species are highly migratory and have been widely distributed from Indo-West Pacific (Psomadakis et al., 2014; Froese and Pauly, 2019). However, the artisanal fleets were engaged in catching the neritic tuna through gillnets. In addition, the recent estimates of neritic tuna catches were low comparatively to the previous years. For instance, the recent kawakawa catches declined up to 70% of the total tuna landings in the country (Khan, 2020; IOTC, 2015). Similarly, the estimates of our research B2017/k= 0.6 also indicate recent resource depletion. The sharp decline can also be observed during the years 2015 and 2017 of the catch data (Fig. 3A). The relative biomass was on a decreasing trend from 2015 onwards (Fig. 3B). The one possible reason is that the artisanal fleets previously engaged in catching Indian mackerel have recently returned to capture the neritic tuna due to the decline of Indian mackerel stocks (Khan, 2018; IOTC, 2015). In contrast, the study on the stock assessment of Indian Ocean kawakawa (little tuna) has been conducted by IOTC using similar catch-based (Catch-MSY and Optimized Catch Only Method, OCOM), and the results from the research indicated that from CMSY the stocks were “overfished’’ due to overfishing. Rather, the OCOM model results were more realistic and appropriate and suggested that the kawakawa stocks were not “overfished’’ and the final stock status in healthy (IOTC, 2015). In accordance with the previous work, the results from our findings (B2017/BMSY = 1.12, F2017/FMSY = 1.4, B2017 = 19100t > BMSY =17100t) also suggested that the final stock status of the kawakawa (mackerel tuna) is Not Overfished, the BSM method which is similar with OCOM approach predicted that the stock is in “Healthy’’ state, apart from overfishing (Zhou et al., 2018). Besides, the Kobe plot in (Fig. 3F) also depicts that the stocks were healthy but affected by overfishing. The findings of the current study support the previous stock assessment studies (IOTC, 2015).
Rachycentron canadum (Cobia, Linnaeus, 1766)
R. canadum is the coastal pelagic and monotype of the Rachycentridae family. It is commonly named as ling-lemon and crab-eater fish and locally termed as Sangra and Sanglore. Usually, the species has a cosmopolitan distribution from tropical to subtropical seas, dominantly inhabit coastal and continental shelf areas. However, the sea temperature is the one main factor for the determination of their range (Franks, 2002; Kaiser and Holt, 2005; Psomadakis et al., 2014; Froese and Pauly, 2019). The high price and high-value fish have enormous commercial importance and are a vital source of foreign earnings. During the early to mid-80, the commercial landings were highest in Pakistan and considered to be the world’s largest producer of cobia fish (Shaffer and Nakapura, 1989). In this study, the estimates of MSY were observed to be 2900 tons from CMSY and 2700 tons from BSM approach, which are consistent with the study of Zhang et al. (2020) used a previous version of Catch-at-MSY. Conversely, the parameter B2017/k = 0.5 shows a moderate level of biomass depletion. Though the points falling outside the Equilibrium curve represents overfishing and shrinkage of biomass (Fig. 4C), albeit of the fact that Schaefer parabola is not suitable for parameter estimation in some scenarios, whilst it is useful for the evaluation of CMSY and BSM results (Froese et al., 2017). Altogether, the results of BSM (B2017/BMSY = 1.14, B2017 = 12500t > BMSY = 10900t) signifies that R. canadum stock is in “Healthy” state and still a substantial amount of biomass is present to produce long-term sustainable yield. Moreover, the management plot clearly depicts the healthy biomass status of the stock under assessment (Fig. 4F).
Parastromateus niger (Black pomfret, Bloch, 1795)
Black pomfret belongs to the Carangidae family and have widely distributed from Indo- West Pacific to the southern waters of Japan and Australia. It is locally called as Kala paplait and Karo–pitho. Usually inhabiting over the muddy bottoms and continental shelf area (Psomadakis, 2015; Froese and Pauly, 2019). The total landings of P. niger were shown fluctuations and considerable variability from 1993 to 2012. After that phase, the catches show some increasing trend (Fig. 5A). The estimates of B2017/k = 0.52 implies biomass depletion. Similarly, the parameter B2017/BMSY = 0.7 and the end biomass B2017 = 4410t, which was less than biomass at sustainable level BMSY = 6750 t (B < BMSY) indicate the stock depletion at the “Overfished” level due to “Overfishing” (F2017/FMSY = 1.63). The results from this study is in line with a previous assessment which was done during the Fisheries Resource Appraisal Programme (FRAP); the comprehensive report on the stock status of several fish species, including pomfret fisheries in the country, suggested that biomass has significantly declined due to the increasing trends of overfishing for last 15 years. However, there is no hope for stock rebuilding and the chances of stock collapse will be higher under the current scenario of fishing effort (Fanning et al., 2016). Additionally, the Kobe plot of black pomfret from our study also demonstrated a clear indication of resource depletion due to excessive fishing (Fig. 5F).
Lutjanus argentimaculatus (Forksskal, 1775)
L. argentimaculatus commonly called as Mangrove Red Snapper belong to the Lujanidae family. Usually inhabiting the estuaries and mangrove areas and caught mainly with gillnet and sub-gear includes bottom trawls and hooks (trolling). Locally popular as Hira fish. The species is widely dispersed from Indo-West Pacific to the eastern Mediterranean through Suez Canal (Psomadakis, 2015; Froese and Pauly, 2019). Notwithstanding, the snappers were exported in fresh or frozen from Asia to European countries. However, the results from the previous studies indicate that the L. argentimaculatus stock has been strongly declined to near zero. Additionally, the previous estimates of MSY=2166t, while the ratio of B/BMSY = 0.3 and the ratio of fishing mortality at MSY was estimated to be F/FMSY = 2.21 (Fanning et al., 2016). The previous work (Fanning et al., 2016) showed similar estimates, such as MSY=2470t from CMSY and MSY=2000t from the BSM approach. The parameters of stock status B2017/BMSY = 0.4 and current stock biomass B2017 = 2840t < BMSY = 7930t. Clearly, the exploitation rate depicts in (Fig. 6E) shows a rapid upward trend after 2011. The Kobe plot (Fig. 6F) shows that after the year 2000, the fishing mortality rapidly increase and the stock undergo a rapid depletion. Consequently, the stock is now classified as “Strongly Overfished”, due to an extreme level of “Overfishing” (F2017/FMSY = 2.4).
CONCLUSION
This study was to assess the data-limited fish stocks in Pakistan by using the newly developed CMSY and BSM modeling approaches. Both the methods provided reasonable estimates of fisheries reference points of all the selected stocks under evaluation. The trends on the stocks were also comparable to the previous studies. In general, the findings suggested that all the stocks were heavily affected by overfishing, and the rapid increase in fishing pressures since the last 15 years would have overfished many fish stocks and continuation of fishing would result in stock depletion or collapse in the near future. This study finds that some stocks such as neritic tuna (E. affinis) and cobia (R. canadum) were in a healthy state, even after subjected to heavy overfishing. The first and foremost management procedure that the governing body should adopt is to reduce the fishing effort, which would be the leading cause of stock depletion. For this, we may suggest the adoption of vessel decommissioning schemes or vessel buybacks, limited entry for resource exploitation, limited vessel licensing to control further fishing effort and gear restriction. We may suggest that now it may be the time to implement and enforce the fisheries laws. To summarize, all these recommended management plans would help in rebuilding the collapsed stocks and recovering the overfished stocks and maintain the fishery sector more profitably and sustainably. Even though it is encouraging to use CMSY and BSM approach to evaluate the stocks for effective fisheries management and policy guidance, future research may concentrate on the investigations by taking into account the relationship of fish stocks on the entire ecosystem, i.e., Ecosystem-Based Fisheries Management (EBFM) may be a more complete and proper way of managing fisheries resources.
ACKNOWLEDGMENTs
HR acknowledges sponsorship from The Chinese Scholarship Council (CSC) and The State Oceanic Administration (SOA) during his doctoral degree. Extended gratitude to The Marine Fisheries Department, Government of Pakistan for providing data and detailed stock assessment reports on the fishery of Pakistan.
Data availability statement
The datasets generated during this study are available from the corresponding author on reasonable request.
Funding
This work is financially supported by the basic research fund of Ocean University of China (201562030).
Statement of conflict of interest
The authors have declared no conflict of interest.
REFERENCES
Beddington, J.R., Agnew, D.J., and Clark, C.W., 2007. Current problems in the management of marine fisheries. Science, 316: 1713-1716. https://doi.org/10.1126/science.1137362
Best, J.K., and Punt, A.E., 2020. Parameterizations for Bayesian state-space surplus production models. Fish. Res., 222: 105411. https://doi.org/10.1016/j.fishres.2019.105411
Bonfil, R., 2005. Fishery stock assessment models and their application to sharks. FAO Fisheries Technical Paper (FAO). pp. 154-158.
Brodziak, J., and Ishimura, G., 2011. Development of Bayesian production models for assessing the North Pacific swordfish population. Fish. Sci., 77: 23-34. https://doi.org/10.1007/s12562-010-0300-0
Dowling, N.A., Smith, A.D., Smith, D.C., Parma, A.M., Dichmont, C.M., Sainsbury, K., and Cope, J.M., 2019. Generic solutions for data-limited fishery assessments are not so simple. Fish Fish., 20: 174-188. https://doi.org/10.1111/faf.12329
Fanning, P., Medley, P., Khan, M.W., and Valinassab, T., 2016. Comprehensive assessment of Pakistan’s marine fisheries resources to 2015. Report prepared for the fisheries resources appraisal in pakistan project (UTF/PAK/108/PAK). Food and Agriculture Organization of the United Nations and Marine Fisheries Department, Ministry of Ports and Shipping, Government of Pakistan. Rome, Italy. pp. 70–79.
FAO, 2019. Food and Agricultural Organization of the United Nations. Fishery and Aquaculture Statistics. Global capture production 1950-2017 (FishStatJ). In: FAO fisheries and aquaculture department [online]. Rome. www.fao.org/fishery/statistics/software/fishstatj/en. [Accessed on September, 2019]
Franks, J.S., 2002. A review of age, growth, and reproduction of cobia Rachycentron canadum from US waters of the Gulf of Mexico and Atlantic Ocean. Proc. 53rd Ann. Gulf Caribbean Fish. Inst., 2002: 553-569.
Froese, R., and Pauly, D., 2019. FishBase. World wide web electronic publication. Available online at: https://www.fishbase.de/ (accessed November 2020)
Froese, R., Demirel, N., Coro, G., Kleisner, K.M., and Winker, H., 2017. Estimating fisheries reference points from catch and resilience. Fish Fish., 18: 506-526. https://doi.org/10.1111/faf.12190
Froese, R., Garilao, C., Winker, H., Coro, G., Demirel, N., Tsikliras, A., and Sampang-Reyes, A., 2016. Exploitation and status of European stocks. World Wide Web electronic publication, http://oceanrep.geomar.de/34476/, pp. 144.
Froese, R., Winker, H., Coro, G., Demirel, N., Tsikliras, A.C., Dimarchopoulou, D., and Matz-Lück, N., 2018. Status and rebuilding of European fisheries. Mar. Policy, 93: 159-170. https://doi.org/10.1016/j.marpol.2018.04.018
Holling, C.S., 1973. Resilience and stability of ecological systems. Annu. Rev. Ecol. Syst., 4: 18-21. https://doi.org/10.1146/annurev.es.04.110173.000245
IOTC, 2015. Assessment of Indian Ocean kawakawa (Euthynnus affinis) using data poor catch-based method. IOTC–2015–WPNT05–21, pp. 21-24.
Jacquet, J., Zeller, D., and Pauly, D., 2010. Counting fish: A typology for fisheries catch data. J. Integ. environ. Sci., 7: 135-144. https://doi.org/10.1080/19438151003716498
Ju, P., Tian, Y., Chen, M., Yang, S., Liu, Y., Xing, Q., and Sun, P., 2020. Evaluating stock status of 16 commercial fish species in the coastal and offshore waters of taiwan using the CMSY and BSM methods. Front. Mar. Sci., 7: 618. https://doi.org/10.3389/fmars.2020.00618
Jul-Larsen, E., Kolding, J., Overå, R., Raakjær, Nielsen, J., and Zwieten, P.A.M. 2003. Management, co-management or no management? Major dilemmas in southern African freshwater fisheries. 2. Case studies. FAO Fisheries Technical Paper. No. 426/2. Rome, FAO. 2003. pp. 71-78.
Kaiser, J.B., and Holt, G.J., 2005. Species profile. Cobia Southern Regional Aquaculture Center and the United States Department of Agriculture 7202. pp. 6.
Khan, M.F., 2018. Tuna fishery in Pakistan. Pakistan’s National Report to the Scientific Committee of Indian Ocean Tuna Commission, IOTC-2018-SC21-NR20, pp. 5–6.
Khan, M.M., 2020. Status of neritic tuna in Pakistan with special reference to Longtail Tuna, 10TH Working Party on Neritic Tunas (WPNT10). Indian Ocean Tuna Commission, IOTC-2020-WPNT10-INF03.
Khan, M.W., 2017. Tuna fishery in Pakistan. Pakistan’s National Report to the Scientific Committee of Indian Ocean Tuna Commission, IOTC-2017-SC20-NR20 Rev_1 2017, pp. 4–5.
Kimura, D.K., Balsiger, J.W., and Ito, D.H., 1984. Generalized stock reduction analysis. Can. J. Fish. aquat. Sci., 41: 1325-1333. https://doi.org/10.1139/f84-162
Liang, C., Xian, W., and Pauly, D., 2020. Assessments of 15 exploited fish stocks in Chinese, South Korean and Japanese waters using the CMSY and BSM methods. Front. Mar. Sci., 7: 623. https://doi.org/10.3389/fmars.2020.00623
Martell, S., and Froese, R., 2013. A simple method for estimating MSY from catch and resilience. Fish Fish., 14: 504-514. https://doi.org/10.1111/j.1467-2979.2012.00485.x
Martin, S., 2015. Assessment of Indian Ocean narrow-barred Spanish mackerel (Scomberomorus commerson) using data poor catch-based methods. Indian Ocean Tuna Commission Secretariat, IOTC–2015–WPNT05–23 2015, pp. 2–22.
MFD, 2017. Marine fisheries department. Handbook of Fisheries Statistics of Pakistan 1993-2017, Government of Pakistan.
Myers, R.A., and Worm, B., 2003. Rapid worldwide depletion of predatory fish communities. Nature, 423: 280-283. https://doi.org/10.1038/nature01610
Pakistan, M., 2016. A handbook on Pakistan’s coastal and marine resources. MFF Pakistan, Karachi, Pakistan. pp. 6-7.
Palomares, M.L., Froese, R., Derrick, B., Nöel, S.L., Tsui, G., Woroniak, J., and Pauly, D., 2018. A preliminary global assessment of the status of exploited marine fish and invertebrate populations. A report prepared by the Sea Around Us for OCEANA. pp. 60.
Patil, P.G., Kaczan, D.J., Roberts, J.P., Jabeen, R., Roberts, B.L., Barbosa, J.G., and Zuberi, S., 2018. Revitalizing Pakistan’s fisheries: Options for sustainable development. The World Bank. No. 127433, pp. 1-116.
Pauly, D., Christensen, V., Dalsgaard, J., Froese, R., and Torres, F., 1998. Fishing down marine food webs. Science, 279: 860-863. https://doi.org/10.1126/science.279.5352.860
Plummer, M., 2003. JAGS: A program for analysis of Bayesian graphical models using Gibbs sampling. Proc. 3rd Int. Works. Dist. Stat. Comp., 124: 1-10.
Psomadakis, P.N., 2015. Field identification guide to the living marine resources of Pakistan. pp. 314-315.
Psomadakis, P.N., Osmany, H.B. and Khan, W., 2014. Important coastal fishery species of Pakistan. A pocket guide. FAO FishFinder Programme. Rome.
Rabby, A.F., Rahman, M.A., Hossain, M.A., Haque, A.T., Bashar, M.A., and Mahmud, Y., 2019. A Bayesian population model to estimate Hilsa, Tenualosa ilisha, (Hamilton, 1822) stock size in open water fishery of Bangladesh using CMSY and BSM. Bangladesh J. Fish. Res., 18: 1-18.
Ren, Q-q. and Liu, M., 2020. Assessing northwest pacific fishery stocks using two new methods: The monte carlo catch-MSY (CMSY) and the bayesian schaefer model (BSM). Front. Mar. Sci., 7: 430. https://doi.org/10.3389/fmars.2020.00430
Schaefer, M., 1954. Some aspects of the dynamics of populations important to the management of commercial marine fisheries. Bull. Int. Am. Trop. Tuna Comm., 1: 26–56.
Shaffer, R.V., and Nakamura, E.L., 1989. Synopsis of biological data on the cobia Rachycentron canadum (Pisces: Rachycentridae). NOAA Technical Report NMFS 82. FAO Fish. Synop., 153: 15-16.
Wang, Y., Liang, C., Wang, Y., Xian, W., and Palomares, M.L., 2020. Stock status assessments for 12 exploited fishery species in the Tsushima Warm current region, Southwest Japan and East China, using the CMSY and BSM methods. Front. Mar. Sci., 7: 1-10. https://doi.org/10.3389/fmars.2020.00640
Worm, B., Hilborn, R., Baum, J.K., Branch, T.A., Collie, J.S., Costello, C., and Zeller, D., 2009. Rebuilding global fisheries. Science, 325: 578-585. https://doi.org/10.1126/science.1173146
Zhang, K., Geng, P., Panhwar, S.K., Memon, K.H., and Chen, Z., 2020. Maximum sustainable yield and development status of 24 commercial marine fish groups from Pakistani waters. Pakistan J. Zool., 53: 183. https://doi.org/10.17582/journal.pjz/20191224071237
Zhou, S., Punt, A.E., Smith, A.D., Ye, Y., Haddon, M., Dichmont, C.M., and Smith, D.C., 2018. An optimized catch-only assessment method for data poor fisheries. ICES J. Mar. Sci., 75: 964-976. https://doi.org/10.1093/icesjms/fsx226
To share on other social networks, click on any share button. What are these?


