

Stem Cell Factor Gene Overexpression Enhances the Fusion Potential of Rat Bone Marrow Mesenchymal Stem Cells with Cardiomyocytes


Stem Cell Factor Gene Overexpression Enhances the Fusion Potential of Rat Bone Marrow Mesenchymal Stem Cells with Cardiomyocytes
Kanwal Haneef1,2, Rakhshinda Habib1,3, Nadia Naeem1,3 and Asmat Salim1,*

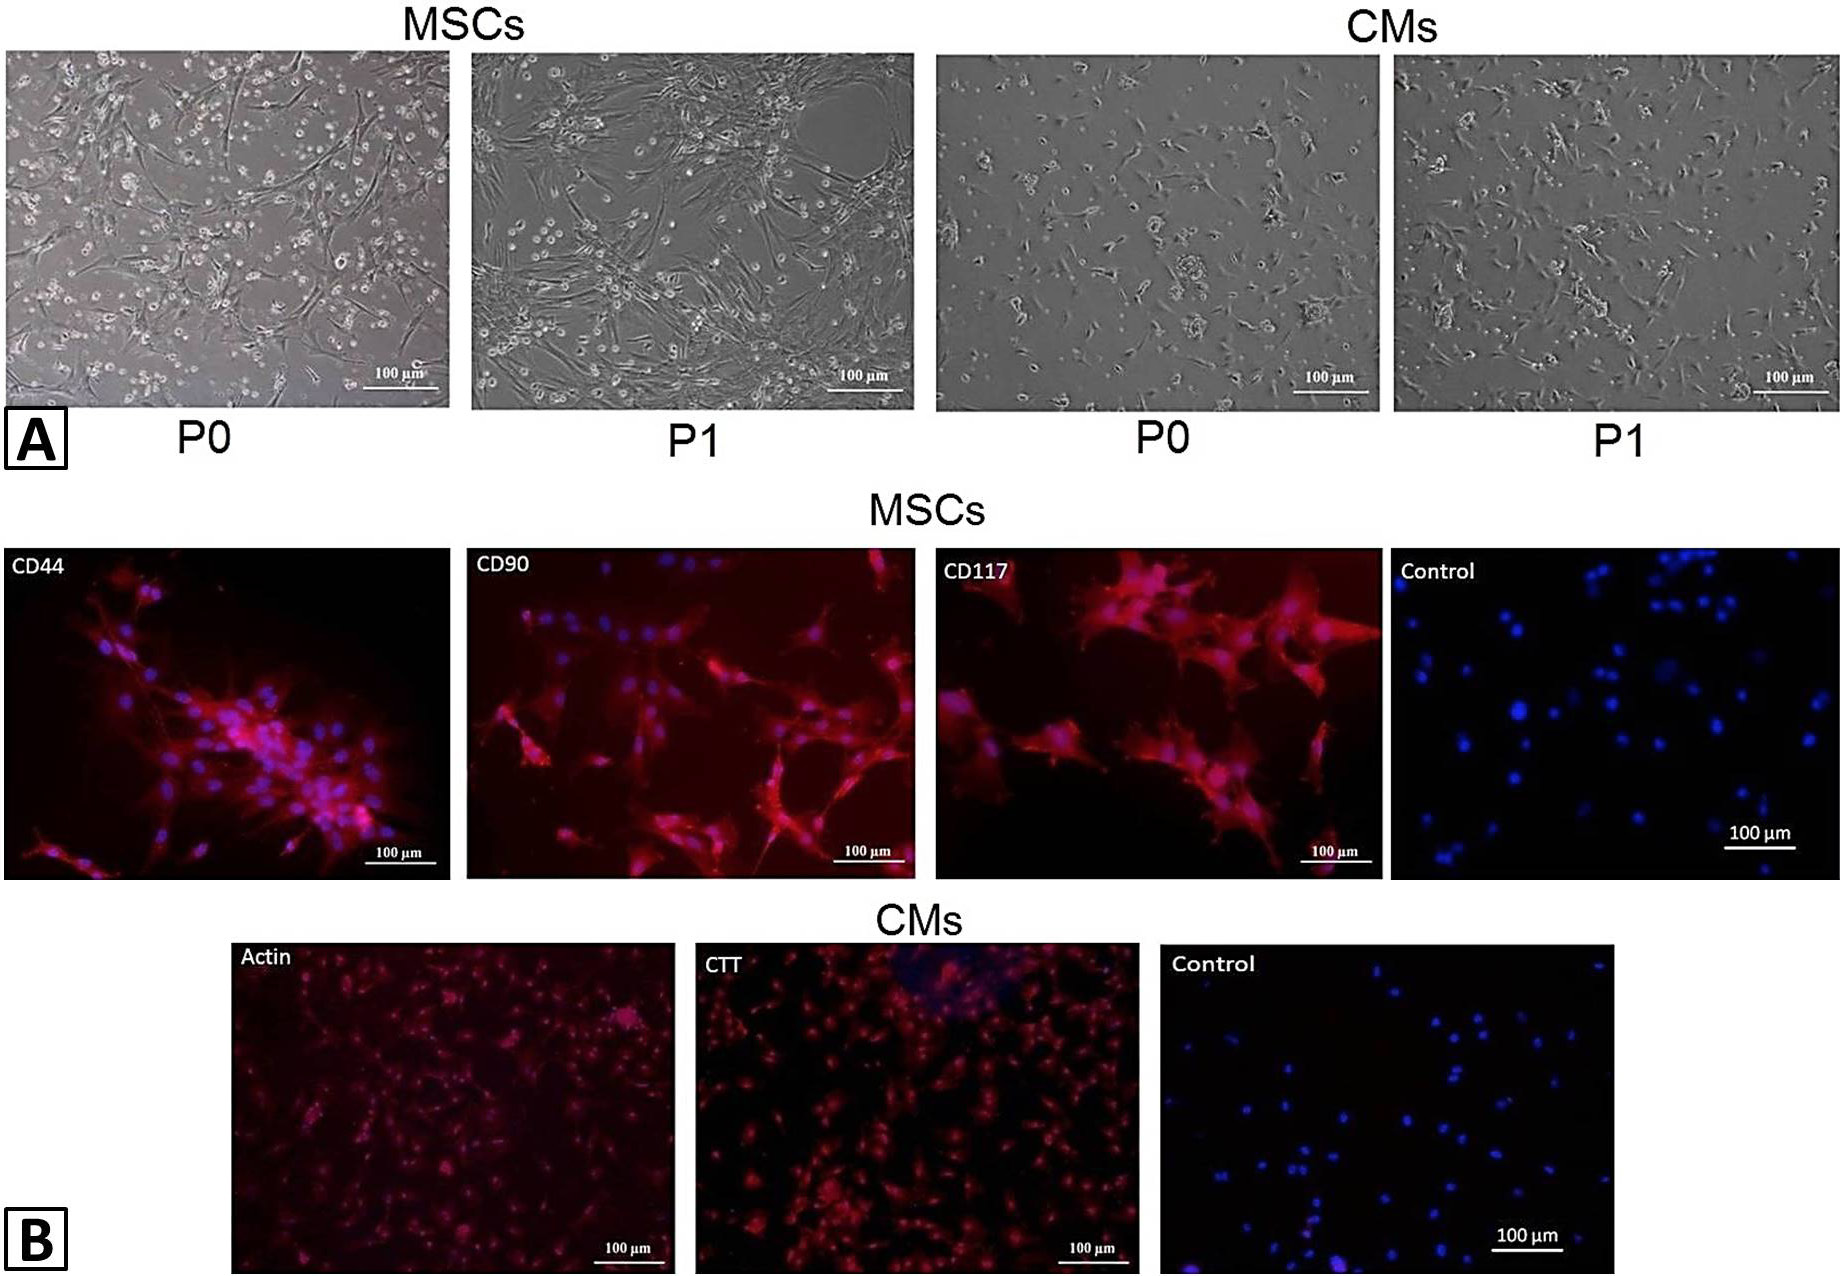
Morphology and charachterization of MSCs and CMs: (A) Morphology of rat bone marrow MSCs and rat CMs at passage 0 (P0) and passage 1. Images were taken under phase contrast at 10X magnification; (B) Characeterization of rat bone marrow MSCs and rat CMs. MSCs were treated with specific primary antibodies against CD44, CD90, and CD117. CMs were treated with specific primary antibodies against actin, and cardiac troponin T. Alexa fluor 546 secondary antibody was used for detection and DAPI was used for nuclei staining. Images were taken under fluorescence microscope.
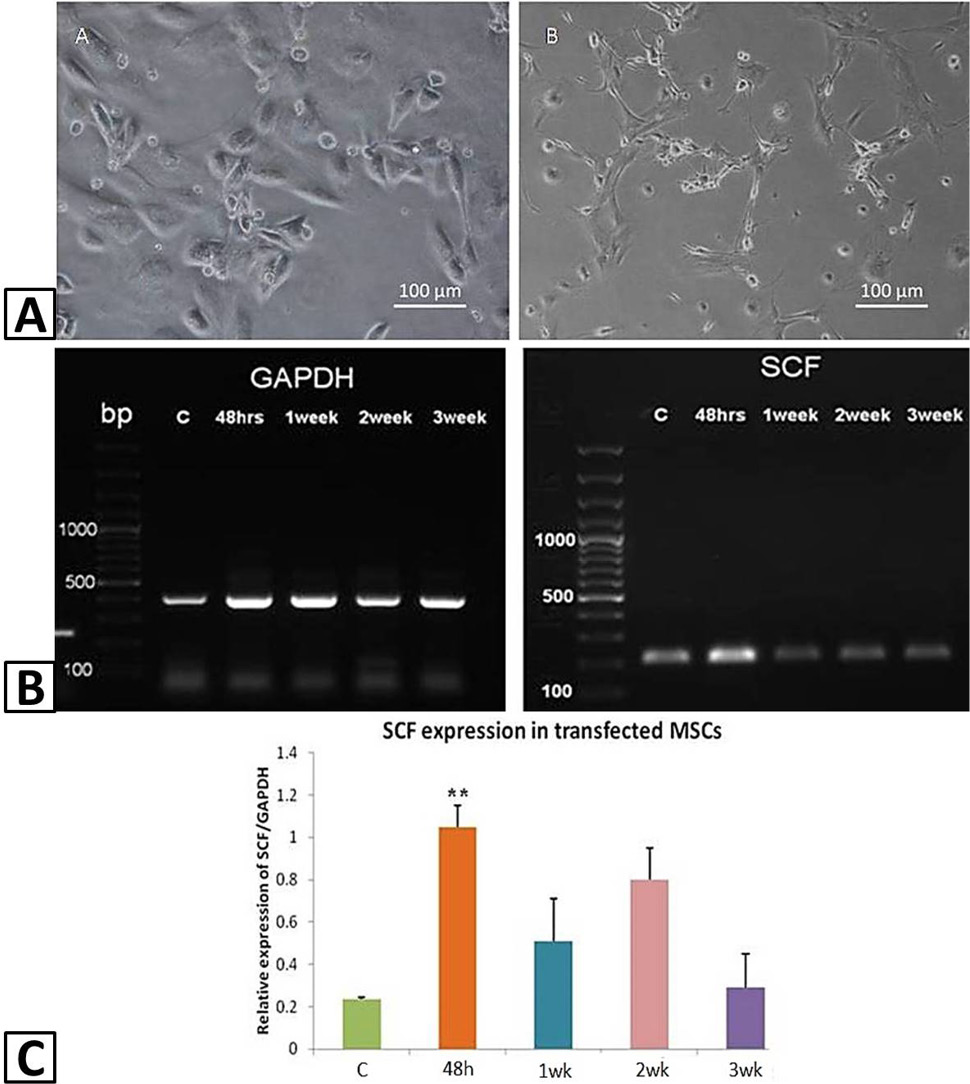
Transfection of MSCs with SCF: (A) Morphology of MSCs before and after transfection with SCF. Images were taken under phase contrast at 10X magnification; (B) Gene expression analysis of SCF transfected MSCs. RT-PCR gel showing gene expression levels of GAPDH and SCF after transfection. Lane 1: DNA marker (100 to 1500 bp); Lane 2 -5: SCF expression in normal MSCs, and SCF transfected MSCc after 48 h, 1 week, 2 weeks and 3 weeks, respectively. (C) Corresponding bar diagram with quantitative analysis of SCF expression in normal and transfected MSCs. Results are expressed as Mean ± SEM (n = 3). Differences between groups with P < 0.05 is considered statistically significant where *P < 0.05, **P < 0.01, and ***P < 0.001.

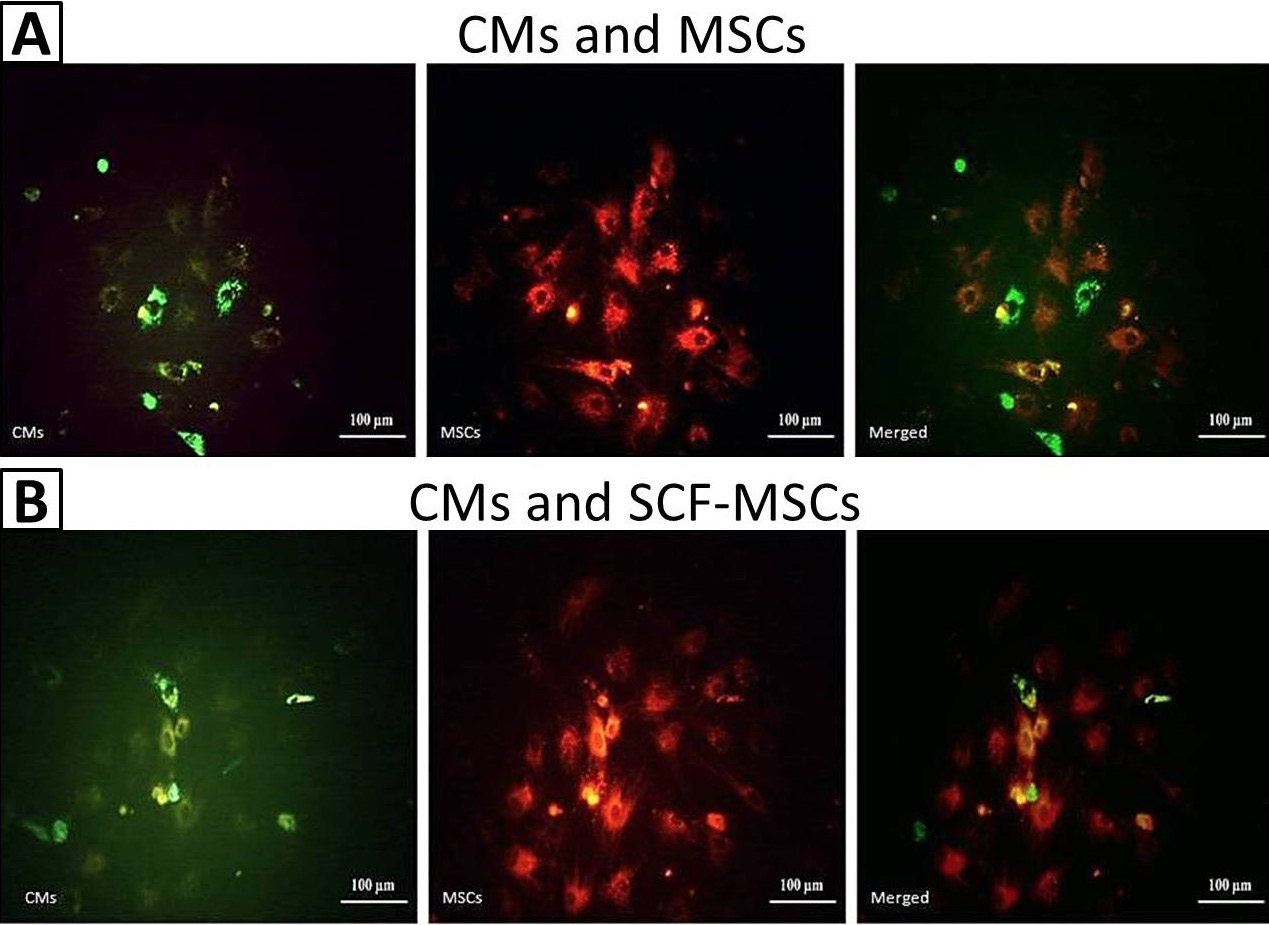
Co-culture analysis of SCF transfected MSCs with CMs thorugh microscopy: (A) Normal MSCs and normal CMs (control), and (B) SCF transfected MSCs and CMs, in co-culture. MSCs were labeled with PKH26 and CMs with PKH67. Images were taken under fluoresecnt microscope at 10X magnification.
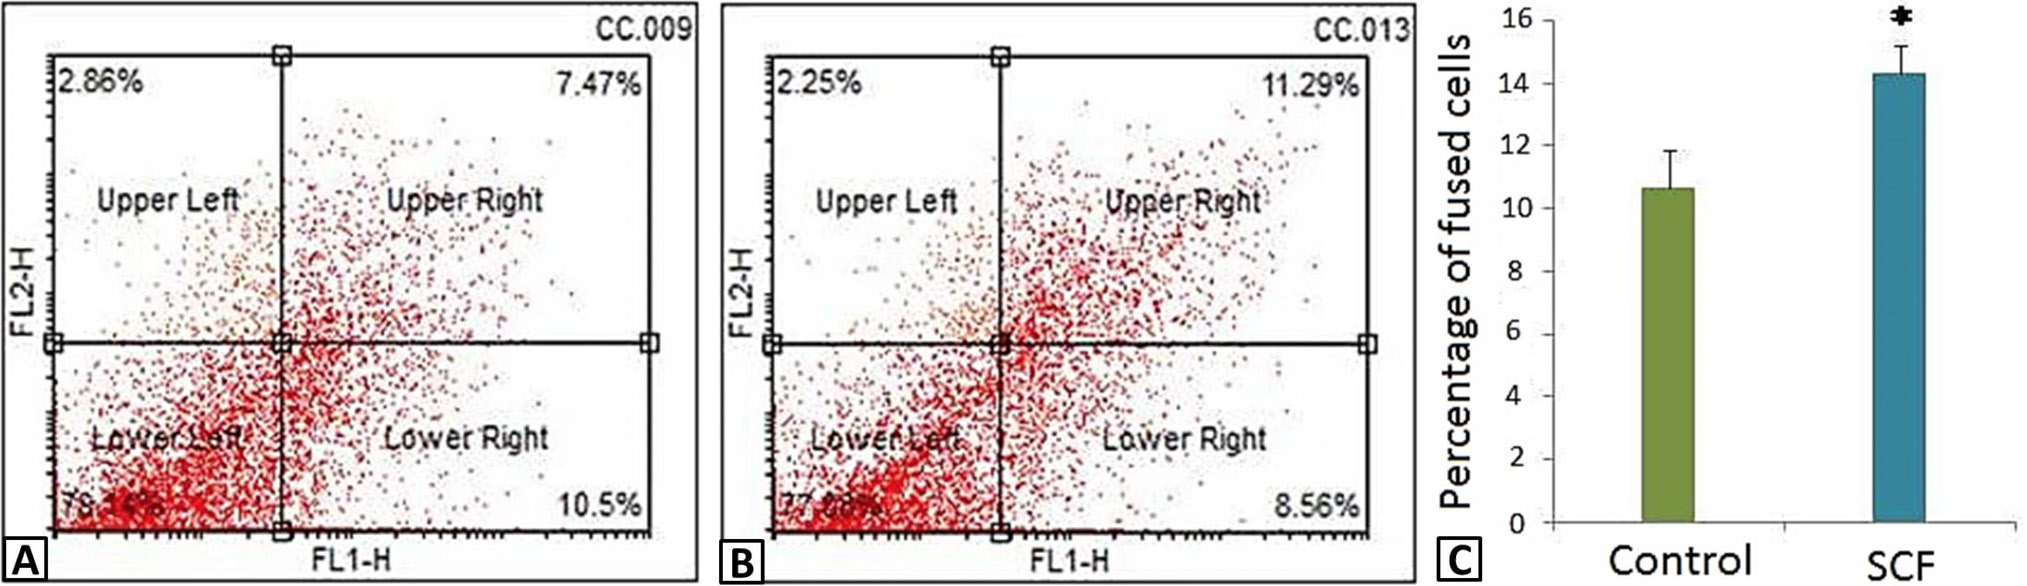
Co-culture analysis of SCF transfected MSCs with CMs thorugh flow cytometry: (A) Co-culture of normal MSCs and normal CMs (control), and (B) SCF transfected MSCs and CMs. MSCs were labeled with PKH26 and CMs with PKH67. (C) Corresponding bar diagram showing quantitative analysis of double positive cells. Results are expressed as Mean ± SEM (n = 3). Differences between groups with P < 0.05 is considered statistically significant where *P < 0.05, **P < 0.01, and ***P < 0.001.


