

Role of Salicylidene Acylhydrazide and Proteases in Biofilm Inhibition of Desulfovibrio spp.


Role of Salicylidene Acylhydrazide and Proteases in Biofilm Inhibition of Desulfovibrio spp.
Iram Liaqat1,*, Nazish Mazhar Ali2, Najma Arshad3, Riffat Iqbal1 and Zain-ul-Abideen1
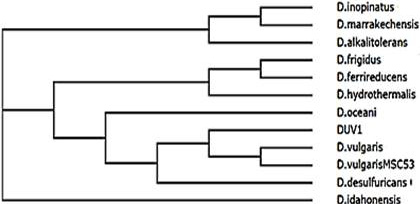
Dendrogram of Desulfovibrio spp. constructed using Clustal Omega showing homology with Desulfovibrio spp. MSC53.
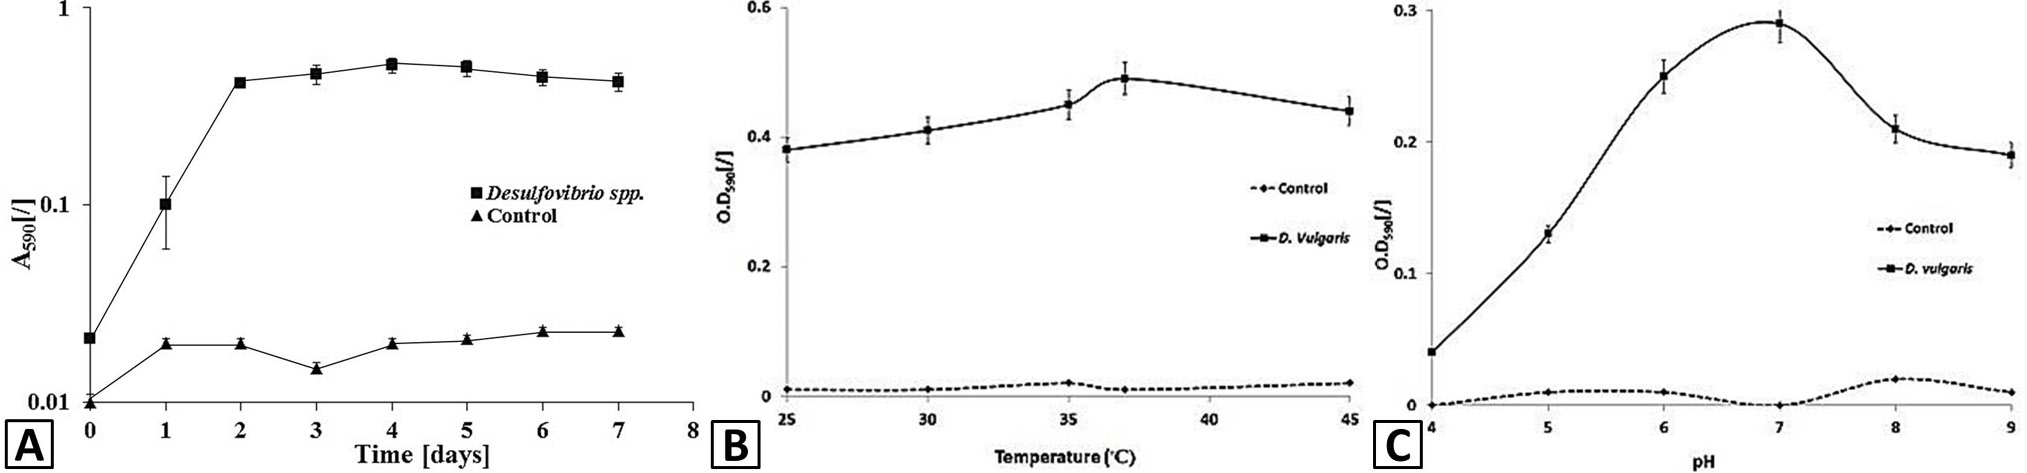
Growth curves of Desulfovibrio spp. A, Desulfovibrio spp. was grown in lactate sulfate broth for 7 days at pH 7, incubated at 37oC. O.D was determined at 590 nm. Maximum growth was observed after 3 days. B, Effect of temperature: Desulfovibrio spp. was grown in lactate sulfate broth for 72 h at different temperatures (25-45oC). O.D was determined at 590 nm. Highest growth was observed at 37oC. C, Effect of pH: Desulfovibrio spp. was grown in lactate sulfate broth for 72 hours at different pH, incubated at 37oC. O.D was determined at 590 nm. Maximum growth was observed at pH 7. Error bars in figures represent standard deviation (n=3).
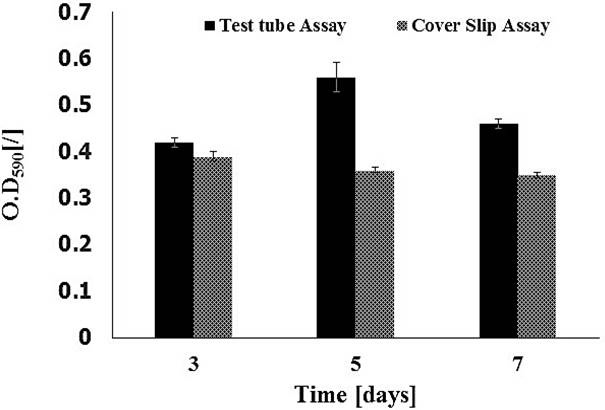
Comparison of biofilm formation by Desulfovibrio spp. using test tube and cover slip assay using 2-way ANOVA analysis. Desulfovibrio spp. was grown in lactate sulfate media for 72 h at 37°C and pH 7. OD was measured at 590 nm. Test tube assay showed significantly strong biofilm formation after 5 days compared to coverslip assay (p˂0.001). Error bars represent standard deviation (n=3) and * is significantly different.
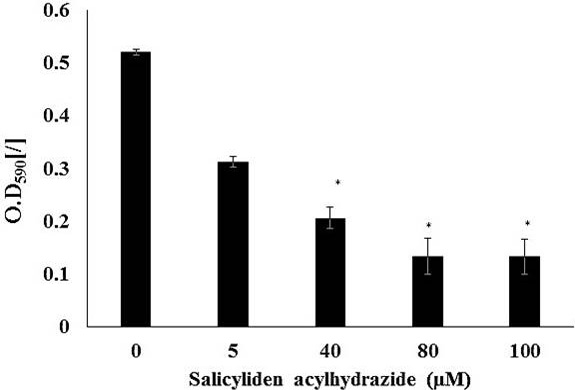
Effect of salicyliden acylhydrazide on Desulfovibrio spp. biofilm formation. Desulfovibrio spp. was grown in lactate sulfate medium for 72 h at 37°C and pH 7. Various concentrations (5, 40, 80 and 100 µM) of salicylidene acylhydrazide were added. OD was measured at 590nm. Significant reduction in biofilm formation was observed at 40, 80 and 100 µM (p˂0.001). Error bars represent standard deviation (n=3) and * = significantly different.
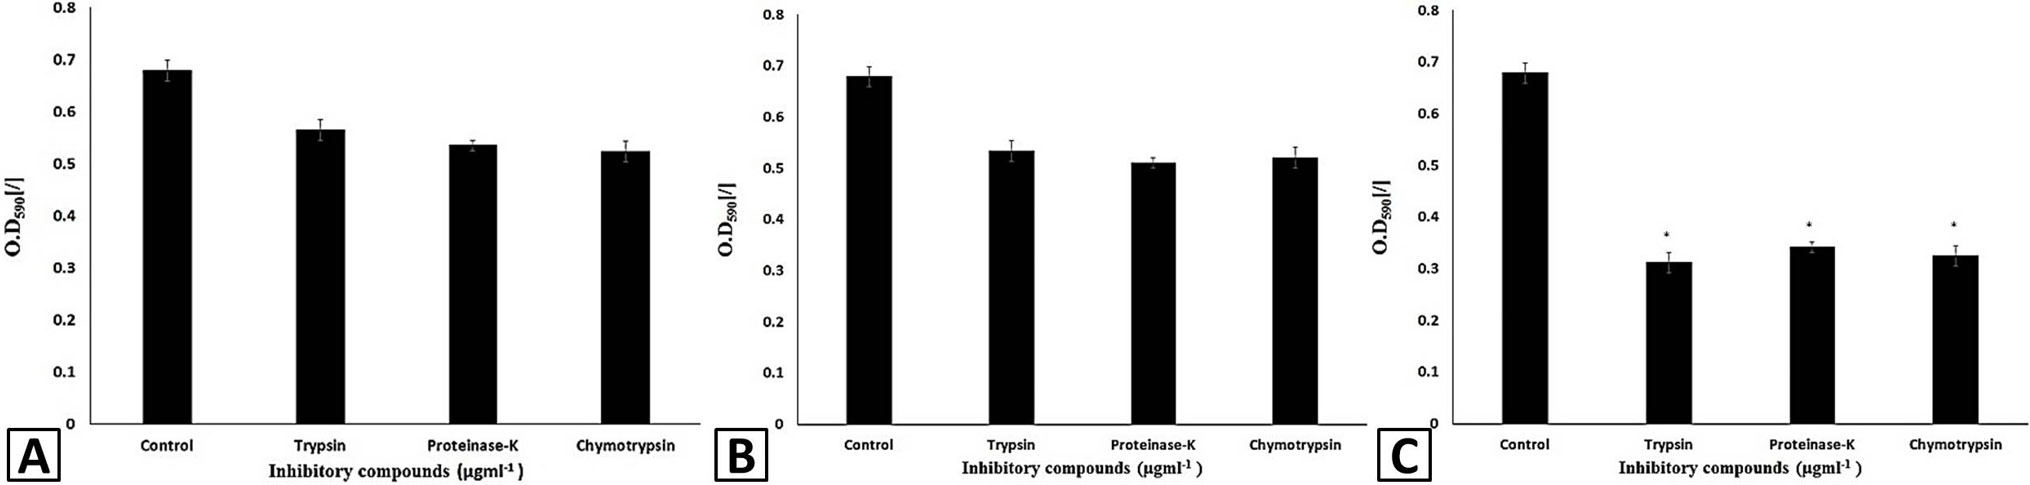
Effect of 5µM concentration (A), 10µM concentration (B) and 15µM concentration (C) of trypsin, proteinase K and chymotrypsin on Desulfovibrio spp. biofilm formation. Desulfovibrio spp. was grown in lactate sulfate medium at 37°C and pH 7 for 72 h. OD was measured at 590 nm in A and B. Significant reduction in biofilm formation was observed in C using all compounds (p˂0.01). Error bars represent standard deviation (n=3) and * is significantly different.


