

Potential Recruiting and Hepatoprotective Effects of Ellagic Acid in D-Galactosamine-Induced Liver Damage in Rats


Potential Recruiting and Hepatoprotective Effects of Ellagic Acid in D-Galactosamine-Induced Liver Damage in Rats
Mustafa Cengiz1*, Jama Hussein Ali2, H. Mehtap Kutlu2, Djanan Vejselova2 and Adnan Ayhanci3

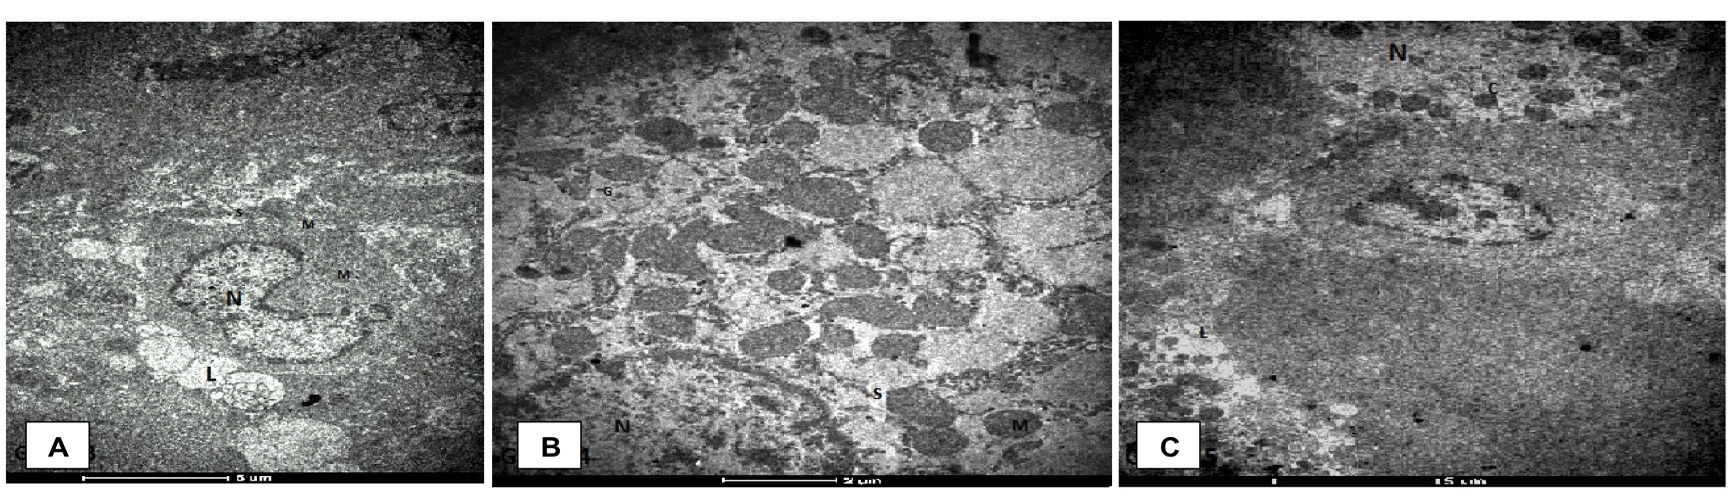
Transmission electron micrographs showing morphological changes in rat liver cells. A, Group 3-GalN treated tissue showing the nucleus (N) compressed by large lipid droplets (L). The cytoplasm shows fewer rER and glycogen rosettes in-between high electron-dense mitochondria (m) and dilated sER (S) (4200x); B, Group 4-Tissues EA administered before GalN treatment with showing less lipid droplets (L), less electrondensity of mitochondria (m), less dilated sER (S) and condensed glycogen rosettes (G) compared to group 3 (8200x); C, Group 5- GalN before EA administered liver tissue with showing fewer lipid droplets (L) and ring shaped chromatin condensation © compared to D-galactosamine group (4200x).

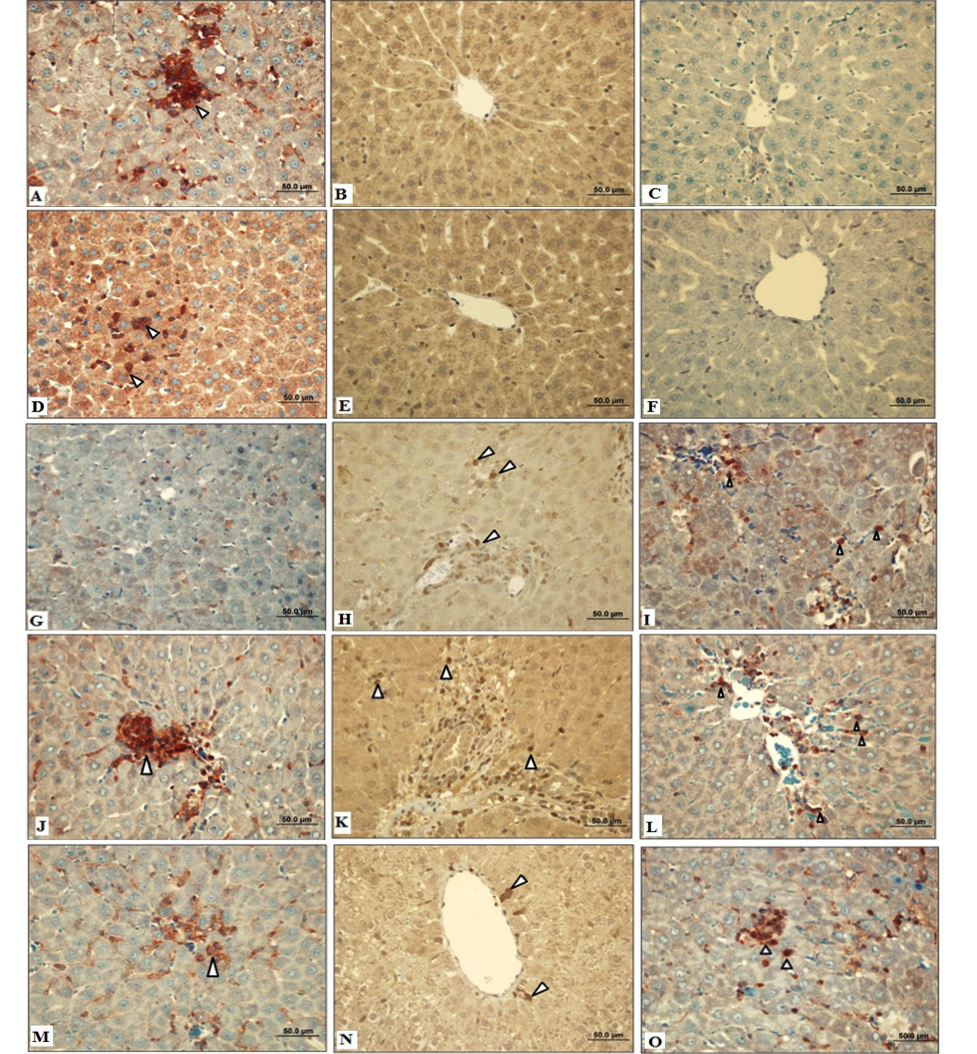
Immunohistochemically-stained liver specimens of the rats in different study groups. Activated caspase-3 and Bax in control group and 0.2 % DMSO-treated showing almost negligible staining normal hepatocytes (B, C, E and F) while Bcl-2 protein expression in control group showing less intense staining normal hepatocyte as shown by arrows (A and D). Caspase-3 and Bax protein expression in D-GaIN-treated group showing more intense staining of hepatocytes and diffused staining as shown by the arrows (H and I) while Activated Bcl-2 in D-GaIN-treated group showing almost negligible staining normal hepatocytes as shown (G). Activated Caspase-3 and Bax immunostaining of liver treated with EA before D-GaIN and D-GaIN before EA showing less intense staining of hepatocytes as shown by arrows (K, L, N and O) while Bcl-2 protein expression in EA before D-GaIN and D-GaIN before EA groups showing less intense staining of hepatocytes as shown by arrow (J and M) (bar: 50µm).
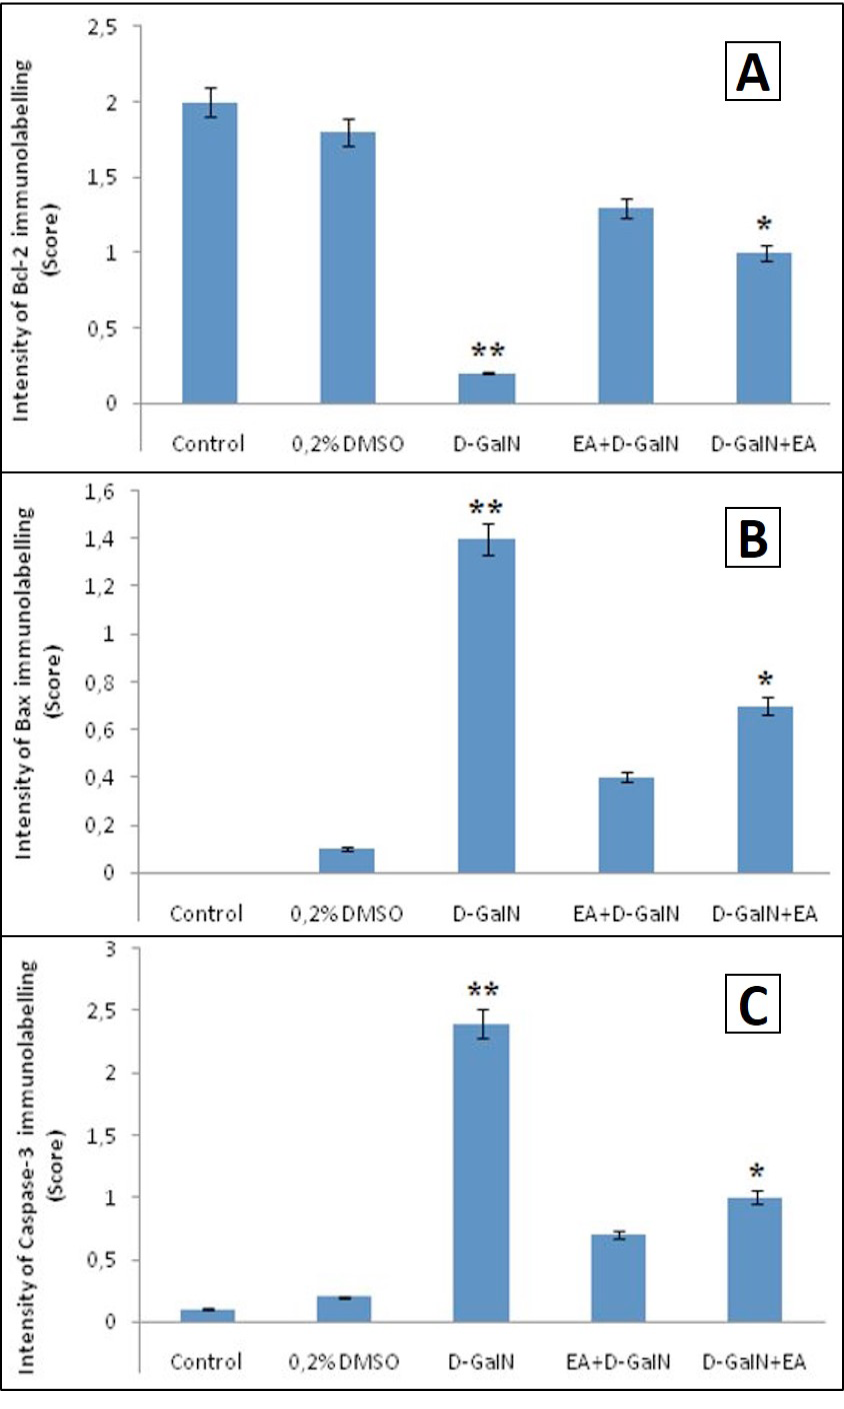
Intensity of immunolabelling score of activated Bcl-2 (A), caspase-3 (B) and Bax (C) positive hepatocytes in the groups. **p<0.001 and *p<0.05compared to control (group 1) and 0.2% DMSO groups (group 2).


