
Optimizations of Modified Machine Learning Algorithms Using K-Fold Cross Validations for Wheat Productivity: A Hyper Parametric Approach


Research Article
Optimizations of Modified Machine Learning Algorithms Using K-Fold Cross Validations for Wheat Productivity: A Hyper Parametric Approach
Farrukh Shehzad1, Muhammad Islam1,2*, Muhammad Omar3, Syed Ijaz Hussain Shah4, Rizwan Ahmed5 and Naeem Sohail6
1Department of Statistics, The Islamia University of Bahawalpur, Pakistan; 2Crop Reporting Service, Agriculture Department Bahawalpur, Punjab, Pakistan; 3Department of Computer Science, The Islamia University of Bahawalpur, Pakistan; 4Crop Reporting Service, Agriculture Department M.B Din, Punjab, Pakistan; 5Crop Reporting Service, Agriculture Department Khanewal, Punjab, Pakistan; 6Crop Reporting Service, Agriculture Department Gujrat, Punjab, Pakistan
Abstract | An optimized wheat crop productivity model can play a crucial role for evolving effective agricultural policy decisions for food concerns and trepidation. This study measures the efficacies of modified machine learning algorithms using multiple linear regression (MLR), decision tree regression (DTR) and random forest regression (RFR) for wheat productivity using 75% and 25% randomized partitions. The 26,430 field of wheat crop cut experiments (C.C.E) is taken from crop reporting service (CRS), Punjab for the years 2016-17 to 2019-2020. Three generated datasets (D2, D3 and D4) were used to optimize the model performance. The heat plot map shows very strong significance of correlation matrix for D3 and D4, while it was low for D1 and D2. The modified RFR produced lowest values of error for all the datasets, comparing with benchmark DTR and MLR (ErrorMLR > ErrorDTR > ErrorRFR). The modified RFR found best fitted model for the prediction of wheat productivity. The hyper parametric tuning K-Fold cross validation is applied to get the most optimized sub fold for the modified models. It is demonstrated that modified RFR provides superior performance as we advanced from D1 to D4. The results got best when it used D4 for random forest regression with the K Fold-6.
Received | September 14, 2022; Accepted | November 06, 2022; Published | December 14, 2022
*Correspondence | Muhammad Islam, Crop Reporting Service, Agriculture Department Bahawalpur, Punjab, Pakistan; Email: mislam6667@gmail.com
Citation | Shehzad, F., M. Islam, M. Omar, S.I.H. Shah, R. Ahmed and N. Sohail. 2022. Optimizations of modified machine learning algorithms using K-fold cross validations for wheat productivity: A hyper parametric approach. Sarhad Journal of Agriculture, 38(5): 271-278.
DOI | https://dx.doi.org/10.17582/journal.sja/2022/38.5.271.278
Keywords | Modified machine learning model optimizations, Hyper parametric K-fold cross validation, Wheat productivity
Copyright: 2022 by the authors. Licensee ResearchersLinks Ltd, England, UK.
This article is an open access article distributed under the terms and conditions of the Creative Commons Attribution (CC BY) license (https://creativecommons.org/licenses/by/4.0/).
Introduction
Data science has been emerged as a well-defined multi-disciplinary field that comprises of statistics, computer science and machine learning methodologies enabled to learn optimized information can be inferred inside from the data (Hui et al., 2019; Igual and Segui, 2017). Data science deals with the massive amount of data by adding the methods from computer science to the repertoire of statistics (Cielen et al., 2016). Similarly, Nelli (2015) defined machine learning algorithms as a most advanced mechanized procedures and tools of data science, which identified the true data patterns, trends, clusters and extract most apposite facts from data. The advancement in science and technologies leads to implementations of immense volume of agronomical constrains in various agricultural fields (Elavarasan and Vincent, 2021a, b). The optimization of machine learning algorithms has become a significant part for model deployment and got abundant attention of researchers being a core components of optimized machine learning algorithms for the massive amount of data (Sun et al., 2019). Machine learning (ML) algorithms has been categories as an advanced tool, being used for the prediction of agriculture production (Alagurajan and Vijayakumaran, 2020; Gonzalez Sanchez et al., 2014; Yadav et al., 2020). An optimized crop model is foremost need of the time is to handle the food trepidations (Elavarasan and Vincent, 2021a; Jeong et al., 2016). Machine learning have the ability to learn and to develop its own programs, based on automated and improved experience learning process, and it is done with minimum human intervention with no explicit programming. Dangeti (2017) defined machine learning as a branch of data science, in which a model can learn automatically from the experiences based on data without exclusively being model like in statistical models. Over a period with more data, the model predictions will become more accurate. Sarkar et al. (2018) differentiated the typical workflow for traditional programming, paradigms and machine learning algorithms in Figure 1. In traditional programming paradigms, the programmer involves to input data instructions to computer to perform output for desired results while in machine learning paradigm both data and projected outputs is used to build the program (model) and then machine learning model used to make prediction from unseen dataset.
Figure 2 portrayed the comprehensive flowchart for the deployment of supervised machine learning algorithms using different approaches of hyper parametric models tunings (Islam, 2022).
Its exigent need of the time is to develop an optimized model capable to predict the wheat productivity on the reliable statistics which would help us to attain the non-assurance and assurance of future food demand (Sharma et al., 2015). Islam and Shehzad (2022) presented the study on the large datasets for building the machine learning and statistical models for the wheat productivity in Pakistan based on cross-sectional record.
This study extended this research and presented the most optimized machine learning algorithms using K-Fold cross validations, a hyper parametric tuning approach for machine learning (ML) algorithms i.e. multiple linear regression model (MLR), decision tree regression (DTR) and random forest regression (RFR) capable to predict the wheat productivity well.
Materials and Methods
Study area and data collection
This study conducted in Punjab, which is 2nd largest province of Pakistan accounted 76% share in total wheat cultivated area (Islam, 2022). The administrative setup of Punjab comprises upon 09 divisions, 36 districts and 145 tehsils. The 26,430 fields of wheat crop cut experiments (C.C.E) is taken from crop reporting service (CRS), Punjab for the year 2016-17 to 2019-2020. Table 1 elaborated the variables used to get the most optimized models, able to predict the wheat productivity well.
Table 1: Identifications of features.
|
S. No. |
Agronomical quantitative features |
S. No. |
Binary categorical agronomical features |
|
1 |
Fertilizer urea (kg/acre) |
8 |
Seed treatment (no or yes) |
|
2 |
Fertilizer DAP (kg/acre) |
9 |
Soil type chikny loom (no or yes) |
|
3 |
Other fertilizers (kg/acre) |
10 |
Advanced varieties (no or yes) |
|
4 |
No. of water/irrigations |
11 |
Harvesting April, 1-20 (no or yes) |
|
5 |
Seed quantity used (kg/acre) |
12 |
Planting November (no or yes) |
|
6 |
No. of pest sprayoperations |
13 |
Land irrigated (no or yes) |
|
7 |
No. of weeds spray operations |
14 |
Farmers area >25 acres (no or yes) |
|
15 |
Seed type (un-certified or certified) |
The experiment is performed using Scikit Learn (Sklean), a Python’s key library. Islam and Shehzad (2022), Islam et al. (2021) described the centroid clustering scheme and introduced the following new generated datasets (Table 2) with the aims to get the most optimized set of features for models, based on centralization of dataset at village, tehsils and district level datasets.
Table 2: Preparation (preprocessing) of datasets.
|
Datasets |
D2(village centroid) |
D3 (tehsil centroid) |
D4 (district centroid) |
|
Sample points |
6034 |
145 |
36 |
Table 3: Datasets partition into train and test datasets.
|
Datasets sample points |
D1 |
D2 |
D3 |
D4 |
|
Train datasets |
19822 |
4525 |
108 |
27 |
|
Test datasets |
6608 |
1509 |
37 |
09 |
Data partition
The train test split, a function of Scikit Learn (Sklean) library is applied for splitting the datasets into random partitions called train and test datasets. The train set is applied to learn and test set is applied to validate the model performance for unseen records. The randomizations train test split is carried out using the 75% dataset as to train the models and 25 % dataset as to validate the models. Table 3 distinguished the dataset into train and test partitions.
Modified supervised machine learning algorithms
Modified supervised machine learning algorithms i.e multiple linear regression (MLR), decision tree regression (DTR) and random forest regression (RFR) are applied to liaison the relation between features and response variable (wheat productivity) for all the datasets to endeavor the relationship and to optimize the models performance.
Hyper parametric tuning using k-fold cross-validations
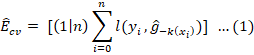
Cross validation hyper parametric tuning is a techniques applied to evaluate the performance skill of the model on new datasets. It is also called re-sampling procedure, out of sample testing or rotation estimations of ML model performance used to assess the application of statistical analysis will be generalize to an independent data set (Burman, 1989). The ML model is generally partitions in train and test datasets against which the performance of ML model is evaluated for prediction of unseen dataset. A run of cross-validation takes the partitioning of data set into complementary subsets of train test split. The statistical analysis is performed for train subset and its validating is evaluated for the test subset. According to Berrar (2019), in cross-validation various rounds of data partitions into train test split are performed and the ML model validation results are averaged over the all rounds of cross-validations to assess the predictive performance of ML model. Over-fitting is a situation accrues when ML model have good accuracy for train data but poor accuracy for test data sets (Cawley and Talbot, 2010; Fushiki, 2011). A good machine learning model is that which gain good accuracy for train datasets as well as for test datasets to avoid over-fitting. The K-fold cross validation is a method which generate the results on which we assessed that the performance of ML Model is not depend only on the one fold of train and test split. The available learning dataset is fold in k disjoint subsets equal size and the ML model is trained for k-1 subsets called train datasets, while other remaining subsets called validation set or test datasets, and the average performance is measured for different fold of train test split (Jung, 2018). The 10 fold is commonly applied in k fold cross-validation and Figure 3, elaborate the flowchart mechanisms of kth fold cross validation hyper parametric model tuning criterion to get the optimized models. Let ĝ-k be the ML model trained kth subset of the learning set and ŷi = ĝ-k(xi) be the predicted value of the real class of yi on xi in the kth subset then K-fold cross validated error estimate Êcv is measured as.
Singh et al. (2017) applied K-Fold cross validation to predict the rice yield using machine learning approach and they found that it optimized the model performance. Similarly, Peng et al. (2017) used the K-Fold cross validations to predict the rice crop yield using machine learning approach and they reported it was performed best to evaluate the rice yield. Ghorbanzadeh et al. (2020) used K-Fold cross validation techniques to determine the gully erosion susceptibility mapping (GESM) and found it was best for optimization of model performance. Similarly, Peng et al. (2017) used the K-Fold cross validations to predict the rice crop yield using machine learning approach and they reported it was performed best to evaluate the rice yield. Haque et al. (2020) applied machine learning algorithms for crop yield analysis using K-Fold cross validations and they reported it performed well.
Heat plot map
The heat plot map (heat map) is graphical visualization of datasets used to represent the individual values of the correlation matrix in colors scheme (Babicki et al., 2016; Wilkinson and Friendly, 2009). Heat maps make it easy to visualize the complex datasets concentration between two dimensions of a matrix. In heat plot map graphical presentation is divided into color coded rectangles or squares according to its correlation matrix values of the specific cell. In the current study the heat plot map is applied to explore the optimized datasets and to investigate the significance of correlation matrix for the response (wheat productivity) and features.
Evaluation metrics approach
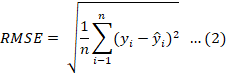
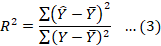
The popular evaluations metrics (EM) using the performance score (R2) and error (RMSE) are applied to measures the machine learning models performances for both the train and test models. Lower value of error and higher the performance score support the good fit.
Data analysis
Heat plot map for different datasets: Figures 4 to 7 shows the heat plot map for the variable of interest (wheat productivity) along with all features of interest to depict the importance of features in colure display matrix for D1 to D4. The correlation matrix has become strong and strongest as we advanced from D1 to D4. The significance of correlation matrix predictability of relation for the response and features are very strong for D3 and D4, while it’s low for D1 and D2. The interpretability of wheat productivity models have become strong and strongest as we advanced from of features based on D1 to features based on D4.
Modified machine learning models
Table 4, shows the performance score and error for the machine learning algorithms i.e. MLR, DTR and RFR. For the D1, the R2 found as 0.266, 0.364 and 0.380 for train models and 0.264, 0.323 and 0.345 for test models, respectively for MLR, DTR and RFR. The RMSE found as 9.14 and 9.21 for MLR, 8.51 and 8.82 for DTR, 8.40 and 8.68 for RFR, respectively for train and test models. For the D2, The RMSE found 7.65 and 8.09 for MLR, 7.22 and 7.82 for DTR, 7.09 and 7.64 for RFR, respectively for train and test models. The R2 found as 0.289 and 0.285 for MLR, 0.366 and 0.331 for DTR, 0.388 and 0.362 for RFR, respectively for train and test models. For D3, the R2 found as 0.838 and 0.834 for MLR, 0.940 and 0.731 for DTR, 0.948 and 0.786 for RFR and the RMSE reported as 3.15 and 3.34 for MLR, 1.92 and 4.26 for DTR, 1.78 and 3.79 for RFR, respectively for train and test models. For the D4 the R2 found as 0.932 and 0.655 for MLR, 0.987 and 0.741 for DTR, 0.973 and 0.877 for RFR, respectively for train and test models. The RMSE reported as 1.95 and 3.31 for MLR, 0.828 and 2.87 for DTR, 1.23 and 1.97 for RFR, respectively for train and test models. These statistics portrayed that RFR performed good for D1 to D3 as it contains good R2 with lowest error both for train and test models. For the D4 train models, RFR perfumed good R2 for train and test models. The error for DTR train models is lowest in D4 but for test models the RFR supersede the DTR to avoid over fit model. These results depict that on the whole RFR super performed than MLR and DTR for all the datasets.
K-Fold cross-validations hyper parametric tuning for modified MLM models
The K-Fold cross-validation hyper-parametric tuning applied for the modified MLR, DTR and RFR in Table 5. For the D1, the smallest values of error found for K-Fold-8 as 8.92, 8.62 and 8.45, while the largest found for K-Fold-10 as 9.27, 8.90 and 8.72, respectively for MLR, DTR and RFR. For the D2, the smallest values of error reported for K-Fold-2 as 7.50, 7.33 and 6.96, while the largest found for K-fold-10 as 8.08, 8.00 and 7.75, respectively for MLR, DTR and RFR. For the D3, the smallest values of error found
Table 4: Integrating machine learning algorithms.
|
MLR (R2) |
DTR (R2) |
RFR (R2) |
MLR (RMSE) |
DTR (RMSE) |
RFR (RMSE) |
|
|
D1 |
0.266 (0.264) |
0.364 (0.323) |
0.380 (0.345) |
9.14 (9.21) |
8.51 (8.82) |
8.40 (8.68) |
|
D2 |
0.289 (0.285) |
0.366 (0.331) |
0.388 (0.362) |
7.65 (8.09) |
7.22 (7.82) |
7.09 (7.64) |
|
D3 |
0.838 (0.834) |
0.940 (0.731) |
0.948 (0.786) |
3.15 (3.34) |
1.92 (4.26) |
1.78 (3.79) |
|
D4 |
0.932 (0.655) |
0.987 (0.741) |
0.973 (0.877) |
1.95 (3.31) |
0.828 (2.87) |
1.23 (1.97) |
Testing datasets values shows in parenthesis.
Table 5: K-Fold Cross-validation study of error for modified MLR, DTR and RFR models.
|
MLRA |
Models |
K- fold division |
K-fold 1 |
K-fold 2 |
K-fold 3 |
K-fold 4 |
K-fold 5 |
K fold 6 |
K fold 7 |
K-fold 8 |
K-fold 9 |
K-fold 10 |
|
Dataset-1 |
MLR |
9.16 |
9.21 |
9.16 |
9.05 |
9.23 |
9.21 |
9.21 |
9.15 |
8.92 |
9.24 |
9.27 |
|
Data set-2 |
7.78 |
7.74 |
7.50 |
8.080 |
7.57 |
7.87 |
7.91 |
7.55 |
7.59 |
7.91 |
8.08 |
|
|
Data set-3 |
3.58 |
3.00 |
3.65 |
4.41 |
4.47 |
3.45 |
3.38 |
2.05 |
3.50 |
3.09 |
4.11 |
|
|
Data set-4 |
4.11 |
4.56 |
3.38 |
2.66 |
2.93 |
4.84 |
2.64 |
5.50 |
2.52 |
5.51 |
4.84 |
|
|
Dataset-1 |
DTR |
8.81 |
8.88 |
8.77 |
8.74 |
8.83 |
8.81 |
8.80 |
8.84 |
8.62 |
8.87 |
8.90 |
|
Data set-2 |
7.59 |
7.50 |
7.33 |
7.73 |
7.38 |
7.46 |
7.85 |
7.65 |
7.46 |
7.50 |
8.0 |
|
|
Data set-3 |
3.29 |
3.75 |
2.46 |
3.91 |
3.04 |
3.98 |
3.64 |
2.04 |
2.33 |
3.03 |
4.24 |
|
|
Data set-4 |
3.99 |
2.42 |
1.85 |
1.2 |
4.57 |
1.83 |
3.99 |
6.29 |
4.61 |
3.86 |
6.37 |
|
|
Dataset-1 |
RFR |
8.64 |
8.71 |
8.60 |
8.52 |
8.72 |
8.67 |
8.63 |
8.65 |
8.45 |
8.72 |
8.72 |
|
Data set-2 |
7.38 |
7.33 |
6.96 |
7.50 |
7.23 |
7.29 |
7.68 |
7.24 |
7.28 |
7.40 |
7.75 |
|
|
Data set-3 |
2.92 |
2.04 |
3.09 |
3.09 |
3.36 |
2.60 |
3.24 |
1.63 |
2.60 |
2.84 |
4.23 |
|
|
Data set-4 |
3.44 |
3.57 |
2.22 |
1.09 |
2.37 |
2.61 |
0.80 |
5.10 |
4.53 |
3.89 |
3.77 |
for K-Fold-7 as 2.05, 2.04 and 1.63, while the largest found as 4.47 against MLR for K-Fold-4 and 4.24, 4.23 against DTR and RFR against K- Fold-10. For the D4, the smallest values of error found as 2.52 against MLR for K-Fold-8, 1.20 against DTR for K-Fold-3 and 0.80 against RFR for K-Fold-6, while the largest values found as 6.37, 5.51 and 5.10 against DTR, MLR and RFR, respectively for K-Fold-10, K-Fold-9 and K-Fold-7. Comparing the lower values of RMSE for all the models, it is cleared by Figure 8, that all error values found low for modified RFR, comparing with benchmark modified DTR and MLR for all the datasets (ErrorMLR > ErrorDTR > ErrorRFR).
Results and Discussions
The optimization of machine learning algorithms has got the prominent place in hierarchy of model deployments. Heat plot map are applied to study the significance of correlation matrix for the response and features for different datasets. The significance of correlation matrix found very strong for D3 and D4, while it’s low for D1 and D2. The predictively of models have become strong and strongest as we advanced from D1 to D4. Different modified machine learning models i.e. MLR, DTR and RFR are applied on different datasets and the results portrayed that RFR produced good R2 with lowest error both for train and test models. The RFR super performed for D4. The K-Fold cross-validations, a hyper parametric tuning are applied for modified MLR, DTR and RFR to optimize the models performance. The modified RFR is best model for the prediction of wheat productivity based on cross-sectional datasets using the centralization of datasets. It is also clarified that error getting low and lowest respectively from D1 have 26430 sample point to D2 have 6034 sample point, D3 have 145 sample point and D4 have only 36 sample point, which shows that data preparation using centroid clustering improved the prediction capability of the all the supervised machine learning models. The results got best when we used D4 for RFR with the K fold-6 even though this dataset has only 36 records/rows/samples.
Conclusions and Recommendations
This study measures the efficacies of modified machine learning algorithms using multiple linear regression, decision tree regression and random forest regression models for wheat productivity. The original dataset of 26430 (D1) crop cut experiment along with fifteen features is collected from the crop reporting service. Three more generated datasets are used to optimize the model performance. The 75% data used to train the models and 25% used to test the models. The heat plot map shows very strong significance of correlation matrix for the response and features for D3 and D4, while it’s low for D1 and D2. The RFR successfully predicted the wheat productivity followed by DTR and MLR, respectively for D1, D2, D3 and D4, and D4 optimized the model performances. The hyper parametric K-Fold cross validation is applied to optimized the models performance for MLR, DTR and RFR with the aims to get the most optimized model. The results got best when we used D4 for RFR with the K fold-6. It is demonstrated that modified RFR provides superior performance as we advanced from D1 to D4. The advancement in science and technologies leads to implementations of immense volume data in various agricultural fields. The optimization of machine learning algorithms has got significant intentions of the researchers as true prediction model to handle the food security threat around the world.
Acknowledgements
All the authors are thankful and acknowledged strong data collection mechanisms and efforts of the team of Crop Reporting Service, Agriculture Department, Punjab, Pakistan being a good asset for us and for our sweet homeland.
Novelty Statement
This study designed the layout of optimized models for some modified machine learning algorithms using the hyper parametric K- fold cross validation tuning with the centralization of datasets for wheat yield prediction to evoke or to handle the food trepidations.
Author’s Contribution
Farrukh Shehzad: Supervision, preparations, data analysis and descriptions.
Muhammad Islam: Descriptions, data preparations, methodologies, data analysis, results, discussions, conclusions and recommendations.
Muhammad Omar: Software analysis machine learning methodologies.
Syed Ijaz Hussain Shah: Statistical data analysis, data handling, descriptions.
Rizwan Ahmed: Description, manuscripts text reading, data preparations and data analysis.
Naeem Sohail: Description, manuscripts text reading and data analysis.
Conflicts of interest
The authors have declared no conflicts of interest.
References
Alagurajan, M., and C. Vijayakumaran. 2020. ML methods for crop yield prediction and estimation: An exploration. Int. J. Eng. Adv. Technol., 9(3): 3506-3507. https://doi.org/10.35940/ijeat.C5775.029320
Babicki, S., D. Arndt, A. Marcu, Y. Liang, J.R. Grant, A. Maciejewski and D.S. Wishart. 2016. Heatmapper: Web-enabled heat mapping for all. Nucl. Acids Res., 44(W1): W147-W153. https://doi.org/10.1093/nar/gkw419
Berrar, D., 2019. Cross-validation. Encycl. Bioinf. Comput. Biol., 1: 542-545. https://doi.org/10.1016/B978-0-12-809633-8.20349-X
Burman, P., 1989. A comparative study of ordinary cross-validation, v-fold cross-validation and the repeated learning-testing methods. Biometrika, 76(3): 503-514. https://doi.org/10.1093/biomet/76.3.503
Cawley, G.C., and N.L. Talbot. 2010. On over-fitting in model selection and subsequent selection bias in performance evaluation. J. Mach. Learn. Res., 11: 2079-2107.
Cielen, D., A. Meysman and M. Ali. 2016. Introducing data science: Big data, machine learning, and more, using Python tools: Manning Publications Co.
Dangeti, P., 2017. Statistics for machine learning: Packt Publishing Ltd.
Elavarasan, D., and P.D.R. Vincent. 2021a. Fuzzy deep learning-based crop yield prediction model for sustainable agronomical frameworks. Neural Computing and Applications, pp. 1-20. https://doi.org/10.1007/s00521-021-05950-7
Elavarasan, D., and P.D.R. Vincent. 2021b. A reinforced random forest model for enhanced crop yield prediction by integrating agrarian parameters. J. Ambient Intell. Hum. Comput., pp. 1-14. https://doi.org/10.1007/s12652-020-02752-y
Fushiki, T., 2011. Estimation of prediction error by using K-fold cross-validation. Stat. Comput., 21(2): 137-146. https://doi.org/10.1007/s11222-009-9153-8
Ghorbanzadeh, O., H. Shahabi, F. Mirchooli, K.V. Kamran, S. Lim, J. Aryal and T. Blaschke. 2020. Gully erosion susceptibility mapping (GESM) using machine learning methods optimized by the multi-collinearity analysis and K-fold cross-validation. Geomat. Nat. Hazard. Risk, 11(1): 1653-1678. https://doi.org/10.1080/19475705.2020.1810138
Gonzalez-Sanchez, A., J. Frausto Solís and W. Ojeda-Bustamante. 2014. Predictive ability of machine learning methods for massive crop yield prediction. Span. J. Agric. Res., 12(02): 313-328. https://doi.org/10.5424/sjar/2014122-4439
Haque, F.F., A. Abdelgawad, V.P. Yanambaka and K. Yelamarthi. 2020. Crop yield analysis using machine learning algorithms. Paper presented at the 2020 IEEE 6th World Forum on Internet of Things (WF-IoT). https://doi.org/10.1109/WF-IoT48130.2020.9221459
Hui, E.G.M., E.G.M. Hui and S. John. 2019. Learn R for applied statistics: Springer. https://doi.org/10.1007/978-1-4842-4200-1
Igual, L., and S. Segui. 2017. Introduction to data science a python approach to concepts,techniques and applications: Springer International Publishing Switzerland 2017. pp. 1-4.
Islam, M., 2022. Integrating statistical and machine learning techniques to predict wheat production in Pakistan. A thesis submitted to the Islamia University of Bahawalpur for the award of the degree of doctor of philosophy in Statistics session 2017-2020. .
Islam, M., and F. Shehzad. 2022. A prediction model optimization critiques through centroid clustering by reducing the sample size, integrating statistical and machine learning techniques for wheat productivity. Scientifica, 2022: 7271293. https://doi.org/10.1155/2022/7271293
Islam, M., F. Shehzad and M. Omar. 2021. Modeling wheat productivity using hierarchical regression: A way to address food security concerns. Element. Educ. Online, 20(2): 1184-1195.
Jeong, J., J.P.M. Han-Resop, D. Nathaniel, Fleisher, D.H. Yun, Kyungdahm, E.E. Butler, D.J. Timlin, K.M. Shim, J.S. Gerber and V.R. Reddy. 2016. Random forests for global and regional crop yield predictions. PLoS One, 11(6): e0156571. https://doi.org/10.1371/journal.pone.0156571
Jung, Y., 2018. Multiple predicting K-fold cross-validation for model selection. J. Nonparamet. Stat., 30(1): 197-215. https://doi.org/10.1080/10485252.2017.1404598
Nelli, F., 2015. Python data analytics: Data analysis and science using pandas. Matplotlib, and the Python Programming Language.
Peng, J.L., M.J. Kim, M.H. Jo, D.H., Min, K.D. Kim, B.H. Lee and K.I. Sung. 2017. Accuracy evaluation of the crop-weather yield predictive models of Italian ryegrass and forage rye using cross-validation. J. Crop Sci. Biotechnol., 20(4): 327-334. https://doi.org/10.1007/s12892-017-0090-0
Sarkar, D., R. Bali and T. Sharma. 2018. Practical machine learning with Python. A problem-solvers guide to building real-world intelligent systems. Berkely: Apress. https://doi.org/10.1007/978-1-4842-3207-1
Sharma, I.T.B., G. Singh, K. Venkatesh and O. Gupta. 2015. Enhancing wheat production. A global perspective. Indian J. Agric. Sci., 85(1): 3-13.
Singh, V., A. Sarwar and V. Sharma. 2017. Analysis of soil and prediction of crop yield (Rice) using Machine Learning approach. Int. J. Adv. Res. Comput. Sci., 8(5).
Sun, S., Z. Cao, H. Zhu and J. Zhao. 2019. A survey of optimization methods from a machine learning perspective. IEEE Trans. Cybern., 50(8): 3668-3681. https://doi.org/10.1109/TCYB.2019.2950779
Wilkinson, L., and M. Friendly. 2009. The history of the cluster heat map. Am. Stat., 63(2): 179-184. https://doi.org/10.1198/tas.2009.0033
Yadav, N., S.M. Alfayeed and A. Wadhawan. 2020. Machine learning in agriculture: techniques and applications. Int. J. Eng. Appl. Sci. Technol., 5(7): 118-122. https://doi.org/10.33564/IJEAST.2020.v05i07.018
To share on other social networks, click on any share button. What are these?

