Near-Infrared Spectroscopy (NIRS) Application for Quantitative Characterization of Edible Grains


Research Article
Near-Infrared Spectroscopy (NIRS) Application for Quantitative Characterization of Edible Grains
Saba Iqbal1, Salman Khurshid1*, Hafiza Mehwish Iqbal1, Qurrat-Ul-Ain Akbar1, Aqeel Ahmed Siddique3, Saqib Arif1, Shahid Yousaf2, Masooma Munir4, Abdul Karim Khan4, Shazia Arif5, Abdul Ahad6 and Muhammad Arif7
1Food Quality and Safety Research Institute, SARC, PARC, Karachi University Campus, Karachi, Pakistan; 2Food Science Research Institute, NARC, PARC, Islamabad, Pakistan; 3Institute of Plant Introduction, SARC, PARC, Pakistan; 4Mountain Agricultural Research Center, PARC, Gilgit, Pakistan; 5University of Karachi, Karachi, Pakistan; 6Outreach Research Activities Unit, PARC-SARC, Karachi, Pakistan; 7Zarai Taraqiati Bank Limited, Islamabad, Pakistan.
Abstract | The near-infrared spectroscopy (NIRS) an analytical method in the field of laboratory instrumentation. The attempts have been made to explore the utility of NIR for variety of samples matrices. The present work has been undertaken to assess the efficacy of NIRS method for quantitative characterization of wheat grains in terms of hardness. Since wheat is the staple food and its hardness is one of the basic quality traits being used in local and international trade. In addition to the NIR-spectroscopy, wheat grain samples were also analyzed through standard methods for hardness such as hardness index (HI) and particle size index (PSI). Samples had hardness scores ranging between 55.5 and 79.1. A positive correlation shown among the values of NIRS and HI (r = 0.92). However, PSI values were weakly related to HI (r = -0.46) and NIR (r = -0.30) values. The grouping of data further suggested that the samples belonged to the medium and hard wheat classes. The correlation coefficients (r) evaluated for medium wheat class and hard wheat class were 0.92 and 0.70, respectively. Thus, the NIR spectroscopy technique showed better performance for grains possessing medium hardness. Since the NIR technique is rapid, reliable and does not require expertise for operation, it has a great potential for utilizing in grain testing laboratories to support our grain industry and trade.
Received | October 08, 2022; Accepted | December 21, 2023; Published | December 28, 2022
*Correspondence | Salman Khurshid, Food Quality and Safety Research Institute, SARC, PARC, Karachi University Campus, Karachi, Pakistan; Email: Salmankhurshid67@gmail.com
Citation | Iqbal, S., S. Khurshid, H.M. Iqbal, Q.U.A. Akbar, A.A. Siddique, S. Arif, S. Yousaf, M. Munir, A.K. Khan, S. Arif, A. Ahad and M Arif. 2022. Near-infrared spectroscopy (NIRS) application for quantitative characterization of edible grains. Pakistan Journal of Agricultural Research, 35(4): 678-684.
DOI | https://dx.doi.org/10.17582/journal.pjar/2022/35.4.678.684
Keywords | Grains, Hardness, Near infrared spectroscopy, Performance evaluation, Particle size index
Copyright: 2022 by the authors. Licensee ResearchersLinks Ltd, England, UK.
This article is an open access article distributed under the terms and conditions of the Creative Commons Attribution (CC BY) license (https://creativecommons.org/licenses/by/4.0/).
Introduction
Near infrared (NIR) spectroscopy application has gained importance in recent years. It is currently used in many sectors such as pharmaceutical and cosmetics, textile and agriculture with a rapid growth and success (Tripathi and Mishra, 2009). It is known as non-invasive, non-destructive and a simple technique and does not require any sample preparation for the ground and unground samples. Therefore, the continuous growth since its introduction and has taken some proven place among all spectroscopic analysis mainly for evaluating the quality of agro food products (Ozaki et al., 2006; Tripathi and Mishra, 2009).
Various analytical techniques including HPLC (Zuo et al., 2002), gas chromatography (GC) (Togari et al., 1995) and plasma atomic emission spectroscopy (Herrador and Gonzalez, 2001), capillary electrophoresis (Horie et al., 1997) and calorimetric methods (Najjar, 2020) are useful for the analyses of agricultural stuff and their products. Such techniques involve high cost, consumes more time and require expertise for their operation. Whilst, optical spectra base instruments are time and cost effective without destruction of sample (Alander et al., 2013). In NIR, a single beam of photon allows to determine different analytes simultaneously with no time and with great robustness. The electromagnetic radiation interacted with a chemical substance (Ozaki et al., 2006). When the energy is transfer through the physical substances including solid surfaces, liquid or gaseous state, absorption of different frequencies of the radiation was occurred and converts into molecular vibrations NIR spectra are obtained due to combination of overlapping absorption bands and fundamental molecular vibration associated basically with C-H, N-H, S-H and O-H functional groups present in the molecules (Najjar, 2020).
NIR weak bands arise from the original ground state to higher excited states and occur at multiples of the fundamental transition vibration frequency (Aenugu et al., 2011). According to the reference (Roggo et al., 2007), NIR spectroscopy diffuse the reflection of light in the region of 800–2500 nm to the mid infrared region from 12821-4000cm-1.
Some studies have been conducted to explore the utility of NIR on grains. NIR-spectroscopy is the leading and opportune technique that is used for analysis of wheat quality characteristics (Williams and Norris, 1987). Initially NIR-spectroscopy had been used for determining moisture content in wheat grains. Other constituents like protein and fats were also analyzed in food and feed (Singh et al., 2010). Spectra based technique offer estimation of wheat quality by specific optical sensor for color damage and mycotoxin (Dowell et al., 2002, 2006). Hardness of winter wheat was also evaluated by using NIR-spectroscopy with lowest coefficient of variance as compare to hardness index and particle size index methods (Faměra et al., 2004).
The laboratory assistance for any value chain is critical. It is essentially needed to provide assistance in quantitative terms and convey reliable information based on scientific instruments. The decision based on such information are more reliable. Wheat is a staple food of most of the nations in this world. Pakistan is generally produces sufficient quantity of wheat and sometime export the surplus quantity to other countries as well. The quality of wheat is therefore remaining the area of interest to stake holders including consumer. By knowing the benefits of NIR-spectroscopy, this study was conducted to evaluate the performance of spectra base technique for evaluation of wheat grain hardness to support industry and trade of the country.
Materials and methods
Sample description
Cleaned and healthy samples of Wheat grain (free from foreign matter) were chosen for this study. All Those selected samples were analyzed for hardness using NIR and in comparison, with standard method (AACC) viz. Hardness Index (HI) and Particle Size Index (PSI).
Sample preparation for NIRS
Three composite samples of about 1Kg were prepared to analyze the thrice. Sample was drawn into collecting chamber for analysis. Prior to analysis, moisture content of samples was determined through Brabender hot air oven following the set procedure of AACC. Moisture of all the sample were found in narrow range (10-11%).
Principle of NIRS
A non-destructive Near-infrared spectrometric technique (NIRS) Omaga Analyzer (Germany) used for the analysis of quality of grains. A beam of light from tungsten halogen brightens the optical dispersing device (monochromator). Monochromator separate the color component of light and dispersed the light beam was different angle. Radiations in NIR hit the sample reflected in all direction. The reflected beam was accumulated under a detector unit which finally generated a corresponding photometric signal (Figure 1).
Mechanism of hardness index tester
Differences of wheat hardness leading to the differences of mechanical degree of commination. Based on this principle, the hard wheat face difficulty to be milled (powder) as compared to soft wheat while being grinded. The wheat hardness was measured under specific condition (moisture level 5-9%) according to the ratio between the sample weight and the sample gross weight.
The mill knife was driven by the motor drive installed in the external surface of the rotor. This shear and crushes the sample together followed by the centrifugal airflow. The field was made within the crushing room by the rotor blade, meanwhile, powder particles were entered into the loading hopper. The weight of powder particles which have been passed are different caused by the different wheat hardness under certain crushing time. The wheat hardness was measured by the ratio between the weight of remained powder particles and the tested wheat sample weight. The obtained value was taken as hardness index. Higher index values reflect the hardness of wheat.
Particle size index
Wheat kernel texture has important implication for milling quality parameters such as starch damaged, water absorption and gas production. For grain hardness, particle size index method of AACC 55-30 was performed. Cleaned wheat kernels with 10-11% moisture was used for determination. About 22-23g of wheat grain were milled by using Perten laboratory mill 3100 equipped with mesh size of 0.8mm. Approximately 10g of the flour were weighed and sieved from U.S. No. 75 sieve for 10 min using sieve shaker. The sieve threw were weighed by using the formula given below:
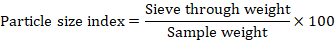
For wheat hardness index JYDX 100 × 40 hardness index tester were used following the regulation GB/T 5497.
Statistical analysis
All the test were performed in triplicate and result reported with mean and standard deviations. Correlation coefficients (r) were determined by using SPSS software (SPSS version 17, Inc., USA).
Results and Discussion
This research activity was carried out to assess the performance of NIR-spectroscopy for determining hardness of wheat. For this purpose, wheat samples were evaluated for hardness through NIRS, hardness index (HI) and particle size index (PSI).
NIR spectra
Figure 2 shows a representative NIR spectra obtained on wheat samples. It is clear from the spectra that hard wheat samples had high absorbance as compared to the medium wheat. This may be due to intracellular spaces between starch molecules present in wheat kernel, creating discontinuous protein patches (Glenn and Saunders, 1990). This probably sends back the scattered light to the sensor and as a result it gives less absorbance for soft wheat than hard wheat sample. The peaks around 900-920nm and 970-1020nm represent the ability of hardness related to protein, starch and color differences (Maghirang and Dowell, 2003).
NIRS and standard techniques
The NIR hardness values were compared with the values obtained from PSI and HI techniques (Figure 3). Results shown in the Figure 3 suggested that the trend of NIR values is close to the trend of HI values. Mass distribution of whole wheat flour and their properties of wheat were recorded empirically during milling process. Values from NIRS and singulator and crushing mechanism (single kernel characterization system; SKCS) were compared to evaluate performance on the basis of wheat hardness as a quality parameter. A significant correlation (r=0.94) had been reported between the hardness values from NIR and SKCS (Groos et al., 2004).
Figure 4 demonstrates the quantum of differences in values of NIR and HI techniques for same samples. The values of wheat hardness by HI and NIR-spectroscopy were ranged from 55.6 – 79.1 and 31.3 – 60.0 with average difference of 17.5, respectively. Such difference was due to the difference in measurement range. The NIR spectroscopy usually ranged between 30 and 60 whereas the HI values ranged between 50 and 80.
Faměra et al. (2004) investigated different methods for wheat hardness of winter wheat varieties. NIR-spectroscopy had shown low coefficient of variance (12.6%) in comparison quality characteristics like, wheat hardness index (WHI) and particle size index (PSI) with coefficient of variation 32.8 and 30.6, respectively.
Correlations
Figure 5 represents the correlations of NIRS values with the HI and PSI values separately. A positive association (r= 0.92) among the values of NIRS and HI values. Hardness of winter wheat was determined by different methods like NIR spectroscopy and hardness index (HI). These methods were correlated with each other to check their performance for hardness of winter wheat. Significant correlation was recorded between WHI × NIR (r = 0.84) for winter wheat varieties (Faměra et al., 2004).
Results further suggested that PSI values were weakly related to HI (r = -0.46) and NIR (r = -0.30) values. Faměra et al. (2004) conducted a study on comparison of different methods for hardness of winter wheat. NIRS and particle size index (PSI) had shown significant positive correlation (r= 0.74) whereas hardness index (HI) and particle size index (PSI) were significantly negatively correlation (r= –0.79).
NIRS performance on medium and hard wheat
A frequency distribution had been applied to group the data into hard and medium wheat groups (Figure 6). Almost equal number of samples fell into these two groups. It has also been observed that most of the wheat available in Pakistan belongs to the medium hard wheat class. Khurshid et al. (2017) determined physicochemical attributes of wheat available in Pakistan, hardness score wheat varieties reflected medium hard to hard range. Arif et al. (2007) evaluated seven spring wheat varieties for physicochemical attributes, hardness score revealed that all varieties belonged to hard wheat class.
Both the wheat groups were separately analyzed for correlation coefficients (Figure 7). This exercise was undertaken to understand that which type of wheat can be best suitably analyzed through NIR. Results showed that the efficiency of NIR technique was high (r = 0.92) when utilized for medium wheat class. Whilst the NIR technique can also utilize for hard wheat class as suggested from strong relationship (r = 0.70). The reference (Surowiec et al., 2017) compared near infrared (NIR) and microwave resonance sensors (MRS) for moisture analysis. Significant correlation (r= 0.97) was recorded between the values of NIRS and MRS.
Conclusions and Recommendations
Near infrared spectroscopy has given the opportunity to overcome the limitations of other analytical techniques. It is simple, reliable, rapid, non-destructive and environment friendly. The study suggested that the agro-based industry can take such benefits from this technique for the assessment of their products’ quality. The medium hard wheat class, which is more common in Pakistan, can be reliably analyzed through NIR spectroscopy. The alternate way to assess the wheat quality will likely to support the industry and trade of the country.
Acknowledgments
The authors are thankful to their lab staff for assisting to carry out the research work.
Novelty Statement
The study findings elaborated the precision and accuracy of analysis by NIR technique. Most common wheat class of Pakistan viz. Medium Hard Wheat found to reveal the significant results for key quality indicators of Hardness and Particle Size Index.
Author’s Contribution
Saba Iqbal: Designed, analyzed samples and results reporting.
Qurrat-Ul-Ain Akbar: Gave technical support and conceptualization.
Saqib Arif: Supervision and reviewed the manuscript.
Salman Khurshid: Statistical application, data analysis and wrote the manuscript.
Hafiza Mehwish Iqbal: provided assistance throughout the study and managed article.
Shahid Yousaf and Masooma Munir: Provided assistance in writing of manuscript.
Aqeel Ahmed Siddique, Abdul Karim Khan, Abdul Ahad and Muhammad Arif: Provision of samples and field activities, support in manuscript write-up.
Shazia Arif: Spectroscopy understanding and assistance in reporting results.
Conflict of interest
The authors have declared no conflict of interest.
References
Aenugu, H.P.R., D.S. Kumar, N.P. Srisudharson, S.S. Ghosh and D. Banji. 2011. Near infra red spectroscopy. An overview. Int. J. Chem. Tech. Res., 3(2): 825-836.
Alander, J.T., V. Bochko, B. Martinkauppi, S. Saranwong and T. Mantere. 2013. A review of optical nondestructive visual and near-infrared methods for food quality and safety. Int. J. Spec., pp. 1-36. https://doi.org/10.1155/2013/341402
Arif, S., M. Ahmed, M.A. Bhutto, M. Azam and H. Abbas. 2007. Some physicochemical traits of seven spring wheat cultivars grown in southern-zone of Pakistan. Int. J. Biol. Biotech., 4(2–3): 277-279.
Dowell, F., E. Maghirang, F. Xie, G. Lookhart, R. Pierce, B. Seabourn and O. Chung. 2006. Predicting wheat quality characteristics and functionality using near-infrared spectroscopy. Cereal Chem., 83(5): 529-536. https://doi.org/10.1094/CC-83-0529
Dowell, F.E., T.C. Pearson, E.B. Maghirang, F. Xie and D.T. Wicklow. 2002. Reflectance and transmittance spectroscopy applied to detecting fumonisin in single corn kernels infected with Fusarium verticillioides. Cereal Chem., 79(2): 222-226. https://doi.org/10.1094/CCHEM.2002.79.2.222
Faměra, O., M. Hrušková and D. Novotná. 2004. Evaluation of methods for wheat grain hardness determination. Plant Soil Environ., 50: 489-493. https://doi.org/10.17221/4063-PSE
Glenn, G.M., and R.M. Saunders. 1990. Physical and structural properties of wheat endosperm associated with grain texture. Cereal Chem., 67(2): 176-182.
Groos, C., E. Bervas and G. Charmet. 2004. Genetic analysis of grain protein content, grain hardness and dough rheology in a hard× hard bread wheat progeny. J. Cereal Sci., 40(2): 93-100. https://doi.org/10.1016/j.jcs.2004.08.006
Herrador, M.A., and A.G. Gonzalez. 2001. Pattern recognition procedures for differentiation of green, black and oolong teas according to their metal content from inductively coupled plasma atomic emission spectrometry. Talanta, 53(6): 1249-1257. https://doi.org/10.1016/S0039-9140(00)00619-6
Horie, H., T. Mukai and K. Kohata. 1997. Simultaneous determination of qualitatively important components in green tea infusions using capillary electrophoresis. J. Chrom. A, 758(2): 332-335. https://doi.org/10.1016/S0021-9673(96)00764-9
Khurshid, S., S. Yousaf, K. Kadir, H.M. Iqbal, Q.U.A. Akbar and S. Arif. 2017. Physicochemical properties of wheat (Triticum aestivum L.) available for consumption in pakistan. Int. J. Biol. Biotech., 14(4): 607-614.
Maghirang, E.B., and F.E. Dowell. 2003. Hardness measurement of bulk wheat by single-kernel visible and near-infrared reflectance spectroscopy. Cereal Chem., 80(3): 316-322. https://doi.org/10.1094/CCHEM.2003.80.3.316
Najjar, K., 2020. Sensing botrytis cinerea in tomato using visible/Near-Infrared (VIS/NIR) spectroscopy PhD thesis. Palestine Technical University-Kadoorie, Palestine.
Ozaki, Y., A.A. Christy and W.F. McClure. 2006. Near-infrared spectroscopy in food science and technology. John Wiley and Sons, New York, United States. https://doi.org/10.1002/0470047704
Roggo, Y., P. Chalus, L. Maurer, C. Lema-Martinez, A. Edmond and N. Jent. 2007. A review of near infrared spectroscopy and chemometrics in pharmaceutical technologies. J. Pharma. Biomed. Anal., 44(3): 683-700. https://doi.org/10.1016/j.jpba.2007.03.023
Singh, C.B., R. Choudhary, D.S. Jayas and J. Paliwal. 2010. Wavelet analysis of signals in agriculture and food quality inspection. Food Bioproc. Tech., 3(1): 2-12. https://doi.org/10.1007/s11947-008-0093-7
Surowiec, I., L. Vikstrom, G. Hector, E. Johansson, C. Vikstrom and J. Trygg. 2017. Generalized subset designs in analytical chemistry. Anal. Chem., 89(12): 6491-6497. https://doi.org/10.1021/acs.analchem.7b00506
Togari, N., A. Kobayashi and T. Aishima. 1995. Pattern recognition applied to gas chromatographic profiles of volatile components in three tea categories. Food Res. Int., 28(5): 495-502. https://doi.org/10.1016/0963-9969(95)00029-1
Tripathi, S., and H. Mishra. 2009. A rapid FT-NIR method for estimation of aflatoxin B1 in red chili powder. Food Cont., 20(9): 840-846. https://doi.org/10.1016/j.foodcont.2008.11.003
Williams, P., and K. Norris. 1987. Near-infrared technology in the agricultural and food industries: American Association of Cereal Chemists, Inc. Rockville, Maryland.
Zuo, Y., H. Chen and Y. Deng. 2002. Simultaneous determination of catechins, caffeine and gallic acids in green, Oolong, black and pu-erh teas using HPLC with a photodiode array detector. Talanta, 57(2): 307-316. https://doi.org/10.1016/S0039-9140(02)00030-9
To share on other social networks, click on any share button. What are these?