
Multidimensional Poverty Profile of Rural Households and its Determinants: Evidence from Khyber Pakhtunkhwa, Pakistan


Research Article
Multidimensional Poverty Profile of Rural Households and its Determinants: Evidence from Khyber Pakhtunkhwa, Pakistan
Urooj Shakoor* and Syed Attaullah Shah
The University of Agriculture Peshawar, Khyber Pakhtunkhwa, Pakistan.
Abstract | This study examined multidimensional poverty profile in rural Khyber Pakhtunkhwa (Pakistan), using Alkire-Foster Method, and a binary logit analysis was conducted to identify its determinants. Data set of 3035 rural households, extracted from Pakistan Social and Living Standard Measurement survey (2018-19), was grouped into three geo-climate zones (Northern, Central and Southern zones). Results from data analysis revealed that 46.6 percent of the sampled rural households were multidimensional poor and the derived Multidimensional Poverty Index (MPI), at 0.30 cutoff level, was 0.254 for the overall rural Khyber Pakhtunkhwa. The decomposition of the household’s average deprivation level revealed that ‘living-standard’ and ‘health’ contributed more than 75 percent to overall poverty collectively. Regression analysis identified head’s age, education, household’s income, and agricultural land ownership as negatively affecting determinants of multidimensional poverty. The incidence of poverty was high in the Northern and Southern divisions, reflecting imbalanced regional development. These findings suggest government intervention in housing and health sectors. The current ‘Naya Pakistan Housing Program (NPHP)’ is well targeted and needs to be extended to the rural areas, where poor people are deprived of standard housing facilities. The ‘Sehat Insaaf Program’ of health insurance is very inspiring; however, its domain for vide range of health treatments and its validity in private hospitals may be authorized.
Received | December 17, 2021; Accepted | November 25, 2022; Published | December 29, 2022
*Correspondence | Urooj Shakoor, The University of Agriculture Peshawar, Khyber Pakhtunkhwa, Pakistan; Email: u-shakoor@outlook.com
Citation | Shakoor, U., and S.A. Shah. 2022. Multidimensional poverty profile of rural households and its determinants: Evidence from Khyber Pakhtunkhwa, Pakistan. Sarhad Journal of Agriculture, 38(5): 372-382.
DOI | https://dx.doi.org/10.17582/journal.sja/2022/38.5.372.382
Keywords | Multidimensional poverty, Health, Education, Living standard, Alkire-foster method, Regression analysis, Pakistan
Copyright: 2022 by the authors. Licensee ResearchersLinks Ltd, England, UK.
This article is an open access article distributed under the terms and conditions of the Creative Commons Attribution (CC BY) license (https://creativecommons.org/licenses/by/4.0/).
Introduction
Poverty is deprivation from basic and valuable necessities required for a good life. It is the result of inability or lack of capability of individuals and society to meet the minimum social and economic requisites for survival (Suel et al., 2019). An individual is considered as poor if he/she is deprived of multiple basic requisites at the same time, e.g., good health, food, clean water, electricity, good quality of working environment, education, etc. Poverty alleviation, in all its forms, is the first goal (SDG-1) of the 2030 Agenda for Sustainable Development (Colglazier, 2015); however, the very first and more debatable issue in this direction is the measurement of poverty.
So far, many methods have been introduced to address the measurement issue of poverty. For many years, researchers have used income as a sole indicator, based on the idea that poverty is the lack of monetary resources necessary for a person or family to satisfy their basic needs. But, focusing on one factor alone, such as income, is not enough to capture the multiple dimensions of poverty. The idea of understanding poverty in a multidimensional manner emerged in the late 19th century (Alkire et al., 2011). Sen (1999), the recipient of the Nobel Prize for economics, believed that poverty is better defined in the domain of capabilities which contribute to its understanding in a multidimensional way. In other words, she suggested the capabilities based multidimensional measurement of poverty.
Review of research studies on poverty measuring methods shows that in most cases, not all income poor individuals were multidimensional poor and not all multidimensional poor individuals were income poor (Alkire and Fang, 2019). This was because some of the basic goods and services, such as adequate sanitation, clean water and air, quality education and health services, are impossible to attain even with high income level. All these deprivations experienced by poor people are included in the multidimensional poverty.
Overtime, different methods have been developed for measurement of multidimensional poverty. In 1980s, the ‘Unsatisfied Basic Needs’ method was used in Latin America (Turriago et al., 2020). This index uses indicators in four areas of people’s basic needs (housing, health services, basic education and minimum income). The UNDP (1996), introduced the Human Poverty Index (HPI), which assesses the situation of countries using a group of indicators that measure average attainment in three basic dimensions of human development (Krishnaji, 1997). In 2010 the Multidimensional Poverty Index (MPI) was introduced by Alkire and Foster and developed by the UNDP (Alkire et al., 2011). It incorporates indicators for three basic dimensions: education, health and living standard.
The Alkire-Foster’s MPI presents a comprehensive picture of households/people in poverty and allows assessments across countries, regions, within countries by ethnic group and urban-rural location. From analytical viewpoint, it is a useful tool to identify the most vulnerable people, reveal poverty patterns across regions/ countries and over time. This measure help policy makers in identifying which component cause poverty and which one is the most frequent among and within poor groups and thus more effective policies can be designed to reduce poverty. It is more flexible and different dimensions, indicators, and cut-off level selection can be used to create measures that can be complemented with other measures of poverty, such as income.
The Government of Pakistan for the first time, with the collaboration of the Oxford Poverty and Human Development Initiative (OPHI) and the United Nations Development Program (UNDP), mapped and measured multidimensional poverty for 2014-15 at urban-rural levels of the entire country. Using Alkire-Foster method on PSLM data for 2014-15, the estimated MPI was 28 percent for rural areas, 4 percent for urban areas and 19.7 percent for overall country. The MPI across provinces were 15%, 23%, 25% and 48% for Punjab, Sindh, Khyber Pakhtunkhwa and Baluchistan, respectively (Figure 1).
Apart from this comprehensive study, only few researchers have investigated the multidimensional poverty profile for the provinces of Punjab and Sindh. Khan et al. (2011) observed a significant decrease in multidimensional poverty during 1998 and 2008, and found a substantial decrease in rural areas. Sial et al. (2015) found that poverty and inequality in uni-dimensional as well as in multidimensional context has declined in Pakistan between 2005 and 2010. Khan and Akram (2018) measured multidimensional poverty in Pakistan using PSLM-2004-05 and PSLM 2014-15 surveys data. Their estimated MPIs ranged from 27 percent for rural and 4 percent for urban areas. Khan et al. (2020) found an increase in multidimensional poverty levels in 2010 and 2014. Surprisingly, not a single wide-ranging study was found for Khyber Pakhtunkhwa and Balochistan in the past five years.
Multidimensional poverty needs to be investigated on regular basis at 4-5 years interval. This is required for testing the effectiveness of the adopted policies and for making a short-run and more targeted changes if required. That’s why this study was designed to map multidimensional poverty profile in the rural areas of Khyber Pakhtunkhwa, identify its determinants, and forward recommendations for more effective policy change.
Materials and Methods
Study area
The study was conducted in the Khyber Pakhtunkhwa, Pakistan. The province is bordered by Afghanistan to the northwest, Gilgit-Baltistan to the northeast, Azad Kashmir and Islamabad Capital to the east, and Punjab to the southeast (Figure 2). It is the 3rd largest province in population and is ranked at 4th place in total area. The total population of the province is over 35.5 million and about 60 percent of the people are living in rural areas. Majority of the province’s natives are ethnic Pashtuns and Hindko speakers.
The province is divided into three geo-climate zones: Northern, Central and Southern zones. The Northern zone is mostly mountainous and plains are sparse. To the north, this zone is surrounded by the Hindu Kush, the Himalayas and the Karakoram mountain ranges. The livelihood of the people here is related to agriculture and tourism. Malakand and Hazara are the two administrative divisions in this zone.
The central zone consists mostly of plains and is quite famous for agriculture. Due to suitable climate and abundant availability of water for irrigation, two crops are grown here in a year. The sources of livelihood of the people are agriculture, trade and business. This zone is divided into three divisions, Mardan and Peshawar.
The southern zone of Khyber Pakhtunkhwa, like the Central zone, consists mostly of plain areas, but due to hot and dry climate agriculture and agricultural production is very low. Due to the provincial government’s investment in dames in irrigation projects, has transformed agriculture from subsistence to a commercialized form activity. Kohat, Bannu and D.I. Khan are the three administrative divisions in this zone.
Sampling and data collection
This study was based on micro-level data on households’ socio-economic characteristics and macro-level data on geo-climatic zones. The micro-level data required for this study was obtained from Pakistan Social and Living Standard Measurement (PSLM) survey collected by the Pakistan Bureau of Statistics (PBS). The PBS conducts PSLM survey on regular basis at 2 to 3 years interval. As households in rural areas of Khyber Pakhtunkhwa were the target population of this study, the PSLM 2018-19 survey data for the rural areas of Khyber Pakhtunkhwa province were extracted and utilized for data analysis. The sampled population for the study area in PSLM survey was divided into seven administrative divisions and three zones, based on their location in the Northern, Central and Southern geo-climatic zones of the province. The distribution of the sampled rural households across different divisions within the geo-climate zones are given below in Table 1. The total number of sampled households were 3035, out of which 1453 households were from the northern zone and the remaining 874 and 708 households were from the central and southern zones, respectively. For data on macro-level data on geo-climatic characteristics, secondary data with Khyber Pakhtunkhwa Environmental Protection Agency and Pakistan Metrological department, were utilized.
Table 1: Distribution of the sampled rural households into divisions and geo-climate zones.
|
Administrative divisions |
Households sample |
||
|
Division based |
Zone based |
||
|
Northern zone |
Malakand |
768 |
1453 |
|
Hazara |
685 |
||
|
Central zone |
Mardan |
299 |
874 |
|
Peshawar |
575 |
||
|
Southern zone |
Kohat |
266 |
708 |
|
Bannu |
220 |
||
|
D.I. Khan |
222 |
||
|
3 zones |
7 Divisions |
Total: 3035 |
Total: 3035 |
Source: PSLM survey report (2018-19).
Analytical framework
Alkire-Foster multidimensional poverty indexing: The study adopted the Alkire-Foster methodology for measurement and analysis of multidimensional poverty. The Alkire-Foster method is built on a household’s/ individual’s deprivation score for different indicators categorized under three dimensions: Health, Education and Living-standards. The method is flexible for changing or adding indicators and dimensions.
The very first step of Alkire-Foster method is to define the set of variables/ indicators for measurement of deprivation in the Health, Education and Living standard dimensions. Details on the indicators are provided in Table 2. The next step involves selection of a deprivation cutoff for an indicator to decide whether the household is deprived of it or not. A weight is assigned to the household if found as deprived, and a deprivation score for each dimension is derived equal to the sum of its indicators’ weights. The deprivation cutoffs and weights assigned to indicators are provided in Table 2. Each dimension was assigned a weight of 0.3333 (33.33 percent) and was divided equally among its indicators.
Table 2: Multidimensional deprivation matrix.
|
Dimension (weight) |
Indicators for poverty dimensions |
||
|
Indicator |
Weight |
Deprivation cut-off |
|
|
1. Education (0.333) |
Uneducated elders |
0.1111111 |
Deprived if all men or women (=>20years of age) are uneducated. |
|
Non-school going children |
0.1111111 |
Deprived if any child (6-15 years of age) is not going school. |
|
|
Low quality education |
0.1111111 |
Deprived if children are not going school because of staff issue, no rooms and other facilities, more distance. |
|
|
2. Health (0333) |
No proper immunization |
0.1111111 |
Deprived if any child, under the age of 5, is not immunized according to the vaccination calendar. |
|
No proper natal care |
0.1111111 |
Deprived if any woman in the house has given birth in the last 3 years, and did not receive pre and post-natal care. |
|
|
Unskilled assistance |
0.1111111 |
Deprived if any woman in the in the last 3 years has given birth at home or attended by an untrained person. |
|
|
3. Living standard (0.333) |
Overcrowded living rooms |
0.0333333 |
Deprived if more than 4 individuals per living room. |
|
Drinking water quality |
0.0333333 |
Deprived if drinking water source is open well or unprotected stream or causing hepatitis or tuberculosis. |
|
|
Wastes management |
0.0333333 |
Deprived if poor solid and liquid wastes management system. |
|
|
Poor toilet facility |
0.0333333 |
Deprived if open defecation at indoor/ outdoor |
|
|
Low quality walls/floor |
0.0333333 |
Deprived if wall/ floor are constructed of low quality material (mud, timber, bamboo, branches, etc.) |
|
|
Roof |
0.0333333 |
Deprived if roof is constructed of low quality material (mud, timber, bamboo, branches, etc.) |
|
|
No electricity for lightening |
0.0333333 |
Deprived if household has no access to electricity. |
|
|
Low quality fuel sources |
0.0333333 |
Deprived if household is not using gas, electricity or solar stoves for cooking and heating. |
|
|
No/ few durable goods |
0.0333333 |
Deprived if no more than two small assets (TV, sewing machine, air cooler, bicycle, etc.) or no larger assets (refrigerator, AC, motorcycle, car, etc.) |
|
|
No farmland/ no livestock |
0.0333333 |
Deprived if no farmland owned, orchard, livestock, fish farm, poultry farm, etc. |
|
The final step involves selection of a poverty cutoff level ‘k’. A household is declared as multidimensional poor if its aggregate deprivation score (the sum of dimensional deprivation scores) is found equal to or greater than the selected ‘k’ level. In this study, poverty-cutoff levels of 30 percent (0.30) was used for multidimensional poverty measurement and analysis.
The Multidimensional Poverty Index (MPI) is calculated by multiplying the incidence of poverty (percentage of poor Individuals-H) with intensity or average deprivation (A) level of the poor.
Econometric analysis
Literature review reveals that researchers have conducted regression analyses for estimation of multidimensional poverty and identification of its economic determinants. The selection of a proper regression model, however, depends on how the poverty status of an individual or a household is defined.
A household’s poverty status (Y) can be either defined as a continuous variable (aggregate deprivation score) or as a qualitative variable (poor and non-poor). Following Alkire et al. (2011), this study defined Y as a binary qualitative variable and assumed its value of 1 if the household was multidimensional poor or its aggregate deprivation score was equal to or greater than 0.30 (30 percent), otherwise 0. The following binary logit model was used to predict a rural household’s probability of being multidimensional poor and identify its determinants.
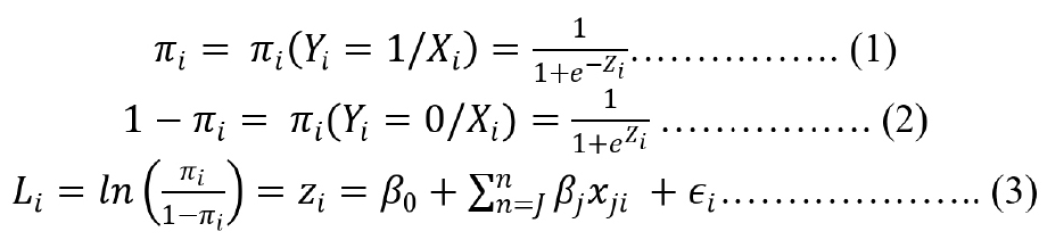
Where; πi is the ith household’s probability of being multidimensional poor; πi/1- πi is the odds ratio in favor of being multidimensional poor; Yi is the actual poverty status of the ith household (1 if poor, 0 otherwise); X is the vector of expected determinants of multidimensional poverty; z or L is called logit and is an index ranging from -∞ to ∞; and βs are the coefficients/weights on X variables.
The independent variables in this model were the micro-level household’s characteristics and area specific macro-variables, such as infrastructure, accessibility during emergency and geo-climatic characteristics.
Results and Discussion
Households’ socioeconomic characteristics
Table 3 give summary statistics for households’ socioeconomic and area specific characteristics, such as public infrastructure for health, education and roads and area accessibility during emergency.
Table 3: Summary statistics for households’ characteristics.
|
Characteristics |
Mean |
Std. Dev. |
|
Male headed households |
83.9% |
-- |
|
Head’s age (Years) |
47.5 |
14.348 |
|
Head’s education (Years) |
5.3 |
5.469 |
|
Household’s size (Individuals) |
7.6 |
3.637 |
|
Total annual income (PKR) |
460259 |
401236 |
|
Households having Agri. Land |
16.5% |
-- |
|
Households having diversified livelihood |
83.0% |
-- |
|
Agriculture as primary source of income |
24.0% |
-- |
|
Poor public infrastructure |
15.7% |
-- |
|
Inaccessible during emergency |
20.0% |
-- |
Majority of the households (84%) were headed by male individuals, and the age and education level of the heads were on average 47.5 years and 7 years, respectively. The average household’s size was 8 individuals, and its annual income was 460259 Pakistani Rupees (PKR). The daily pre-capita income was on average 158PKR (1.3 US$) which significantly lower than the poverty line of 1.90 US$ for the year 2018-19.
Most of the sampled households had their income from diversified sources, and only 24 percent of them had agriculture as primary source of their income. About 16 percent were owners of farmland, and 21 percent were involved in multi species livestock farming, such as cattle, sheep and buffalo farming.
Around 20 percent of the households were located in poorly accessible areas. The public infrastructure for around 16 percent of the sampled households was categorized as of poor quality. Most of the households in the upper northern and the southern zones had limited access to basic public facilities, such as health and education, and were barely accessible because of hard terrain and security reasons.
Table 4: Deprivation in poverty dimensions and their indicators.
|
Poverty indicators |
KP |
Malakand |
Hazara |
Mardan |
Peshawar |
Kohat |
Bannu |
D.I. Khan |
|
Unskilled assistance |
0.182 |
0.099 |
0.307 |
0.157 |
0.172 |
0.132 |
0.218 |
0.162 |
|
Improper immunization |
0.349 |
0.374 |
0.425 |
0.258 |
0.282 |
0.301 |
0.436 |
0.297 |
|
Natal services |
0.391 |
0.385 |
0.416 |
0.385 |
0.407 |
0.331 |
0.409 |
0.356 |
|
Health deprivation (HD) |
0.102 |
0.095 |
0.127 |
0.089 |
0.096 |
0.085 |
0.118 |
0.091 |
|
Non-school going Children |
0.405 |
0.417 |
0.359 |
0.211 |
0.393 |
0.383 |
0.632 |
0.599 |
|
Un educated elders |
0.088 |
0.092 |
0.114 |
0.050 |
0.068 |
0.041 |
0.105 |
0.140 |
|
Low quality education |
0.124 |
0.087 |
0.213 |
0.074 |
0.092 |
0.102 |
0.200 |
0.081 |
|
Education deprivation (ED) |
0.069 |
0.066 |
0.076 |
0.037 |
0.061 |
0.058 |
0.104 |
0.091 |
|
Roof materials |
0.435 |
0.538 |
0.320 |
0.284 |
0.423 |
0.451 |
0.559 |
0.527 |
|
Walls/Floor materials |
0.666 |
0.665 |
0.537 |
0.639 |
0.657 |
0.718 |
0.914 |
0.820 |
|
Low Fuel type |
0.834 |
0.858 |
0.863 |
0.809 |
0.671 |
0.820 |
0.973 |
1.000 |
|
Low lightening sources |
0.022 |
0.030 |
0.041 |
0.013 |
0.009 |
0.019 |
0.009 |
0.005 |
|
Overcrowded rooms |
0.323 |
0.363 |
0.187 |
0.365 |
0.414 |
0.353 |
0.323 |
0.279 |
|
Low drinking water quality |
0.248 |
0.340 |
0.422 |
0.067 |
0.083 |
0.154 |
0.132 |
0.297 |
|
Poor toilet facility |
0.204 |
0.214 |
0.124 |
0.154 |
0.193 |
0.192 |
0.341 |
0.396 |
|
Poor wastes management |
0.227 |
0.188 |
0.074 |
0.298 |
0.278 |
0.259 |
0.523 |
0.270 |
|
Durable goods |
0.217 |
0.259 |
0.448 |
0.194 |
0.080 |
0.139 |
0.032 |
0.027 |
|
No agricultural land |
0.856 |
0.857 |
0.876 |
0.873 |
0.908 |
0.853 |
0.736 |
0.752 |
|
Living standard Depr (LSD). |
0.134 |
0.144 |
0.130 |
0.123 |
0.124 |
0.132 |
0.151 |
0.146 |
|
Aggregate Depr. score (HD + ED + LSD) |
0.305 |
0.305 |
0.333 |
0.249 |
0.281 |
0.275 |
0.374 |
0.327 |
Deprivation in poverty dimensions
Table 4 presents summary statistics for the sampled households deprived in selected indicators, average deprivation scores for each dimension and aggregate deprivation score. Weights assigned to each dimension and its indicators, given in Table 2, were used in the derivation of aggregate deprivation score.
Descriptive statistics for health indicators show that children in 34.89 percent of the sampled households were improperly immunized, pregnant females of 39.1 percent households did not receive pre and post-natal cares, and delivery cases in 18.1 percent of the households were handled by unskilled persons or occurred at home. The derived health deprivation score for overall rural Khyber Pakhtunkhwa was 0.102 out of 0.3333. Across the administrative divisions, highest scores were derived for Hazara and Bannu divisions, respectively.
Estimates for the education were satisfactory as compared to the health. Out of the total sampled households, only 9 percent had uneducated elders, however, 40.4 percent had unenrolled children and 12.4 percent of them considered low quality education facilities (deficiency of male/ female staff, poor building, no electricity, etc.) as a major reason for it. The education deprivation score for rural Khyber Pakhtunkhwa was 0.069. Highest scores were estimated for Bannu and D.I. Khan Divisions, respectively.
Of the living standard, statistics for housing structure indicators show that 66.6 percent of the households were living in poorly constructed rooms (made of mud, woods or other inappropriate material), and 32.3 percent were overcrowded, having more than 4 individuals per bedroom. Results for indoor environmental standards reveal that 83 percent of the households were deprived of low smoke pollution causing fuels, such as electric, solar or gas stoves, 24.8 percent were deprived of safe drinking water sources, and 20.4 percent had no proper toilet facility. In addition to this, 22.7 percent of the households had no proper management system for external solid and liquid wastes. Figures for assets possession reveal that 21.7 percent of the households were deprived of durable goods (e.g., refrigerator, electric generator, water pump, solar panel, car, motorbike, etc.) and 85.7 percent had no ownership of agricultural land. The deprivation score for living standard was on average 0.134. for overall KP, and highest deprivation scores were obtained for Bannu, D.I. Khan and Malakand divisions.
Table 5: Household level multidimensional poverty estimates.
|
Poverty indicators |
KP |
Malakand |
Hazara |
Mardan |
Peshawar |
Kohat |
Bannu |
D.I. Khan |
|
Multidimensional poor households |
0.466 |
0.469 |
0.483 |
0.355 |
0.443 |
0.432 |
0.605 |
0.514 |
For the overall rural KP, a household’s aggregate deprivation score, obtained through summation of the deprivation in its health, education and living-standard was on average 0.305 out of 1. Administrative divisions with highest aggregate deprivation score were Bannu, D.I. Khan, Hazara and Malakand.
Household level multidimensional poverty patterns
By comparing the households’ aggregate deprivation scores with the poverty cutoff level of 0.30, 46.6 percent of them were found as multidimensional poor in overall rural KP. Division level household multidimensional poverty details are presented in Table 5. Highest number of poor households were found in Bannu, D.I. Khan, Hazara and Malakand divisions. The top two divisions include the merged districts of North Waziristan and South Waziristan, where the war against terror has resulted horrific deprivation in health, education and living standards.
The patterns of multidimensional poverty for overall rural KP and at the administrative division level were investigated by decomposing the aggregate deprivation scores according to the three dimensions. Results for the decomposition analysis are presented in Figure 3. For overall rural KP, dimensions indicating the highest deprivation score is the living-standards, followed by the health. They collectively contributed more than 75 percent to total aggregate deprivation. For administrative divisions, the same pattern of multidimensional poverty was found.
Multidimensional poverty indexing
After constructing the deprivation matrix, the next step is the indexing of the multidimensional poverty. As discussed in the previous section, the poverty cutoff level of 0.30 was selected to identify multidimensional poor households. This information was used derive the multidimensional poverty incidence (percentage of multidimensional poor individuals) and intensity (average aggregate deprivation score of the multidimensional poor individuals).
Table 6 presents the incidence and intensity of multidimensional poverty for the study area. The estimated incidence of 0.532 for overall rural KP indicates that half of the sampled individuals where multidimensional poor. The 3rd row of the table-6 provides details on the intensity of deprivation in multidimensional poor individuals. For overall KP, the average level of deprivation in multidimensional poor individuals was 0.466 on a scale of 0 to 1.
Table 6: Incidence, intensity and indexing of multidimensional poverty for rural KP.
|
Individuals’ poverty incidence (H) |
Individuals’ poverty intensity (A) |
Multidimensional poverty index (MPI) (MPI = H x A) |
|
|
KP |
0.532 |
0.477 |
0.254 |
|
Malakand |
0.536 |
0.459 |
0.246 |
|
Hazara |
0.557 |
0.555 |
0.309 |
|
Mardan |
0.434 |
0.416 |
0.181 |
|
Peshawar |
0.515 |
0.452 |
0.233 |
|
Kohat |
0.482 |
0.426 |
0.205 |
|
Bannu |
0.656 |
0.506 |
0.332 |
|
D.I. Khan |
0.553 |
0.468 |
0.258 |
The estimated MPI, derived as a product of the incidence and intensity of poverty, are given in the last column of Table 6. The MPI or adjusted headcount ratio for overall rural Khyber Pakhtunkhwa was 0.254 at k level of 0.30. This estimated MPI is slightly below the Government of Pakistan’s estimated MPI of 0.290 for rural Khyber Pakhtunkhwa in 2014-15. This reduction in MPI might be due to provincial government’s allocation of funds for health, such as the ‘Sehat Insaf Card’ program which aimed to improve poor households’ access to good quality medical services, through a micro health insurance scheme.
Determinants of multidimensional poverty
The estimated binary logit regression model, both in logit and marginal effect forms, are given in Table 7. The estimated likelihood ratio (LR)- statistic of 1213.02 with a probability value of 0.0000 suggests that the overall effect of the explanatory variables in predicting the probability of a household’s multidimensional poverty status is significant. Link test is used to check for specification problem in the model. Test result revels that the model is well specified and no important variable is missing.
The ROC curve is constructed for predicting power of the estimated model (Figure 4). The curve starts at (0, 0), corresponding to c = 1, and continues to (1, 1), corresponding to c = 0. A model with no predictive power would be a 45◦ line. The greater the predictive power, the more bowed the curve, and hence the area beneath the curve is often used as a measure of the predictive power. A model with no predictive power has area 0.5; a perfect model has area 1. The estimated ROC curve and area underneath it (0.84) confirms that the model’s predicting power is good.
Household’s size has positive significant association with their existence as multidimensional poor. It means that large sized households are likely to be multidimensional poor. Large household size result deprivation in quality education, health and living comforts, as a significant portion of income is used for meeting food requirements. Number of educated adults, income and agricultural land ownership have negative significant association with a household’s probability of existing as multidimensional poor. Education is a key economic variable important for poverty alleviation. It enhances individuals’ working efficiency and getting high salary jobs. Head’s age is another important factor, having negative significant effect on multidimensional poverty. Age of a head reflects his life experience, and an experienced individual can better manage a household’s resources to satisfy maximum of its wants.
Results for zones dummies-northern (reference category), central and southern zones-reveals that households in the central zones are likely better off. The economy of the upper northern zone largely depends on agriculture and tourism. Harsh winter climate significantly restricts their economic activities and causes migration of people to lower areas of the province. Hot and dry summers in southern part of the province restrict growth in the local economy and wellbeing of people.
Table 7: Estimated binary logit regression model for determinants of poverty.
|
Explanatory variables |
Coefficient |
Z statistic |
P-value |
dy/dx |
|
Household size (number of individuals) |
0.347 |
18.890 |
0.000 |
0.062 |
|
Head’s age (years) |
-0.035 |
-10.250 |
0.000 |
-0.006 |
|
Head’s gender (1 if male, 0 otherwise) |
0.002 |
0.020 |
0.983 |
0.000 |
|
Annual income (000000 Pakistani rupees) |
-1.630 |
-8.920 |
0.000 |
-0.029 |
|
Agri. Land ownership (1 if yes, 0 otherwise) |
-0.553 |
-4.390 |
0.000 |
-0.098 |
|
Educated elders (numbers) |
-3.380 |
-17.840 |
0.000 |
-0.602 |
|
Diversified livelihood (1 if yes, 0 otherwise) |
-0.117 |
-1.010 |
0.311 |
-0.021 |
|
Farming occupation (1 if yes, 0 otherwise) |
-0.040 |
-0.370 |
0.713 |
-0.007 |
|
Central geo-climate zone |
-0.240 |
-2.490 |
0.013 |
-0.043 |
|
Southern geo-climate zone |
-0.039 |
-0.290 |
0.775 |
-0.007 |
|
Constant term |
2.089 |
6.830 |
0.000 |
0.000 |
Observations: 3035; LR chi2(10): 980.58; Prob>chi2: 0.0000; Pseudo R2: 0.2338.
Results for most the micro-level variables were consistent with findings from previous studies on income poverty and multidimensional poverty (Rahman, 2013; Ningaye and Njong, 2014; Adeoti, 2014; Yousafi et al., 2015; Khan et al., 2015; Chen and Wang, 2015; Lue et al., 2016; Amao et al., 2017; Megbowon, 2018; Adepoju, 2018; Roy et al., 2019; Chen et al., 2019; Salam et al., 2020; Ahmad and Faridi, 2020; Ambaye et al., 2021; Qurat-ul-Ann and Mirza, 2021). This study’s findings on the effects of head’s age, education, household’s size, income and ownership of land on multidimensional poverty were similar to those of (Adeoti, 2014; Ningaye and Njong, 2014; Chen and Wang, 2015; Adepoju, 2018; Chen et al., 2019; Ahmad and Faridi, 2020).
The significant variation in multidimensional poverty across different regions, indicated by the estimated results for geo-climate zones dummies, was also concluded by (Adeoti, 2014; Ahmad and Faridi, 2020).
Conclusions and Recommendations
In rural Khyber Pakhtunkhwa, the incidence and intensity of multidimensional poverty was 53.2 percent and 47.7 percent, respectively. The Multidimensional Poverty Index (MPI) was found at 25.4 percent for rural Khyber Pakhtunkhwa. The estimated MPIs were comparatively high for the Southern and Northern divisions, revealing imbalanced regional development in Khyber Pakhtunkhwa.
The decomposition of the household level poverty according to the three dimensions revealed that ‘living-standard’ added 44.3 percent to the overall poverty. A huge proportion of households were lacked in ownership for agricultural land, properly constructed living rooms and were good quality fuel. Housing sector has largely been neglected by many governments in the past. The current Naya Pakistan Housing Program (NPHP) is well targeted.
Regression analysis revealed that heads age, education, household’s income and agricultural land holding were negatively associated with a household’s probability of being multidimensional poor. While household’s size raises the likelihood of being multidimensional poor. These results suggest that the government needs to focus on provision of free and easily accessible quality education. The Ehsaas education scholarship program for youth is very encouraging.
Limitations of the study
This study measure households deprivation in health, education and housing (living) standard. In addition to these three basic needs, the recent poverty alleviation projects are also focusing on environmental deprivation as another dimension. Poor people intensively depend on environment and natural resources for their livelihood. In most cases, their over dependence damages environment and natural resources. The degraded environment in return ruthlessly affect poor, and this two-way association result ‘environment-poverty trap’. Thus new models, capable of simultaneously linking the environment with poverty, are required to be developed and utilized for effective policy designing.
Acknowledgement
We are extremely thankful to Prof. Dr. Ghaffar Ali, Chairman Department of Agricultural & Applied Economics, the University of Agriculture Peshawar and Dr. Khurram Nawaz for their valuable suggestions to improve this research study.
Novelty Statement
This research study, for the first time, investigated multidimensional poverty profile of rural households at regional, divisional and district levels of Khyber Pakhtunkhwa, Pakistan. A modified version of Alkire-Foster’s method was adopted to measure Multidimensional Poverty Index (MPI), and households’ micro-level characteristics, districts level infrastructure and zones level geo-climate features were used in econometric analysis to predict poverty status of rural households and identify it’s determinants.
Author’s Contribution
Urooj Shakoor: Extracted data from PSLM survey, conducted by Goverment of Pakistan in 2018-19 and wrote the manuscript. This research paper is a part of her PhD dissertation.
Syed Attaullah Shah: Directed and supervised the reseach, helped in data analysis and wrote the manuscript.
Conflict of interest
The authors have declared no conflict of interest.
References
Adeoti, A.I., 2014. Trend and determinants of multidimensional poverty in rural Nigeria. J. Dev. Agric. Econ., 6(5): 220–231. https://doi.org/10.5897/JDAE2013.0535
Adepoju, A., 2018. Determinants of multidimensional poverty transitions among rural households in Nigeria (No. 2058-2018-5335).
Ahmad, R., and M.Z. Faridi. 2020. Socio-economic and demographic factors of poverty alleviation in Pakistan: A case study of southern Punjab. Rev. Econ. Dev. Stud., 6(2): 425-438. https://doi.org/10.47067/reads.v6i2.220
Alkire, S., and Y. Fang. 2019. Dynamics of multidimensional poverty and uni-dimensional income poverty: An evidence of stability analysis from China. Soc. Indic. Res., 142(1): 25-64. https://doi.org/10.1007/s11205-018-1895-2
Alkire, S., J.M. Roche, M.E. Santos and S. Seth. 2011. Multidimensional poverty index 2011: Brief methodological note.
Amao, J.O., K. Ayantoye and G.E. Fanifosi. 2017. An analysis of multidimensional poverty and its determinants in rural Nigeria. J. Dev. Agric. Econ., 9(11): 303-311. https://doi.org/10.5897/JDAE2017.0857
Ambaye, T.K., A.S. Tsehay and A.G. Hailu. 2021. Application of ordered logit model to analyze determinants of rural households multidimensional poverty in western Ethiopia. Int. J. Dev. Econ. Sustainability, https://doi.org/10.2139/ssrn.3819745
Chen, K.M., C.H. Leu and T.M. Wang. 2019. Measurement and determinants of multidimensional poverty: Evidence from Taiwan. Soc. Indic. Res., 145(2): 459-478. https://doi.org/10.1007/s11205-019-02118-8
Chen, K.M., and Wang, T.M., 2015. Determinants of poverty status in Taiwan: A multilevel approach. Soc. Indic. Res., 123(2): 371–389. https://doi.org/10.1007/s11205-014-0741-4
Colglazier, W., 2015. Sustainable development agenda: 2030. Science, 349(6252): 1048-1050. https://doi.org/10.1126/science.aad2333
Khan, A., A. Saboor, S. Ahmad and I. Ali. 2011. Mapping and measuring of multidimensional poverty in Pakistan: empirical investigations. Pak. J. Life Soc. Sci., 9(2): 121-127.
Khan, F.N., and S. Akram. 2018. Sensitivity of multidimensional poverty index in Pakistan. Pak. J. Soc., 9(Special Issue).
Khan, M., A. Saboor, M. Rizwan and T. Ahmad. 2020. An empirical analysis of monetary and multidimensional poverty: evidence from a household survey in Pakistan. Asia Pac. J. Soc. Work Dev., 30(2): 106-121. https://doi.org/10.1080/02185385.2020.1712663
Khan, R.E.A., H. Rehman and M. Abrar-ul-Haq. 2015. Determinants of rural household poverty: the role of household socioeconomic empowerment. Am. Eurasian J. Agric. Environ. Sci., 15(1): 93-98.
Krishnaji, N., 1997. Human poverty index: A critique. Econ. Polit. Wkly., pp. 2202-2205.
Leu, C.H., K.M. Chen and H.H. Chen. 2016. A multidimensional approach to child poverty in Taiwan. Child. Youth Ser. Rev., 66: 35–44. https://doi.org/10.1016/j.childyouth.2016.04.018
Megbowon, E.T., 2018. Multidimensional poverty analysis of urban and rural households in South Africa. Stud. Univ. Babes Bolyai-Oeconomica, 63(1): 3-19. https://doi.org/10.2478/subboec-2018-0001
Ningaye, P., and A.M. Njong. 2014. Determinants and spatial distribution of multidimensional poverty in Cameroon. Int. J. Soc. Sci. Stud., 3(1): 91–103. https://doi.org/10.11114/ijsss.v3i1.619
Qurat-ul-Ann, A.R., and F.M. Mirza. 2021. Determinants of multidimensional energy poverty in Pakistan: A household level analysis. Environ. Dev. Sustain., pp. 1-45. https://doi.org/10.1007/s11205-020-02601-7
Rahman, M.A., 2013. Household characteristics and poverty: A logistic regression analysis. J. Dev. Areas, pp. 303-317. https://doi.org/10.1353/jda.2013.0001
Roy, P., S. Ray and S.K. Haldar. 2019. Socio-economic determinants of multidimensional poverty in rural West Bengal: A household level analysis. J. Quant. Econ., 17(3): 603-622. https://doi.org/10.1007/s40953-018-0137-4
Salam, A., D.S. Pratomo and P.M.A. Saputra. 2020. Sosio-economic determinants of multidimensional poverty in the rural and urban areas of East Java. Nutrition, 1: 3.
Sen, A., 1999. Development as freedom (Oxford: Oxford University Press).
Sial, M.H., A. Noreen and R.U. Awan. 2015. Measuring multidimensional poverty and inequality in Pakistan. Pak. Dev. Rev., pp. 685-696. https://doi.org/10.30541/v54i4I-IIpp.685-698
Suel, E., J.W. Polak, J.E. Bennett and M. Ezzati. 2019. Measuring social, environmental and health inequalities using deep learning and street imagery. Sci. Rep., 9(1): 1-10. https://doi.org/10.1038/s41598-019-42036-w
Turriago-Hoyos, Á., W.A.M. Mateus and U. Thoene. 2020. Spatial analysis of multidimensional poverty in Colombia: Applications of the Unsatisfied Basic Needs (UBN) Index. Cogent Econ. Finance, 8(1): 1837441. https://doi.org/10.1080/23322039.2020.1837441
Yousefi, A., S. Mahdian and S. Khalaj. 2015. Determinants of multidimensional poverty in Iran rural areas. J. Rural Res., 6(4): 699-721.
To share on other social networks, click on any share button. What are these?

