
Molecular Studies on Some Virulent and Multi-Drug Resistant Cattle Klebsiella Strains and their Heamatobiochemical Impacts


Molecular Studies on Some Virulent and Multi-Drug Resistant Cattle Klebsiella Strains and their Heamatobiochemical Impacts
Ghada A. Ibrahim1*, Mohamed Sayed Helal1, Nahed Abd Elhafeeze Kamoura2, Mohamed Samir3,4, Amira Mohamed Mazid5, Mohamed F.M. Farag6
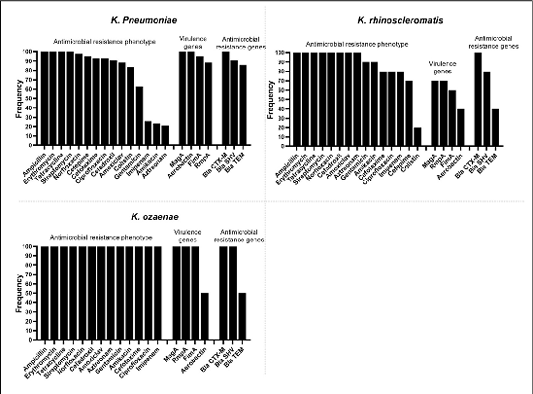
Frequency of antimicrobial resistance profile, relation between resistance and virulence genes in the analyzed Klebsiella spp.
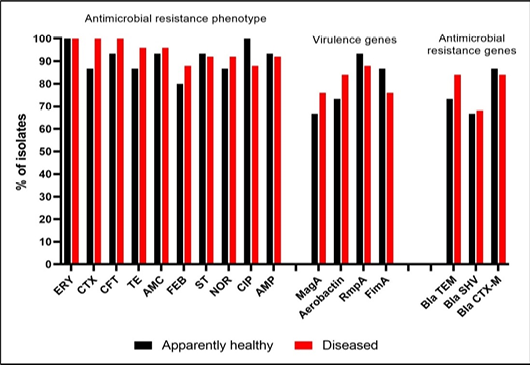
Frequency of antimicrobial resistance profile, resistance and virulence genes in isolates recovered from animal under different conditions. The axis shows the frequency of presence of certain trait (i.e. resistance phenotype, resistance genes and virulence genes) in isolates recovered from all animals representing each condition.

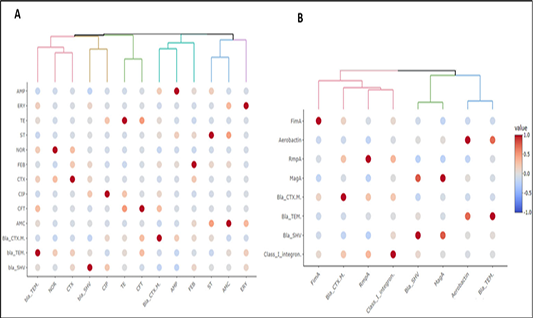
Heatmap showing the correlation coefficient (R) between pairs of (A) antimicrobial resistance phenotypes and antimicrobial resistance genes and (B) antimicrobial resistance genes and virulence genes. The color denotes R value as indicated on the side color scale. The upper dendrogram illustrate the clustering pattern of feature’s correlation according to their R value. Each colored branch of dendrogram represents a single cluster.

