
Mass Production of Panax ginseng C.A. Mey. Root Cultures in Indonesia


Mass Production of Panax ginseng C.A. Mey. Root Cultures in Indonesia
Stefan Pratama Chandra1, Yoanes Maria Vianney1, Theresia Liliani Christie2, Merlyn Wongso2, Melisa Widjaja2, Deok-Chun Yang3, Se Chan Kang4, Manar Fayiz Mousa Atoum5,6 and Johan Sukweenadhi1*

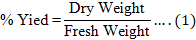
Bar chart of the effect of inoculum weight on a) fresh weight, b) dry weight, c) yield percentage and water content, and d) ginsenoside content. Values are means ± SD (n > 3). Based on the One-Way ANOVA, there was no significant difference in each parameter (P < 0.05 %).

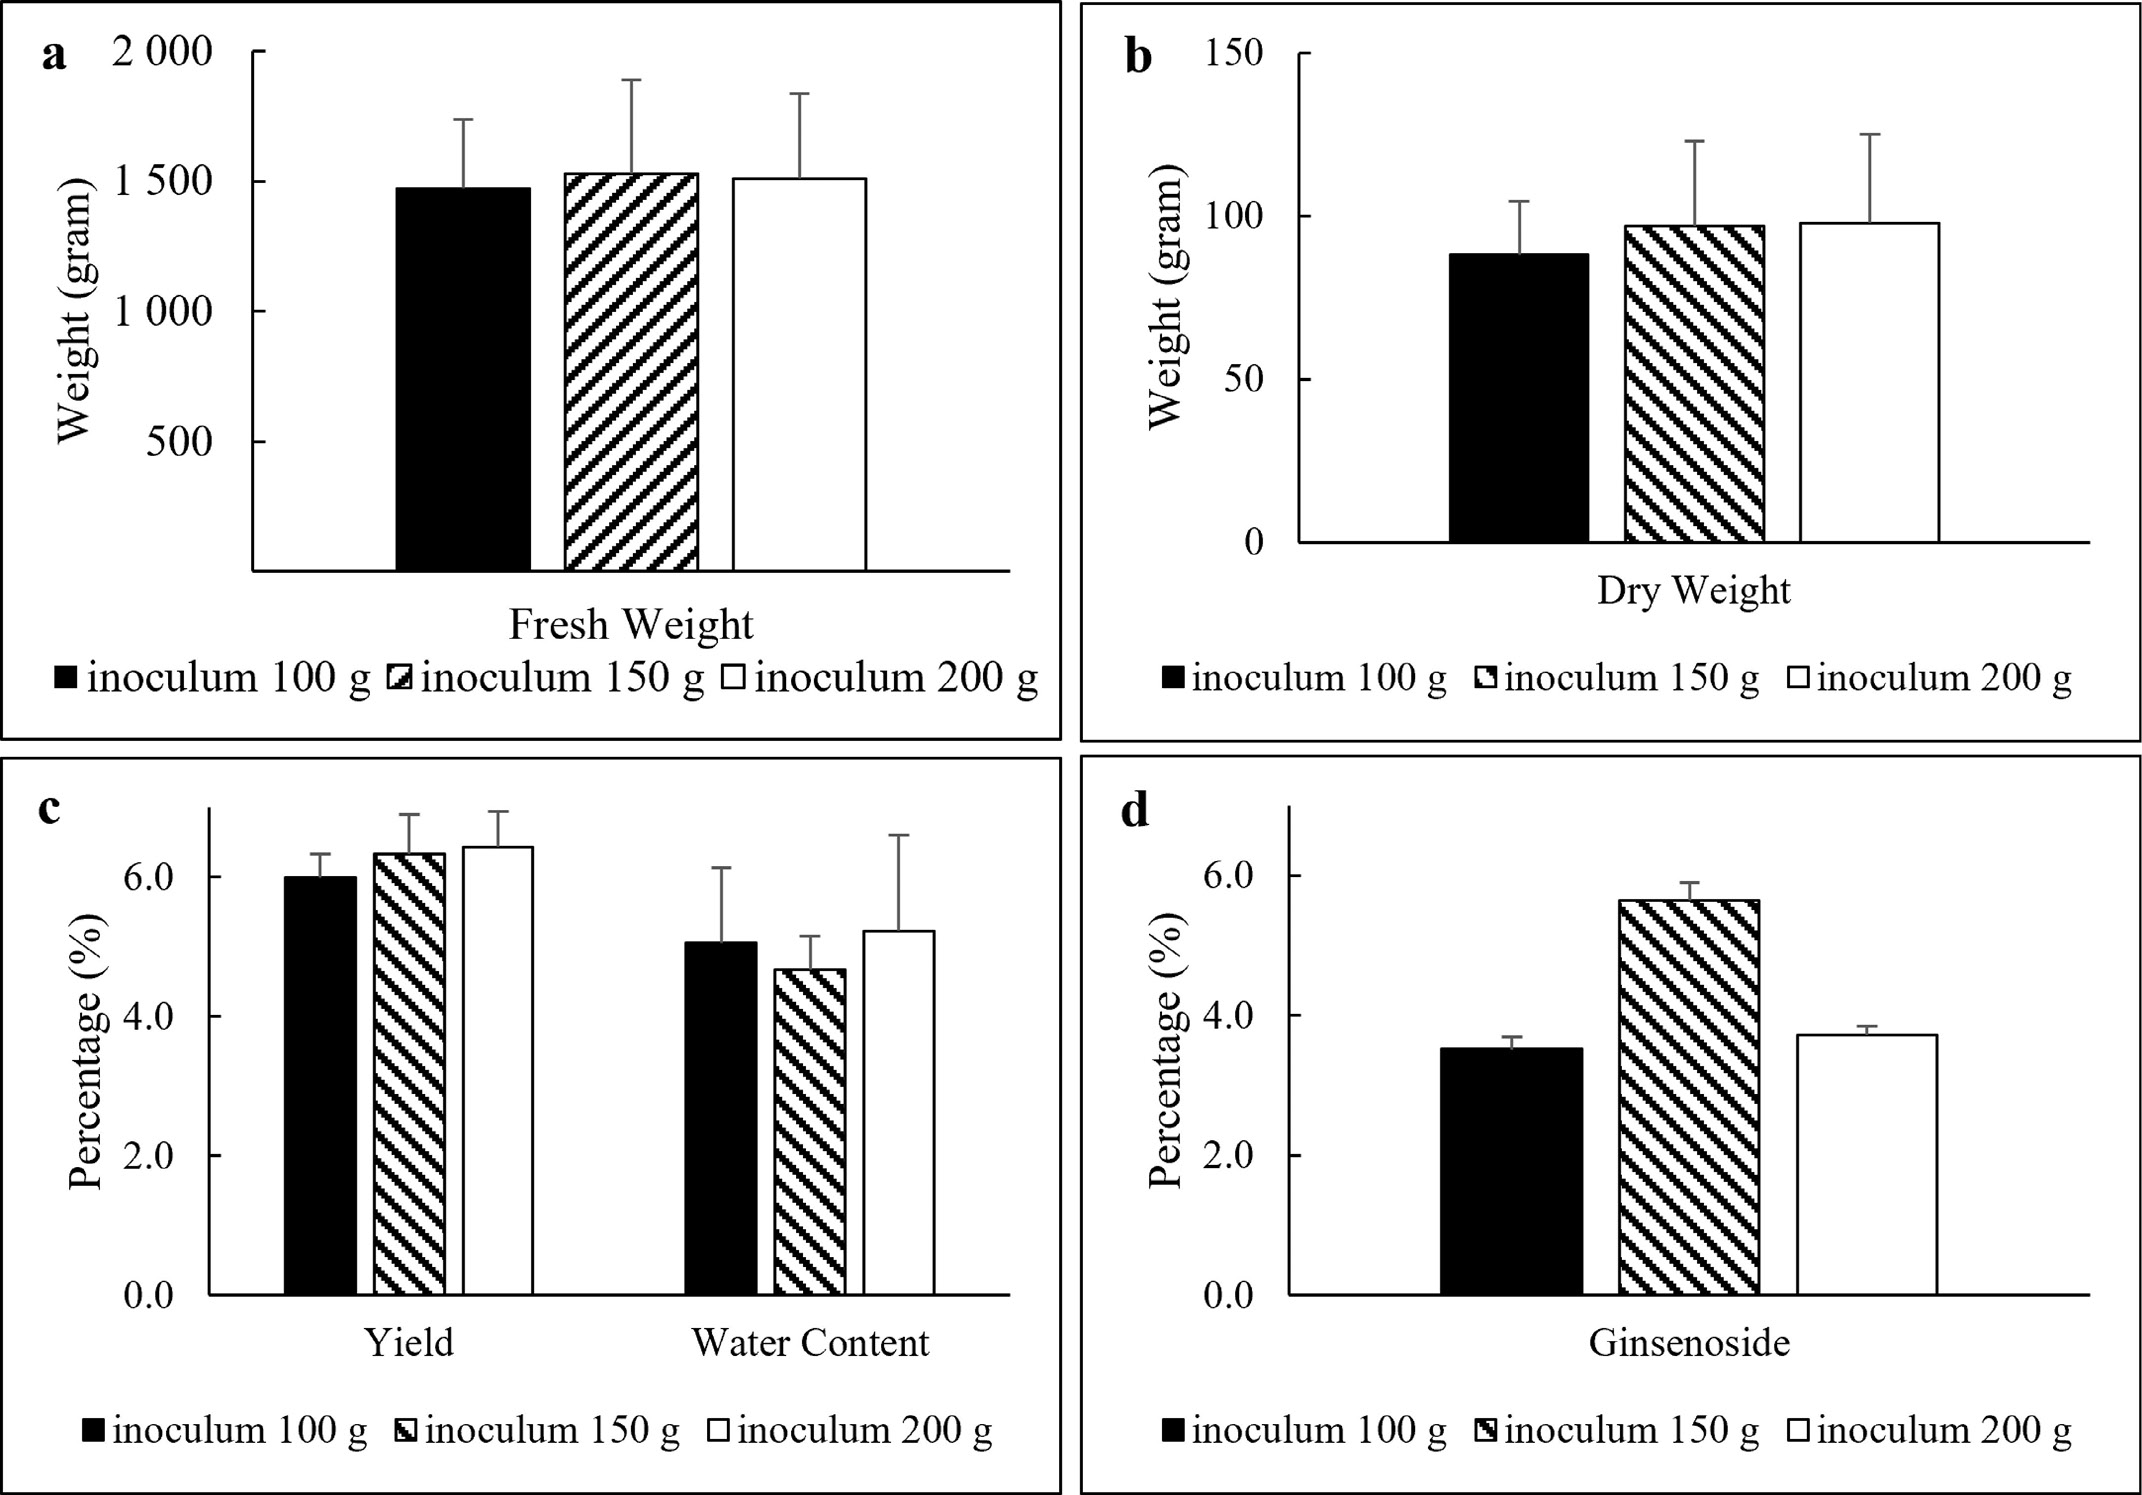
Bar chart of the effect of medium volume on a) fresh weight, b) dry weight, c) yield percentage and water content, and d) ginsenoside content. Values are means ± SD (n = 3). Significant differences are marked with (*) and (**) (P < 0.05 % and P < 0.01 %, respectively).
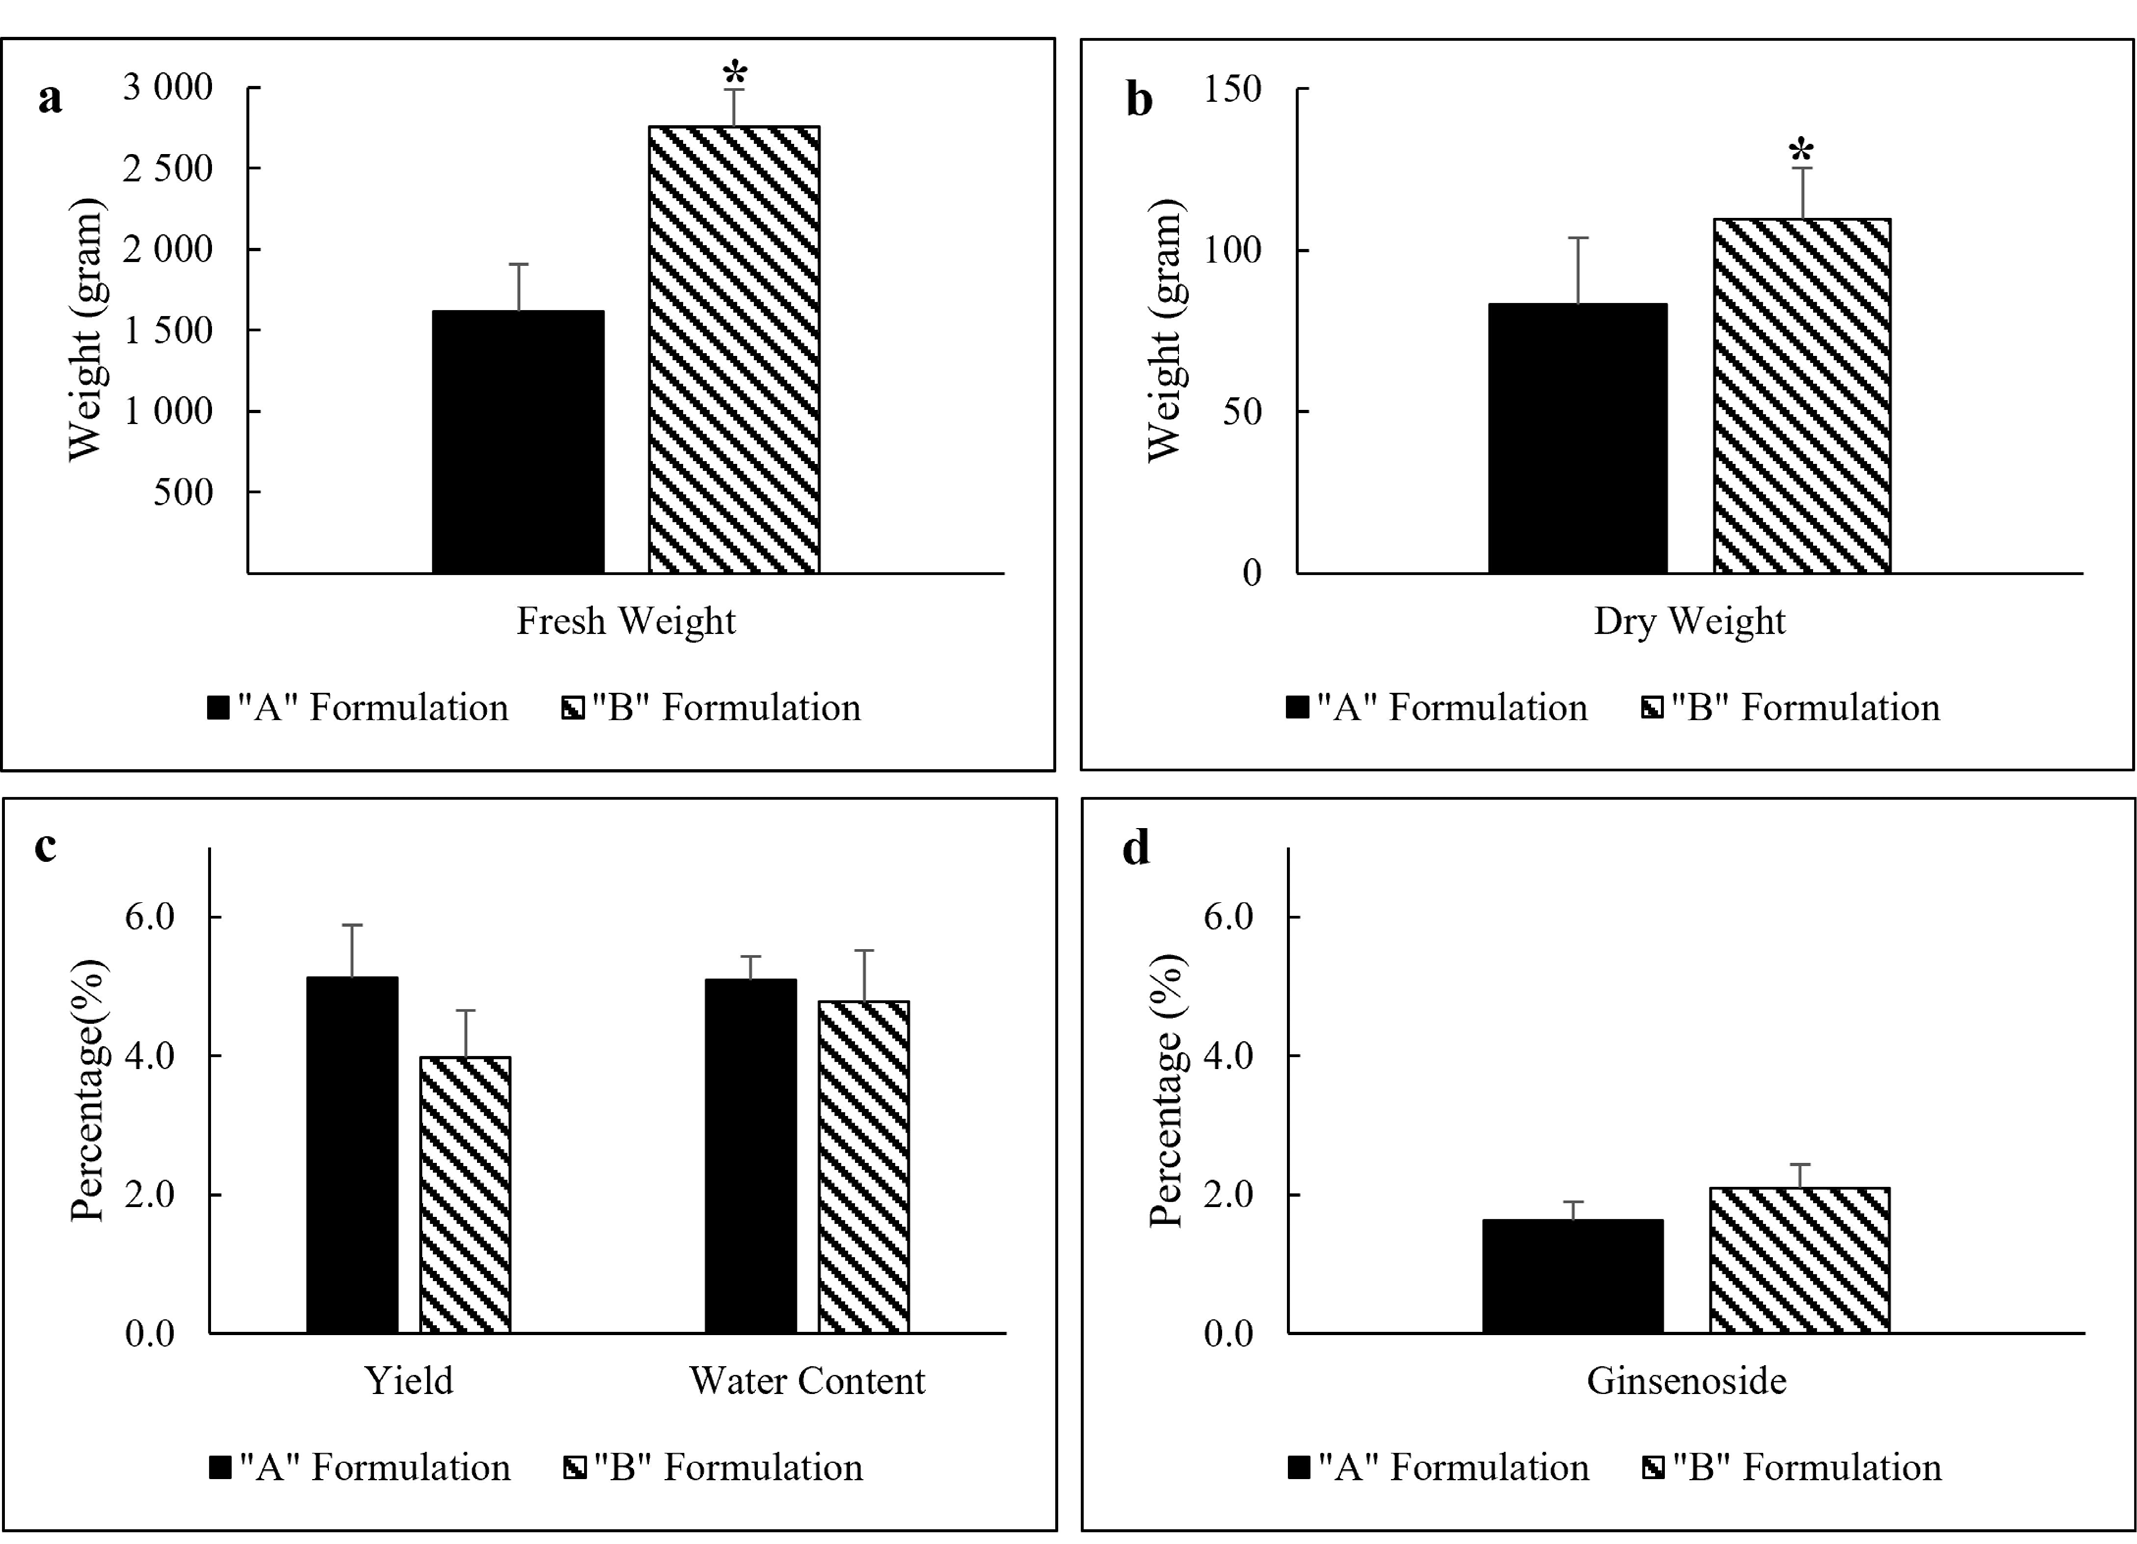
Bar chart of the effect of medium formulation on a) fresh weight, b) dry weight, c) yield percentage and water content, and d) ginsenoside content. Values are means ± SD (n > 3).

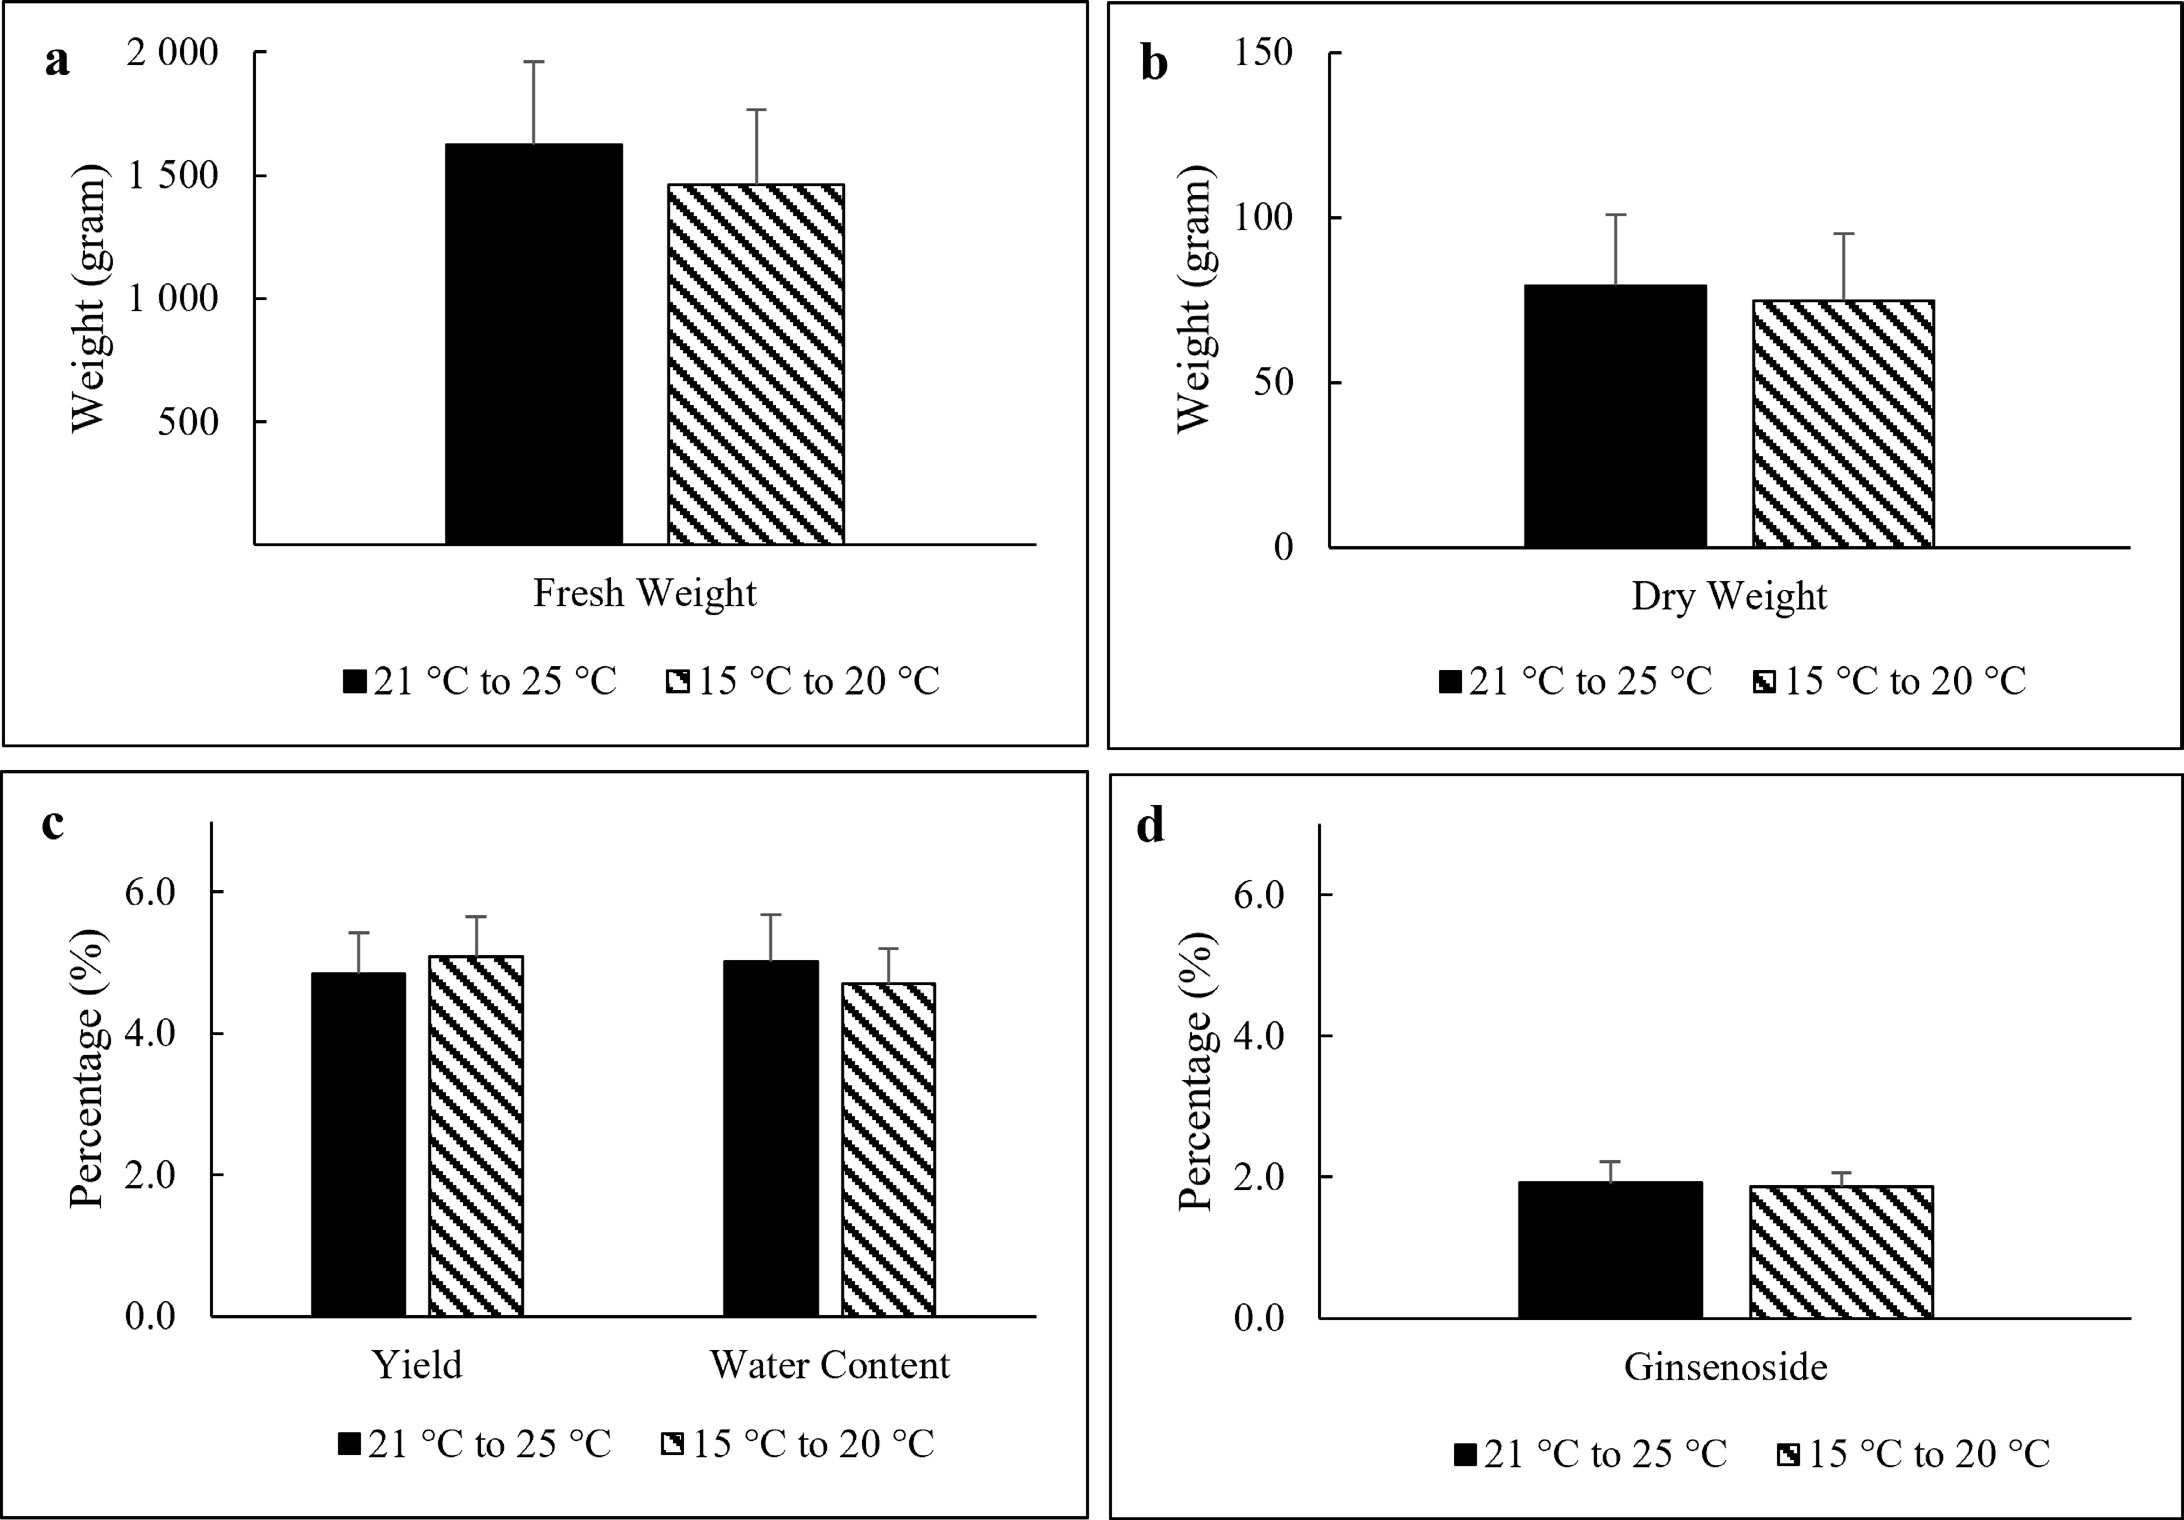
Bar chart of the effect of incubation temperature on a) fresh weight, b) dry weight, c) yield percentage and water content, and d) ginsenoside content. Values are means ± SD (n > 3). Based on the One-Way ANOVA, the parameters showed no significantly different values for each variation (P < 0.05 %).

