
Immunohistochemical and Histopathological Characterization of Immune Changes in the Host-tissue Reaction site of Murine Cystic Echinococcosis


Immunohistochemical and Histopathological Characterization of Immune Changes in the Host-tissue Reaction site of Murine Cystic Echinococcosis
Bnar Shahab Hamad1, Bushra Hussain Shnawa1*, Rafal Abdulrazaq Alrawi2

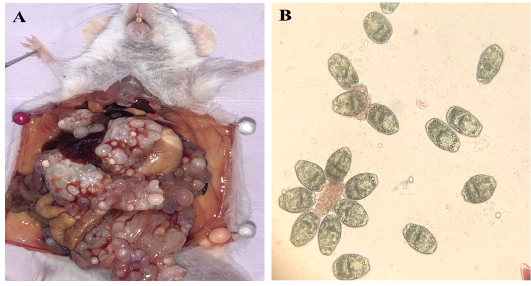
(A) Experimentally heavily infected mouse with hydatid cysts. (B) Protoscoleces were collected from E.granulosus infected sheep liver.
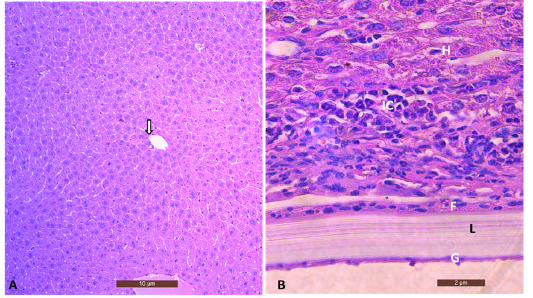
(A) Sections from the liver of the control uninfected mouse showed central vein (arrow) and hepatic cells(10X), Scale bar= 10µm. (B) Section of mice infected liver with hydatid cyst showing characteristics cyst layers laminated layer (L) and germinal layer (G) surrounded by fibrous tissue (F) with intense inflammatory cell infiltration (IC). (40X), Stained with H&E. Scale bar = 2µm.

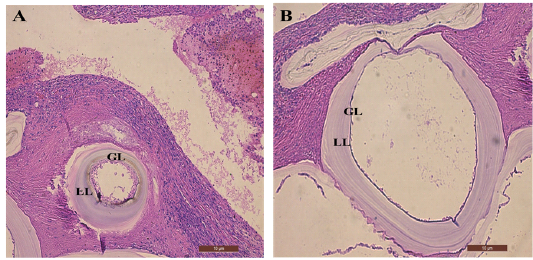
(A) and (B) show the secondary hydatid cyst in mice liver tissue of different sizes with (GL) germinal layer and (LL) laminated layer (10X), Stained with H&E. Scale bar = 10 μm

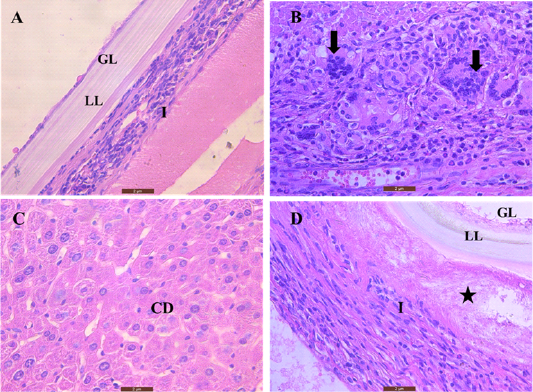
Sections of mice liver stained by hematoxylin and eosin (A and D) show the hydatid cyst layers: (GL) is the germinal layer, (LL) the laminated layer, and (I) infiltration of inflammatory cells that surround the hydatid cyst, the star indicates dead degenerated hepatic tissue (B) Shows accumulation of giant cells (arrows). (C) Illustrates cell degeneration (CD) and tissue necrosis adjacent to hydatid cyst (40X). Scale bar= 2µm

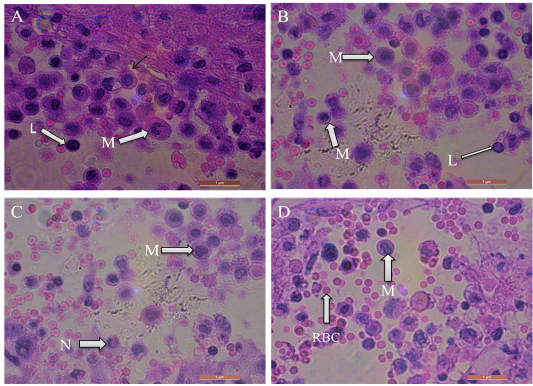
Sections of mice livers infected with hydatid cysts show infiltration of different inflammatory cells like macrophages (M), neutrophils (N), lymphocytes (L), and Red blood cells (RBC), Stained with H&E. scale bar = 1 μm

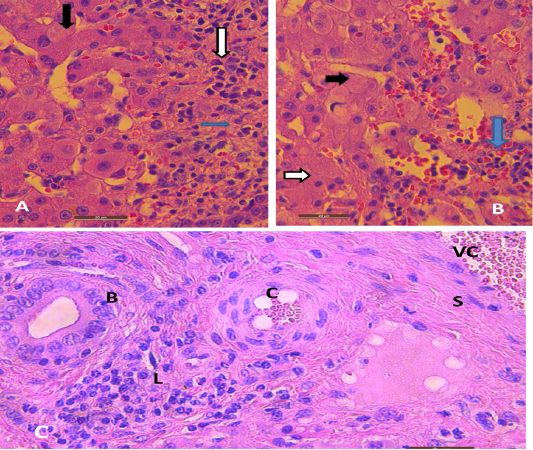
Liver of mice infected with hydatid cysts stained by hematoxylin-eosin. (A) Section depicts vacuolated hepatic cells expressing hydrophobic change (black arrow), necrosis (blue arrow), and Chronic infiltration of inflammatory cells (lymphocytes) (white arrow). (B) It shows vacuolation as reversible injury in hepatocytes (black arrow), necrosis (white arrow) and hemorrhage (blue arrow). (C) Illustrates bile duct (B), infiltration of lymphocytes(L), spindle shape fibroblasts (S), and vascular congestion (VC). A and B. Scale bar= 20µm, C. Scale bar= 2µm.
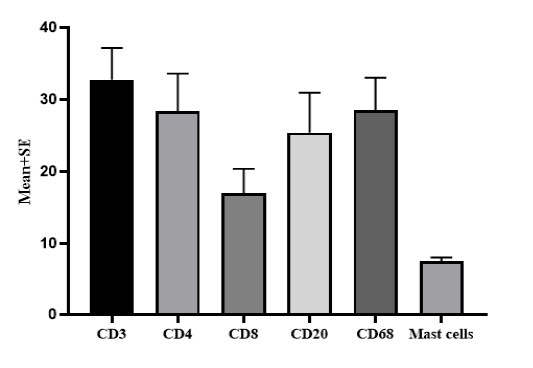
The Mice’s liver’s density of inflammatory cells and mast cells in Cystic Echinococcosis.

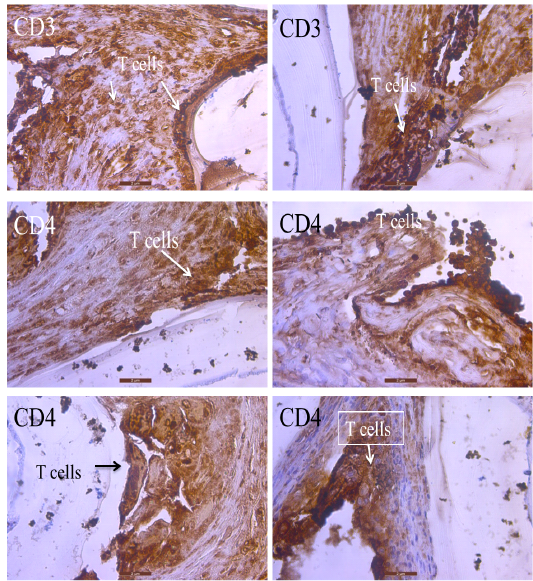
CD3. Localization of T lymphocytes by CD3 immunolabeled in the liver of infected mice. (40X). CD4. Show localization of T helper cells by CD4 immunolabeled in the liver of mice infected with hydatid cysts. (40X). Scale bar= 2µm
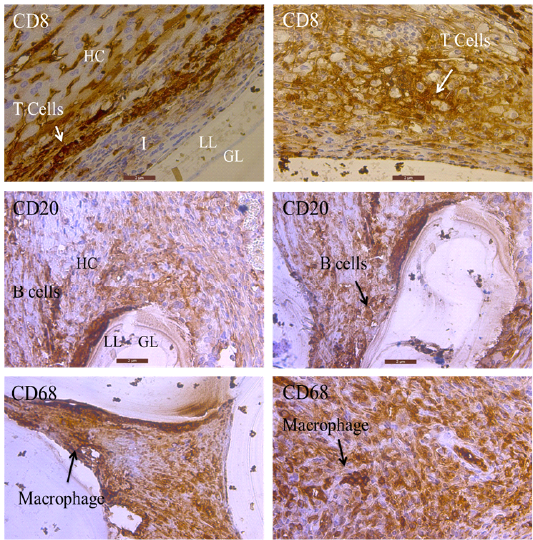
Hepatic tissue sections of infected mice. CD 8. Localization of killer T cell by CD8 immunolabeled. (40X). CD 20. Localization of memory cells by CD20 immunolabeled. CD 68. Macrophage by CD68 immunolabeled (40X). Scale bar= 2µm
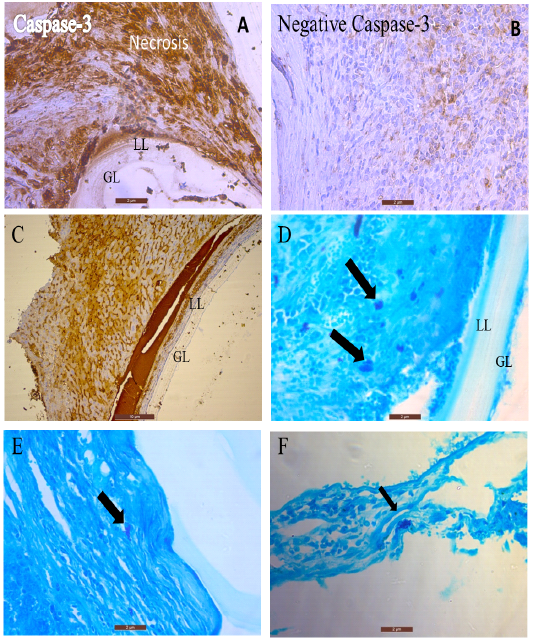
(A-C) Expression of caspase-3 by immunohistochemistry in mice liver with hydatid cyst (40X) (D-F) Section of mice liver presented mast cells stained with toluidine blue showing intracytoplasmic granules. (40X). Scale bar= 2µm


