

Identification of SET7/9-E2F1 as Novel Therapeutic Biomarkers in Hepatocellular Carcinoma


Identification of SET7/9-E2F1 as Novel Therapeutic Biomarkers in Hepatocellular Carcinoma
Lu Xie1,2,3,4,5, Ye Gu1,2,3,4, Qiang Liu1,2,3,4, Hongzhang Shen1,2,3,4, Yifeng Zhou1,2,3,4, Jiangfeng Yang1,2,3,4, Xiaofeng Zhang1,2,3,4* and Jinyu Huang1,5*
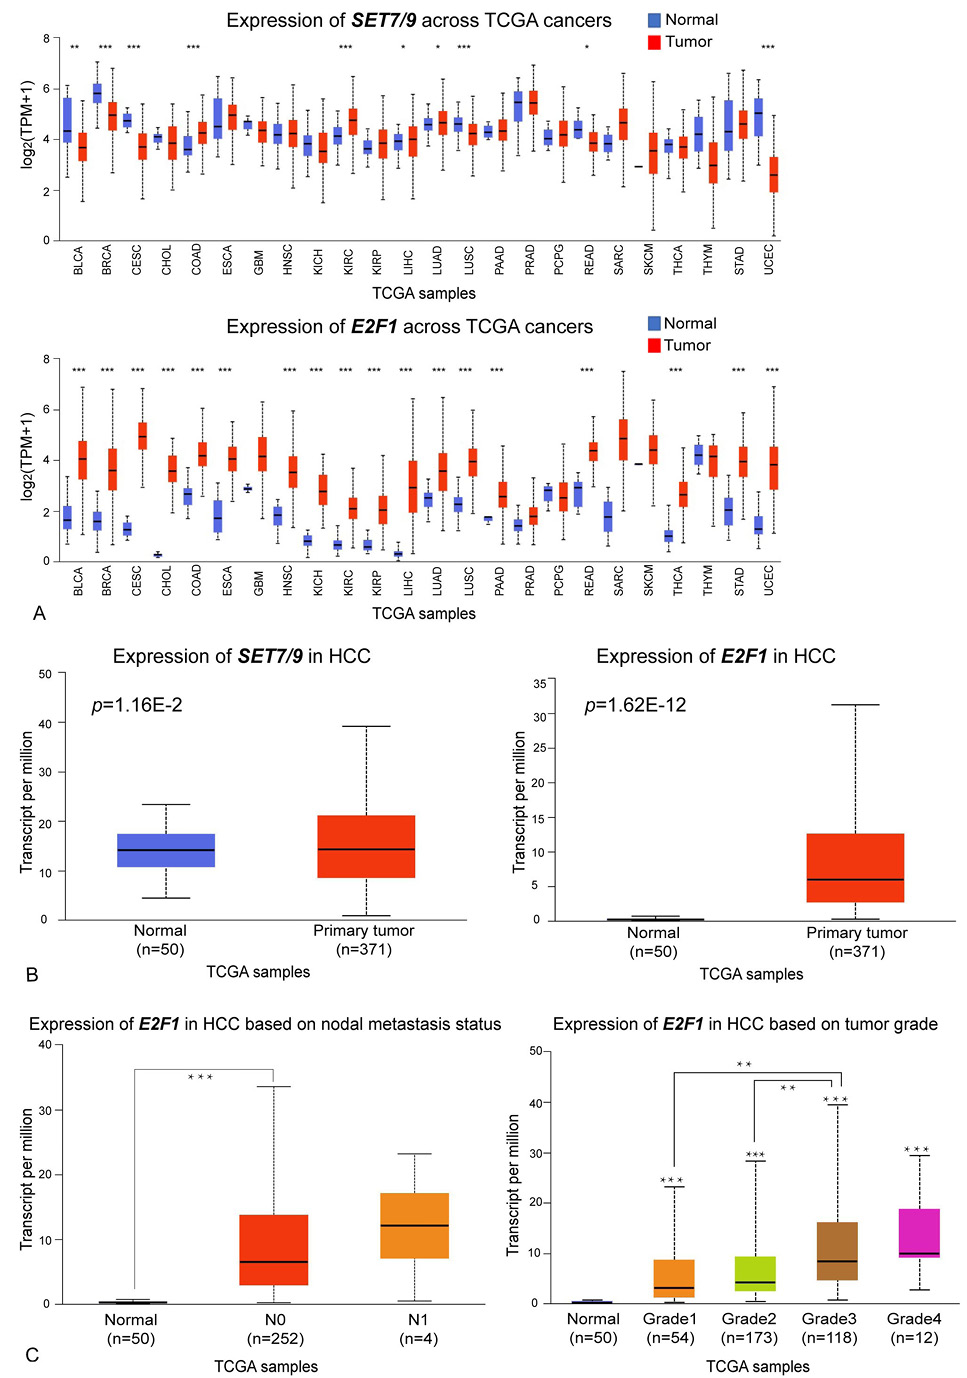
Expression analyses of SET7/9 and E2F1 in tumor and normal tissues. (A) The transcriptional levels of SET7/9 and E2F1 in tumor and normal tissues of different cancer types. (B) The transcriptional levels of SET7/9 and E2F1 in HCC tumor and normal tissues. (C) Correlation between the expression level of E2F1 and tumor grade and metastasis status of clinical HCC samples. The asterisks on each bar in the right panel indicate the statistical significance between samples with different levels of tumor grade and normal sample. *p<0.05, **p<0.01. ***p<0.001.
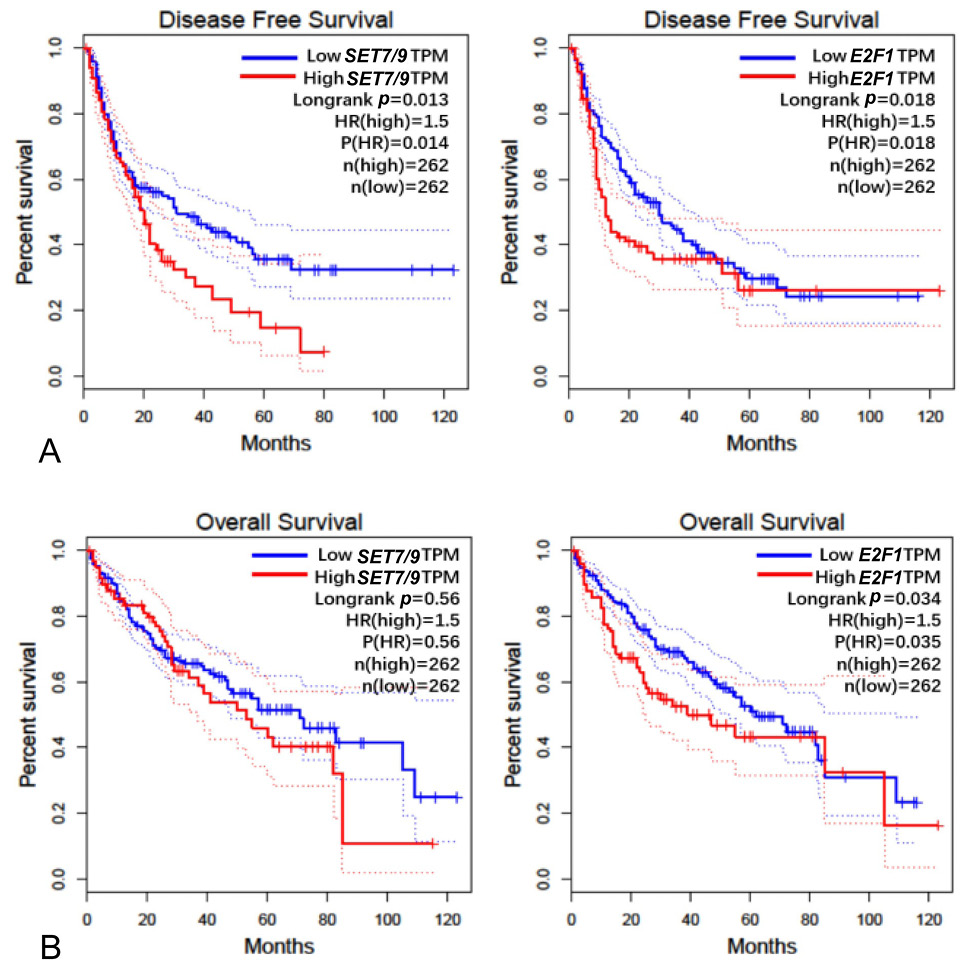
The disease-free survival curve (A) and overall survival curve (B) of SET7/9 and E2F1 in HCC. The number of samples from high-expression group and low-expression group and the relevant p values were indicated on the right corner of each panel.
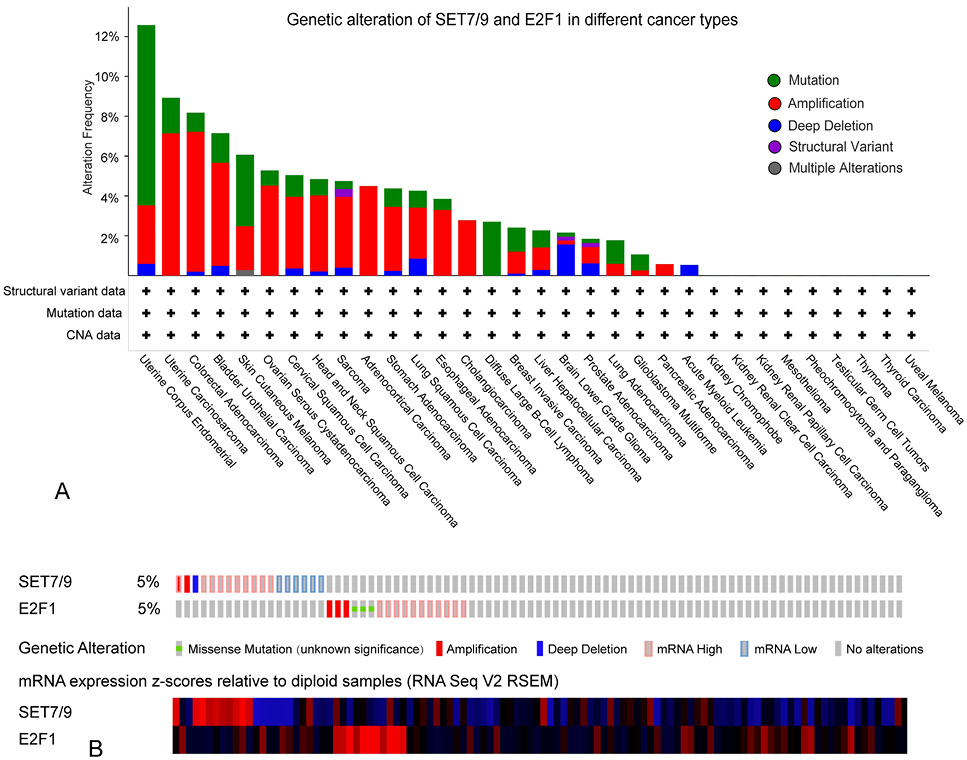
Genetic alteration of SET7/9 and E2F1. (A) Genetic alteration frequencies and alteration forms of SET7/9 and E2F1 detected in 9,896 clinical samples from 32 TCGA PanCancer Atlas Studies of different cancer types available from cBioPortal. (B) Genetic alteration and aberrant mRNA expression of SET7/9 and E2F1 in detected in a study involving 366 clinical samples of HCC. CNA, copy number aberration.

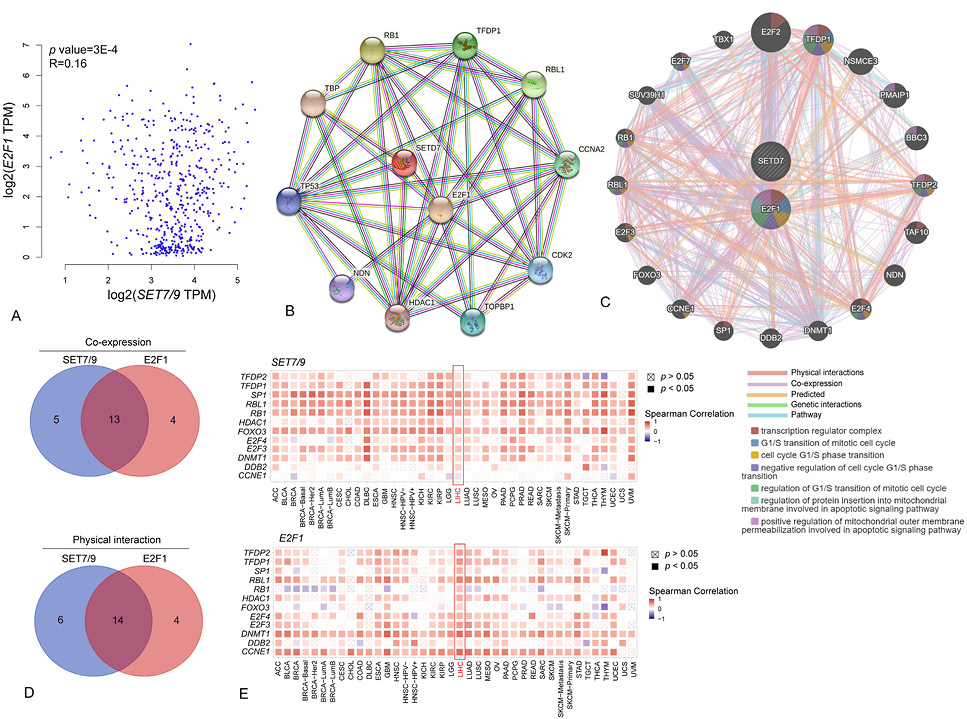
Co-expression and PPI network of SET7/9 and E2F1. (A) Correlation between SET7/9 and E2F1 mRNA expression levels in HCC. (B) Full STRING PPI network of SET7/9 and E2F1 based on the STRING database. The known interactors, predicted interactors as well as co-expressed functional partners of SET7/9 and E2F1 were shown. The colored lines linking two protein pairs indicate the type of protein-protein association. Blue, known interaction from curated databases; Purple, known interactions determined by experiment; Green, predicted interaction by gene neighborhood analysis; Black, co-expression. (C) Gene network of SET7/9 and E2F1 obtained from the GeneMANIA portal. The node colors indicate function of correlated genes/proteins and line colors indicate the type of protein-protein association. (D) Venn diagrams showing the intersection of proteins co-expressed with SET7/9 and E2F1 (upper panel) or physically interacted with SET7/9 and E2F1 (bottom panel) based on the results of network analyses using STRING and GeneMANIA. (E) Correlations between SET7/9 (upper panel) and E2F1 (bottom panel) with co-expressed genes in various cancer types. The heatmaps are presented according to the purity-adjusted partial spearman’s rho value as the degree of correlation.

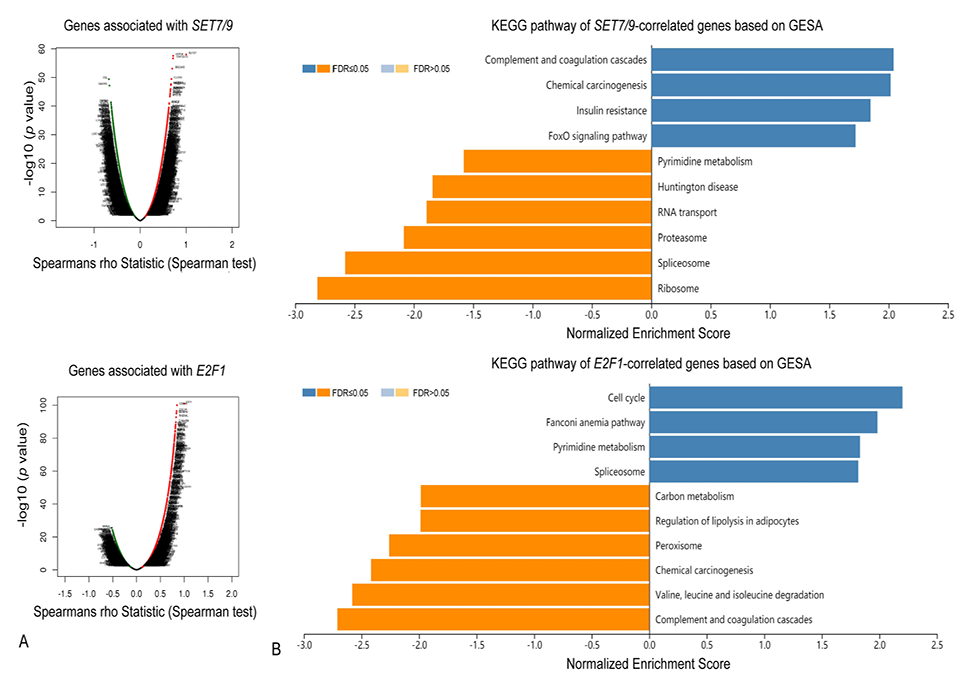
Enrichment analysis of SET7/9- and E2F1-correlated genes in HCC. (A) Genes positively (red) and negatively (green) correlated with SET7/9 and E2F1 in HCC identified by Spearman’s Correlation test of TCGA RNAseq data of 371 patients. (B) Top enriched KEGG pathways of SET7/9- and E2F1-correlated genes based on Gene Set Enrichment Analysis (GSEA). KEGG terms of positively and negatively correlated genes of SET7/9 and E2F1 are shown by blue and yellow bars, respectively.
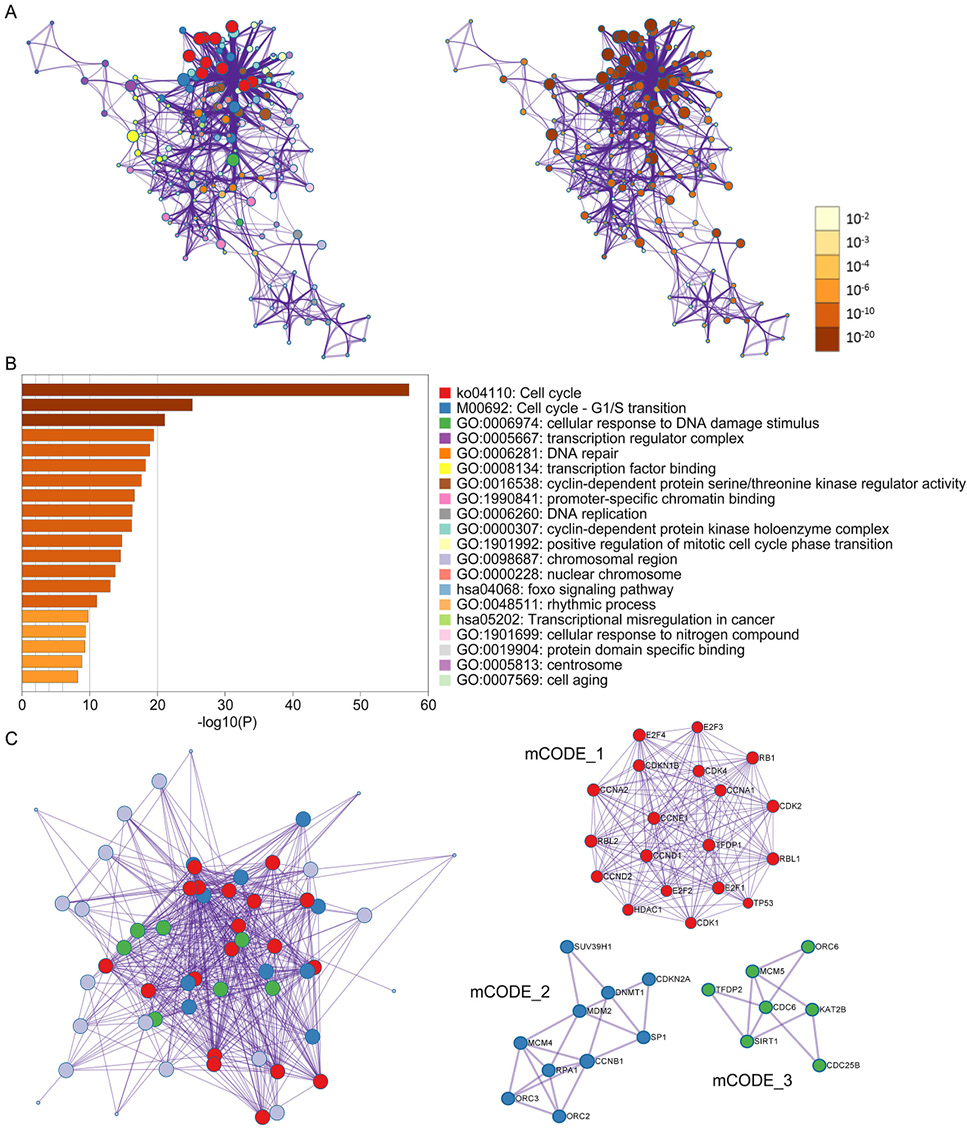
Enrichment analysis of SET7/9- and E2F1-correlated proteins in PPI network. (A) The cnetplot of KEGG and GO analysis of SET7/9- and E2F1-correlated proteins. The functional terms and relative q values of each node were shown in the left and right panel. (B) Top 20 enriched terms of proteins in the PPI network. (C) Clustering analysis using Cytospace-mCODE. The overall PPI network colored by different cluster and three clustered PPI networks were shown in the left and right panel. Red, proteins clustered to mCODE_1. Blue, protein clustered to mCODE_2. Green, proteins clustered to mCODE_3.


