
Histopathological Changes in Tomato (Lycopersicum esculentum L.) Plants Induced by the Infection of Fusarium oxysporum f. sp. lycopersici, the Cause of Tomato Wilt Disease


Histopathological Changes in Tomato (Lycopersicum esculentum L.) Plants Induced by the Infection of Fusarium oxysporum f. sp. lycopersici, the Cause of Tomato Wilt Disease
Maryam Yousaf1, Salman Ahmad1*, Romana Anjum2 and Muhammad Zeeshan Majeed3
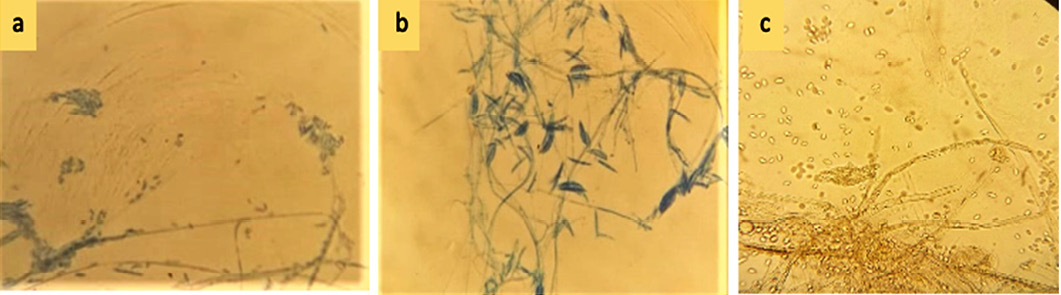
a) Microspores, b) Macrospores and c) Chlamydospores.
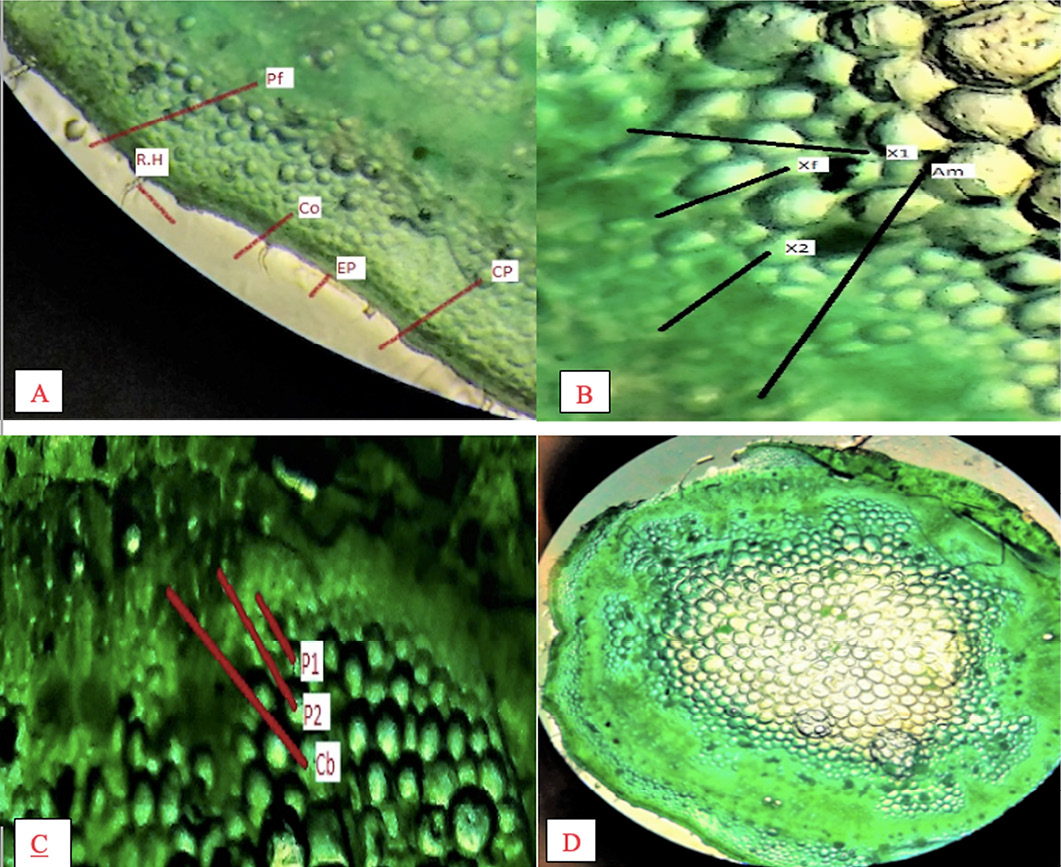
Staining of tomato plant parts; root and collar region with fast green and safranin. (A) presence of R.H, root hair; Co, collenchyma; Pf, periphloematic fibers; Ep, epidermis; Cp, cortical parenchyma;(B) X1, primary xylem; X2, secondary xylem; Xf, xylem fibers; Am, amyloplasts;(C) P1, primary phloem; P2, secondary phloem; Cb, cambium;(D) whole healthy root section.
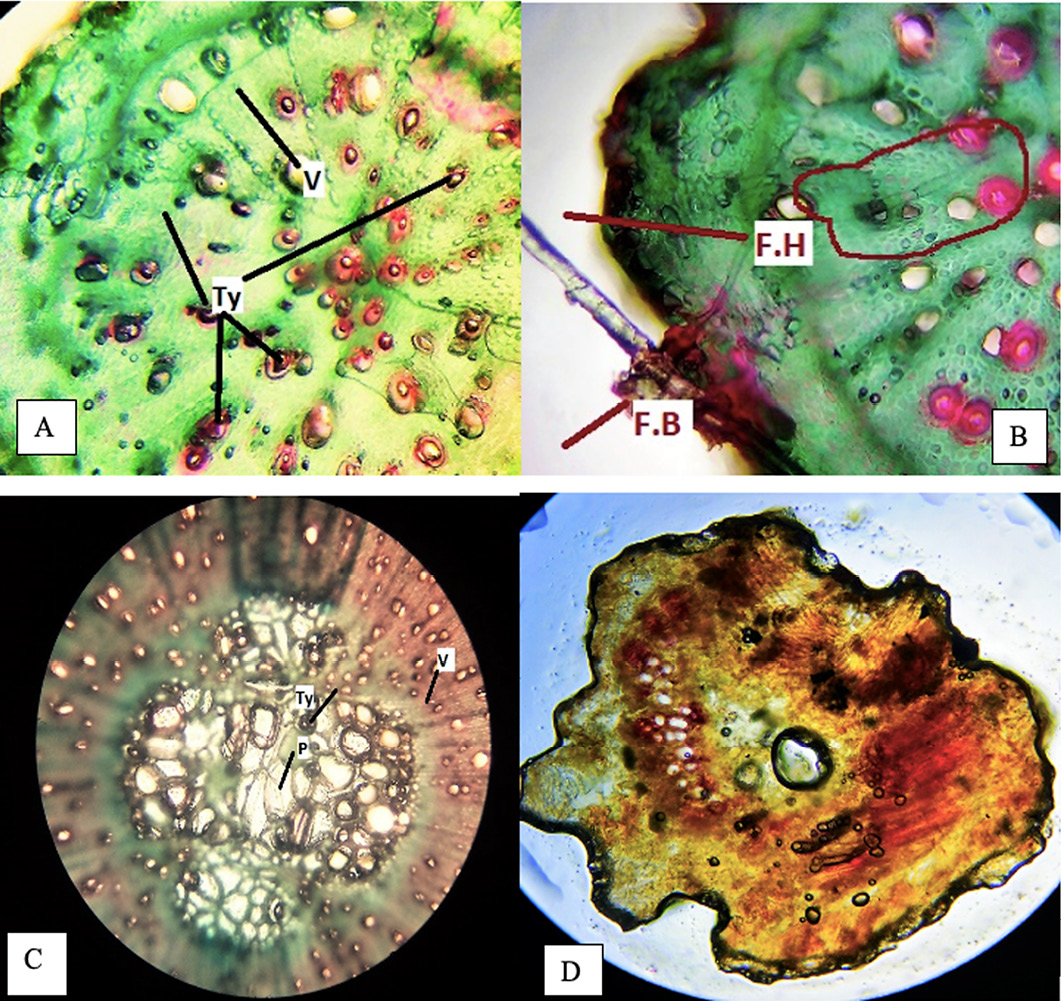
Diseased samples stained with fast green and safranin. (A) Ty; Tylosis formation starts and vascular bundles disperse. (B) fusarium hyphae emerge from the branch. (C) dispersion of vascular bundles, tylosis occurring and disturbing the phloem. (D) full disintegrated cell portions and death of plant.
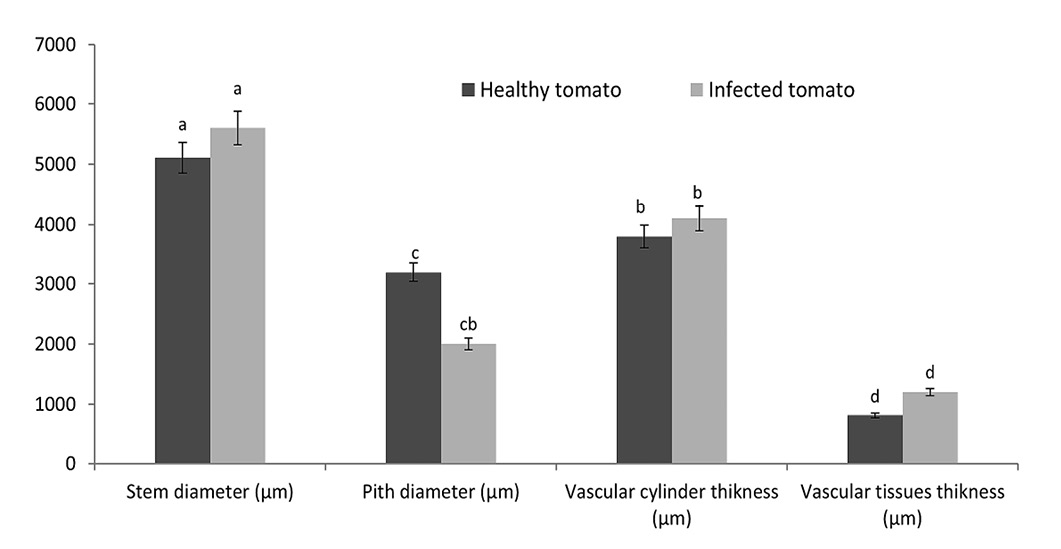
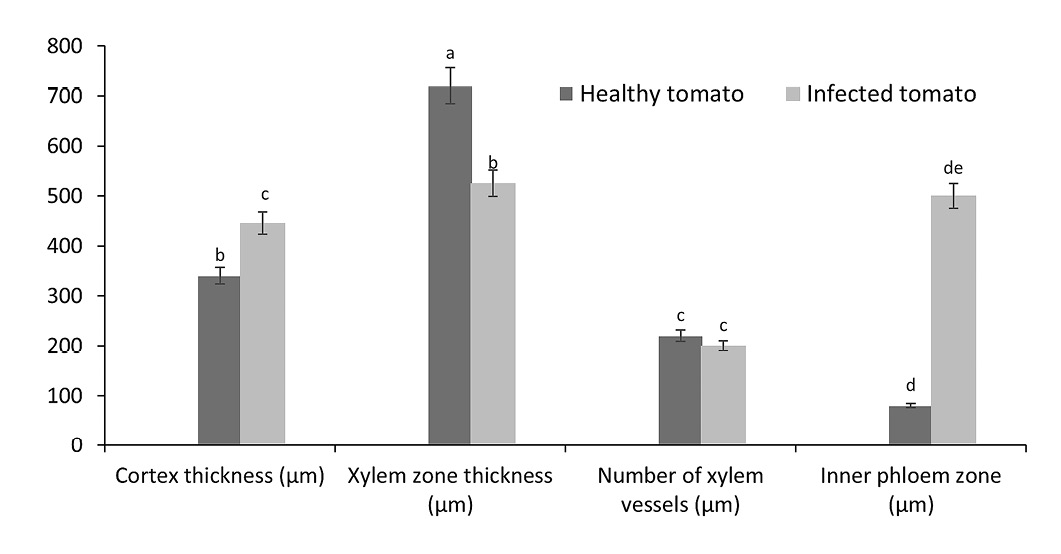
Comparison of plant parameters between healthy and diseased samples. Alphabets indicate statistical difference among treatments (factorial ANOVA; LSD test at α = 0.05).

Comparison of plant parameters between healthy and diseased samples. Alphabets indicate statistical difference among treatments (factorial ANOVA; LSD test at α = 0.05).
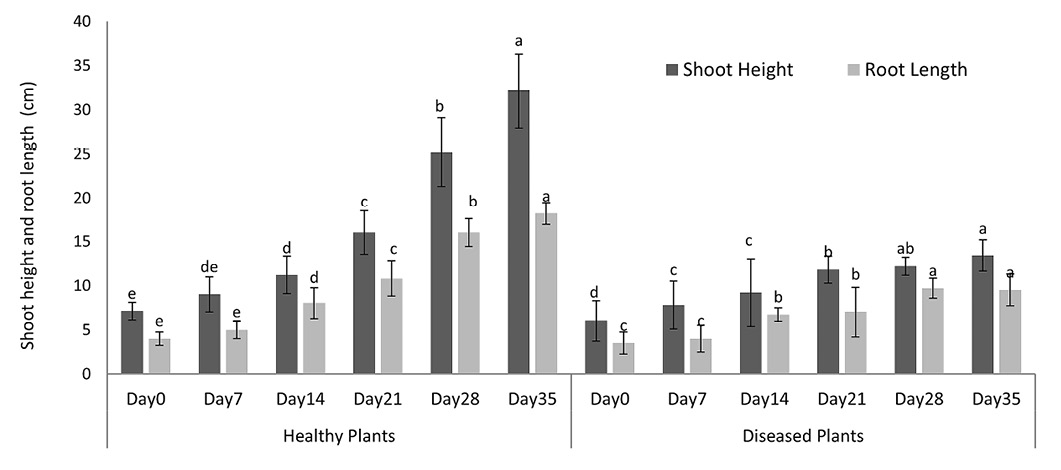
Comparison of shoot height and root length of healthy and diseased plants of tomato. Alphabets indicate statistical difference among treatments (factorial ANOVA; HSD test at α = 0.05)


