
Growth Performance, Biochemical, Antioxidant Status and Histopathology Changes of Clarias Gariepinus, Raised in a Biofloc Medium Utilizing Natural Carbon Sources


Growth Performance, Biochemical, Antioxidant Status and Histopathology Changes of Clarias Gariepinus, Raised in a Biofloc Medium Utilizing Natural Carbon Sources
Ikele*, Chika Bright, Ujunwa Aghaji, Mgbenka, Benard Obialo


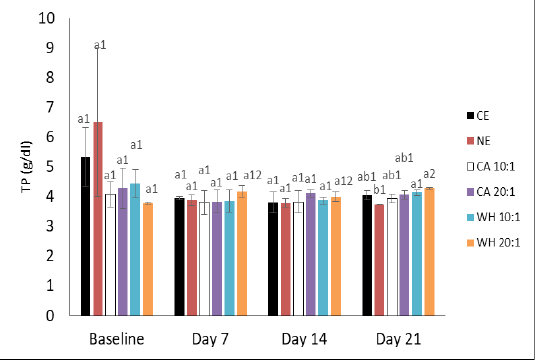
Changes in total protein under different BFT conditions.
Bars with different alphabet label were significantly different between the groups on days 7, 14 and 21(p < 0.05). Bars with different numeric superscript were not significantly different based on duration (p < 0.05).
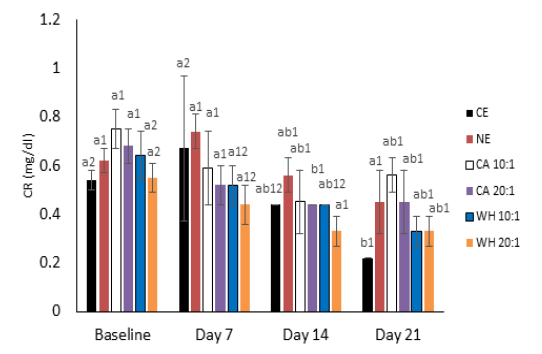
Changes in creatinine under different BFT conditions. Bars with different alphabet label were significantly different between the groups on days 7, 14 and 21(p < 0.05). Bars with different numeric superscript were not significantly different based on duration (p < 0.05).
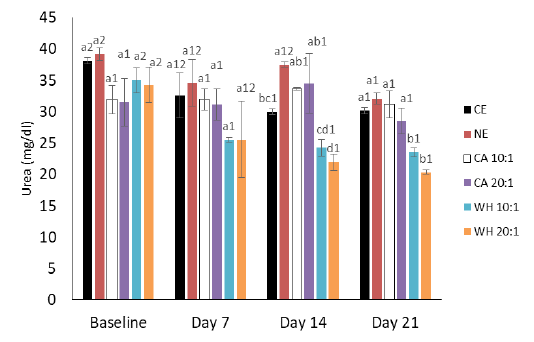
Changes in urea under different BFT conditions.
Bars with different alphabet label were significantly different between the groups on days 7, 14 and 21(p < 0.05). Bars with different numeric superscript were not significantly different based on duration (p < 0.05).

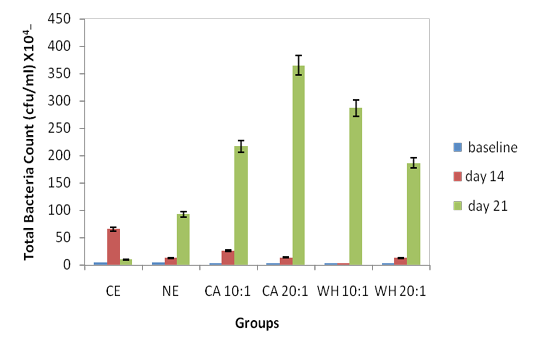
Total heterotrophic bacteria count (cfu/ml) in different biofloc tank

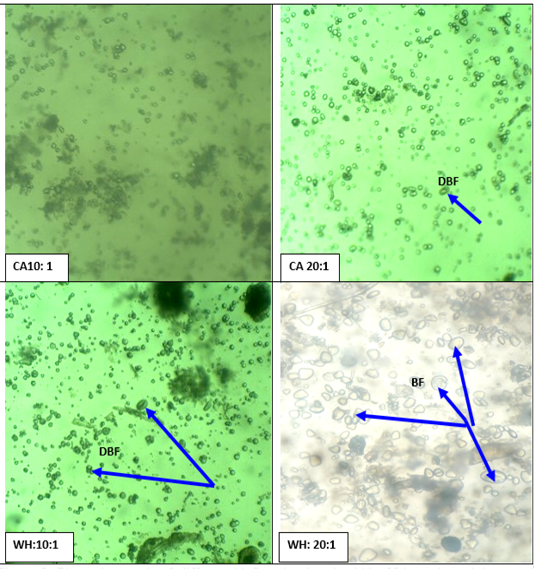
Photomicrograph of different biofloc developed within 28days showed increased macroaggregates biofloc size (BF) (blue arrow). Small developed bioflocs (DBF). Mag. X100.

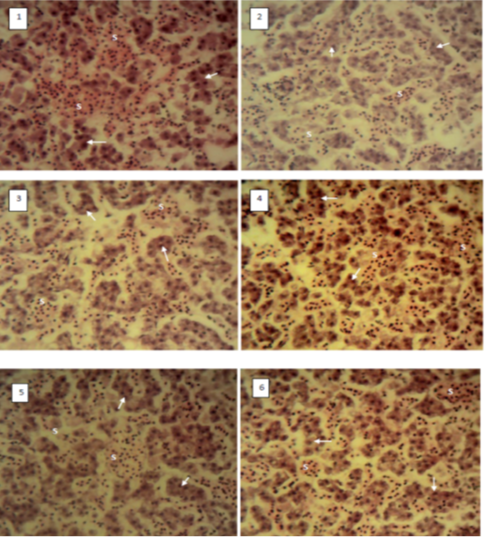
Photomicrograph of liver of C. gariepinus showed normal liver histology with presence of Sinusoid (S); Hepatic cord (arrow) in all the experimental groups before raised in biofloc; Groups 1 (CE), 2 (NE), 3 (CA 10:1), 4 (CA 20:1), 5 (WH 10:1) and 6 (WH 20:1). H&E x400.
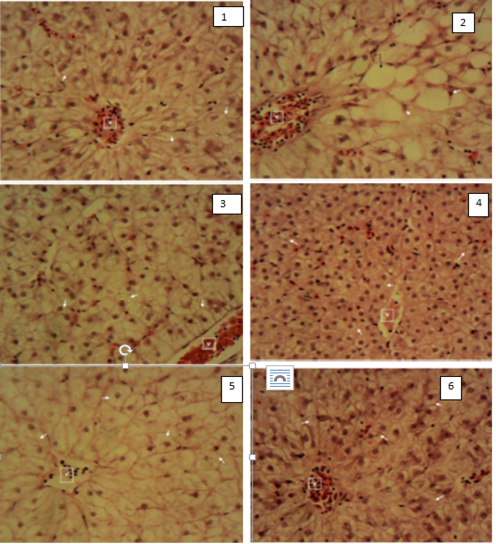
Photomicrograph of liver showed normal liver histology with presence of central vein (Cv) in all the experimental groups; Groups 1 (CE), 2 (NE), 3 (CA 10:1), 4 (CA 20:1), 5 (WH 10:1) and 6 (WH 20:1). H&E x400.
