

Genome Survey and Large-scale Isolation of Microsatellites through Illumina Sequencing from the Red Swamp Crayfish Procambarus clarkii


Genome Survey and Large-scale Isolation of Microsatellites through Illumina Sequencing from the Red Swamp Crayfish Procambarus clarkii
Xiao Zhang1, Guoqing Shen1, Yang Wang1, Pengdan Huang1,2, Yan Shui2, Zenghong Xu2 and Huaishun Shen1, 2*
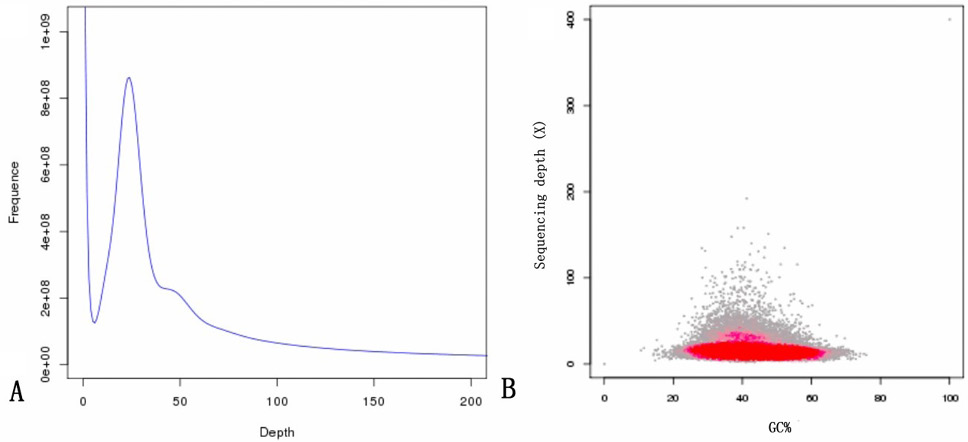
Results of a genomic survey using Illumina sequencing. (A), A K-mer (K=17) analysis to estimate the genome size of Procambarus clarkii. The x-axis is the depth (X); the Y-axis is the proportion that represents the frequency at that depth divided by the total frequency of all depths. (B), GC content and average sequencing depth. The X-axis represents the GC content, and the Y-axis represents the average depth. The red region represents the relatively dense part of the points in the scatter plot.

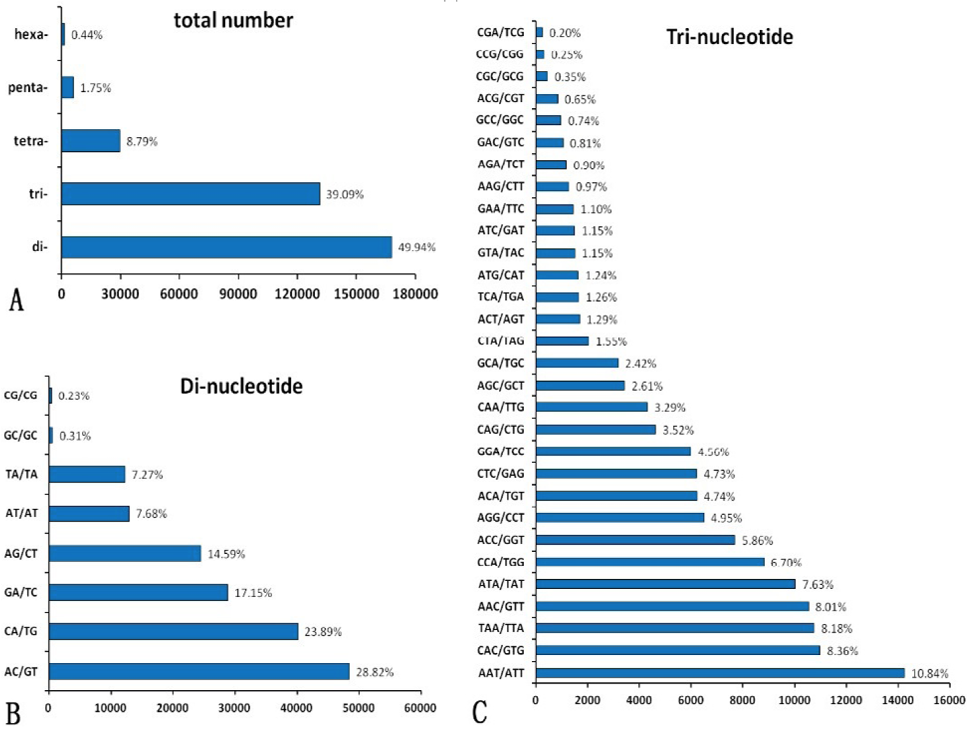
Distribution of SSR motifs in Procambarus clarkii. The Y-axis represents motif types and the X-axis represents the count of motifs in whole genome of Procambarus clarkii.
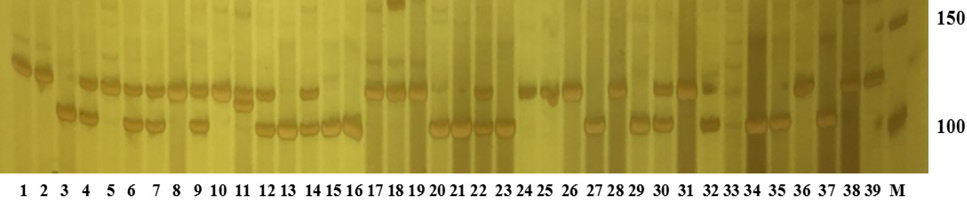
The amplification band of scaffold1946501 loci for 39 individuals of Procambrus clarkii. The M is Marker; 150 is 150 bp, and 100 is 100 bp.


