
Genetic Study of Cotton (Gossypium hirsutum L.) Genotypes for Different Agronomic, Yield and Quality Traits


Genetic Study of Cotton (Gossypium hirsutum L.) Genotypes for Different Agronomic, Yield and Quality Traits
Ehtisham Shakeel Khokhar1*, Amir Shakeel1, Muhammad Amir Maqbool1, Muhammad Waheed Anwar1, Zoraiz Tanveer1 and Muhammad Fahad Irfan2

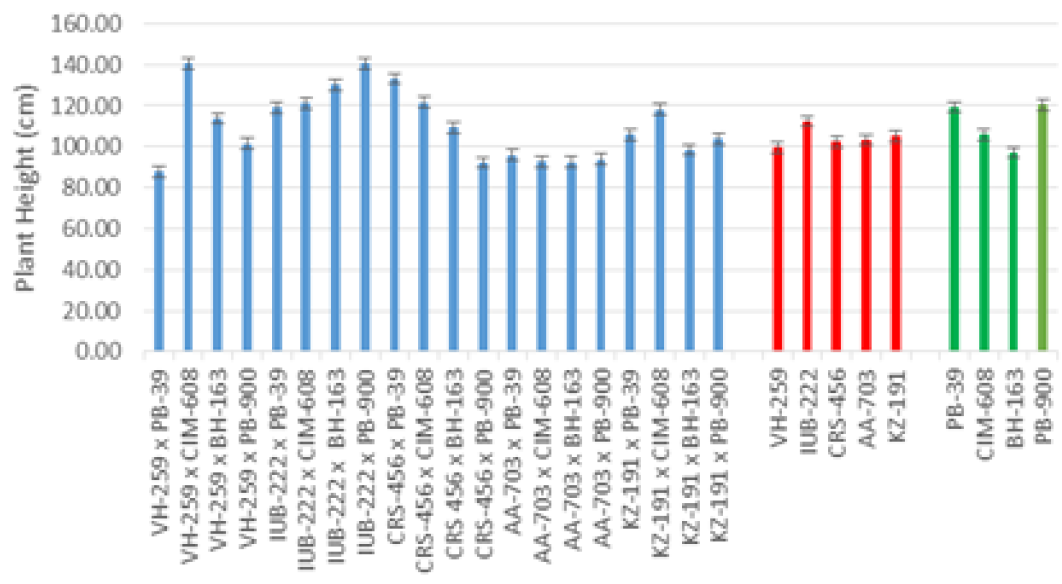
Bar graphs representing the mean values of Plant Height for crosses and parents (red bars are representing the female parents and green bars are representing male parents).

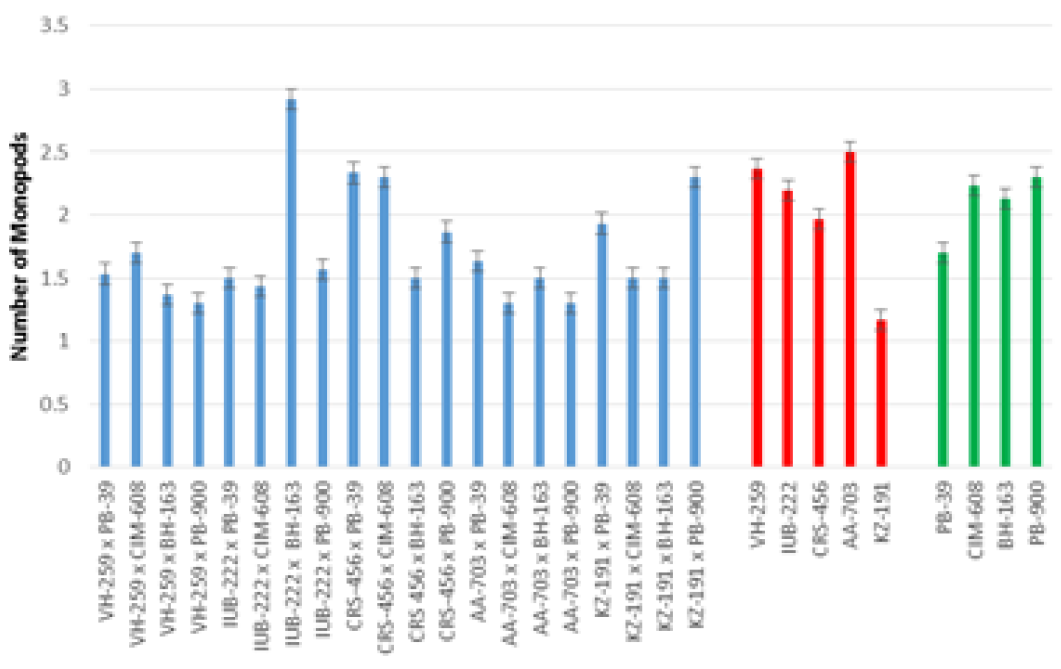
Bar graphs representing the mean values of Number of monopodial branches for crosses and parents (red bars are representing the female parents and green bars are representing male parents).

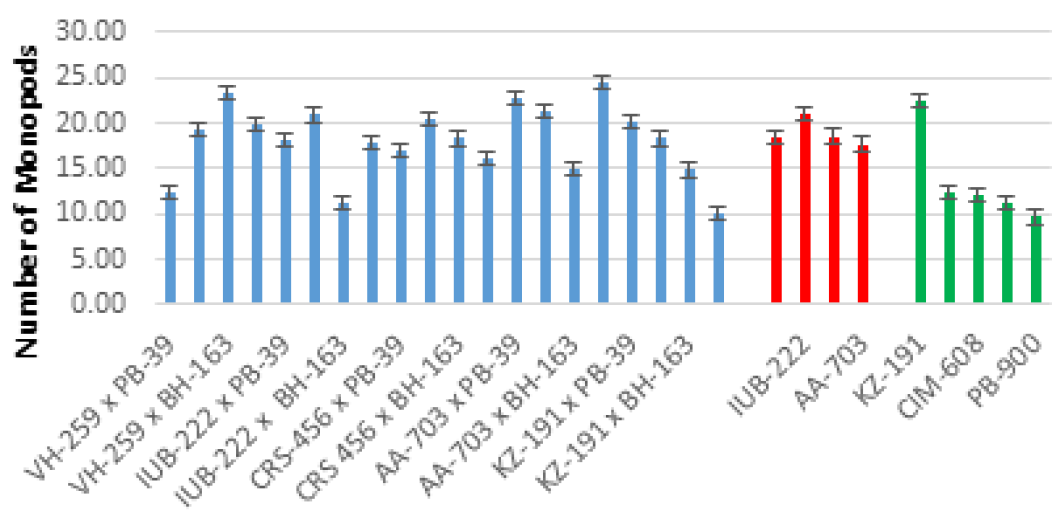
Bar graphs representing the mean values of Number of sympodial branches for crosses and parents (red bars are representing the female parents and green bars are representing male parents).

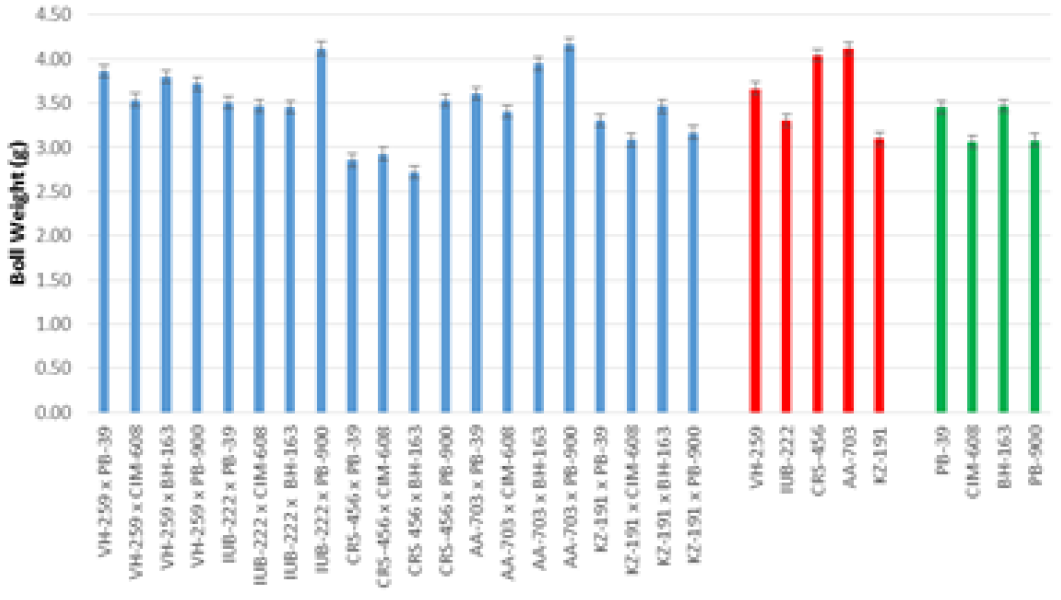
Bar graphs representing the mean values of Boll Weight (g) for crosses and parents (red bars are representing the female parents and green bars are representing male parents).
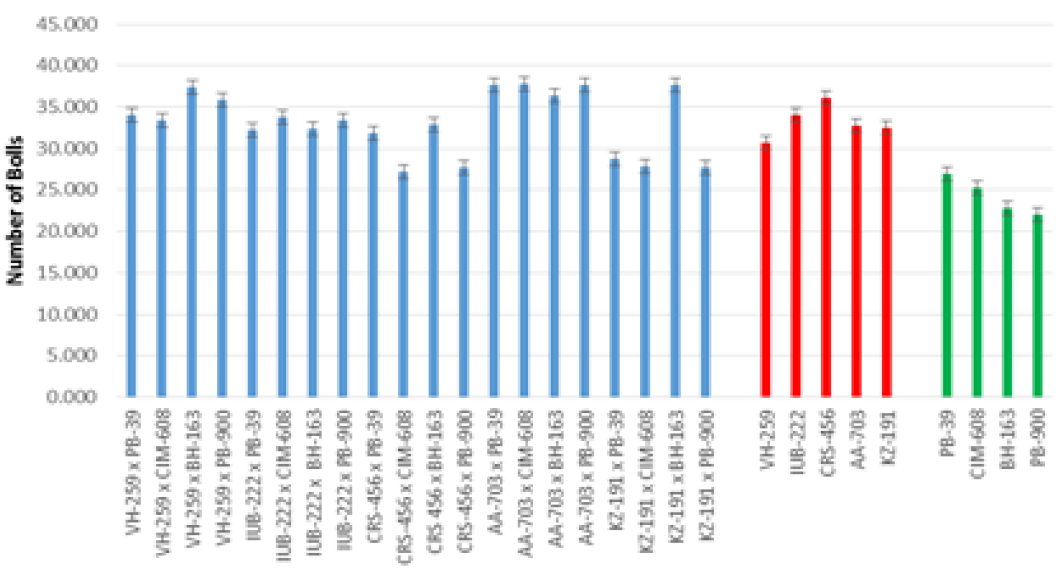
Bar graphs representing the mean values of Number of Bolls for crosses and parents (red bars are representing the female parents and green bars are representing male parents).

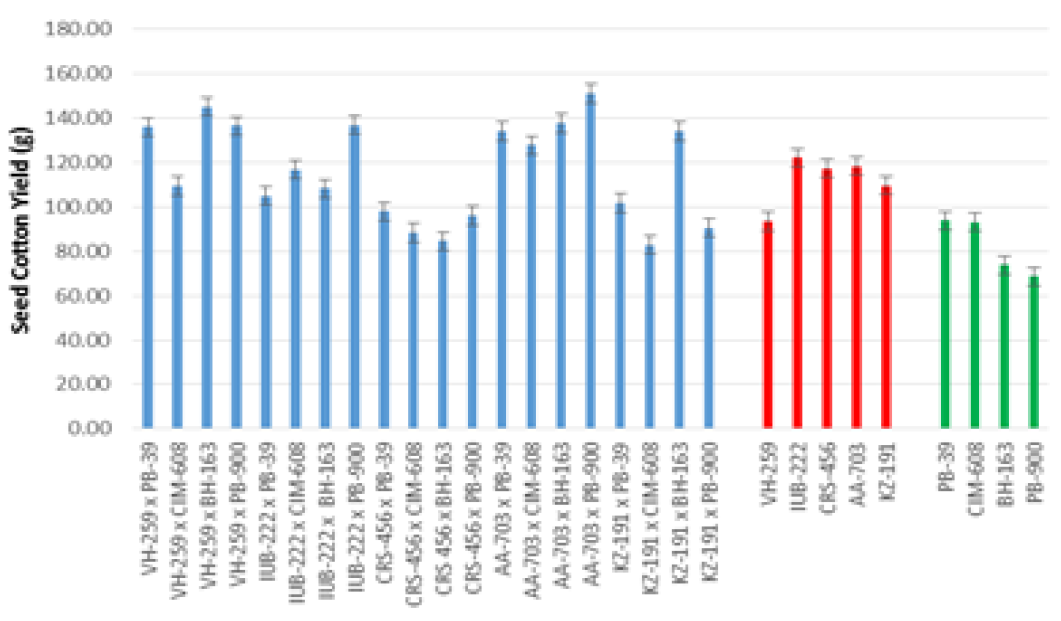
Bar graphs representing the mean values of Seed Cotton Yield (g) for crosses and parents (red bars are representing the female parents and green bars are representing male parents).
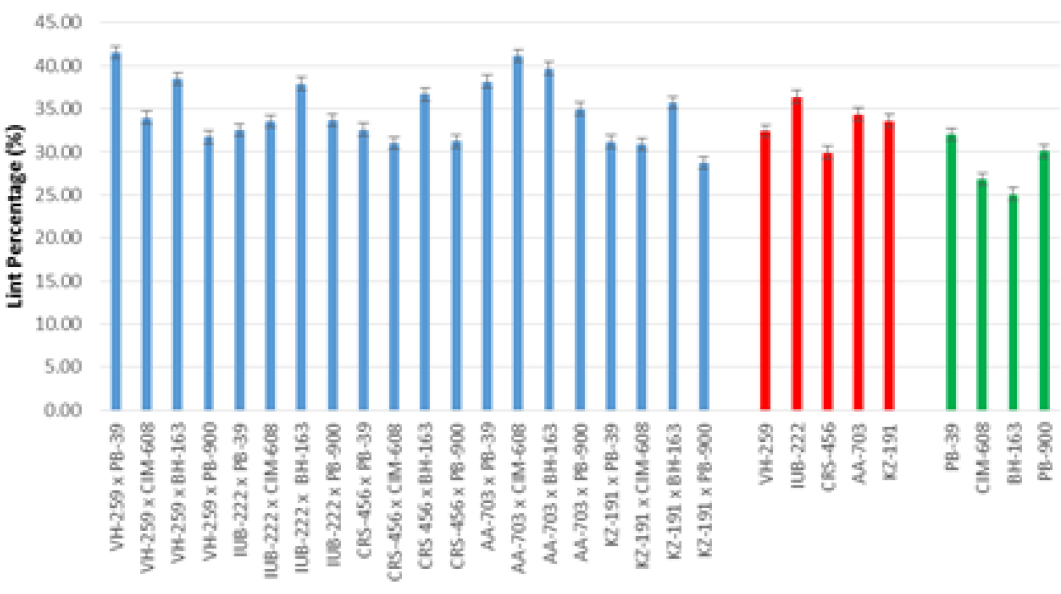
Bar graphs representing the mean values of Lint Percentage (%) for crosses and parents (red bars are representing the female parents and green bars are representing male parents).
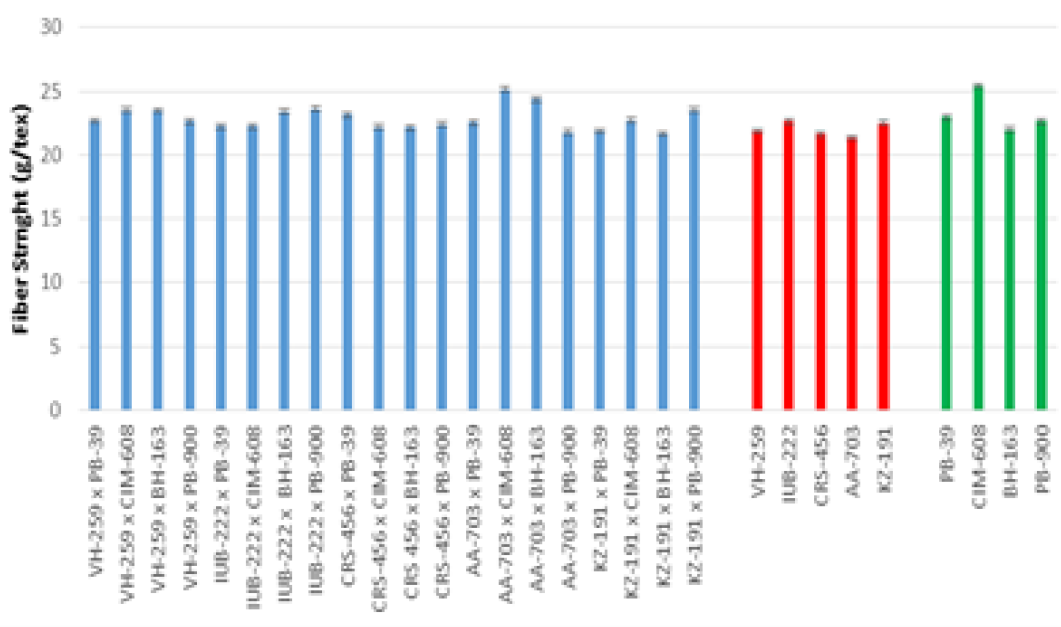
Bar graphs representing the mean values of Fibre Strength (g/tex) for crosses and parents (red bars are representing the female parents and green bars are representing male parents).

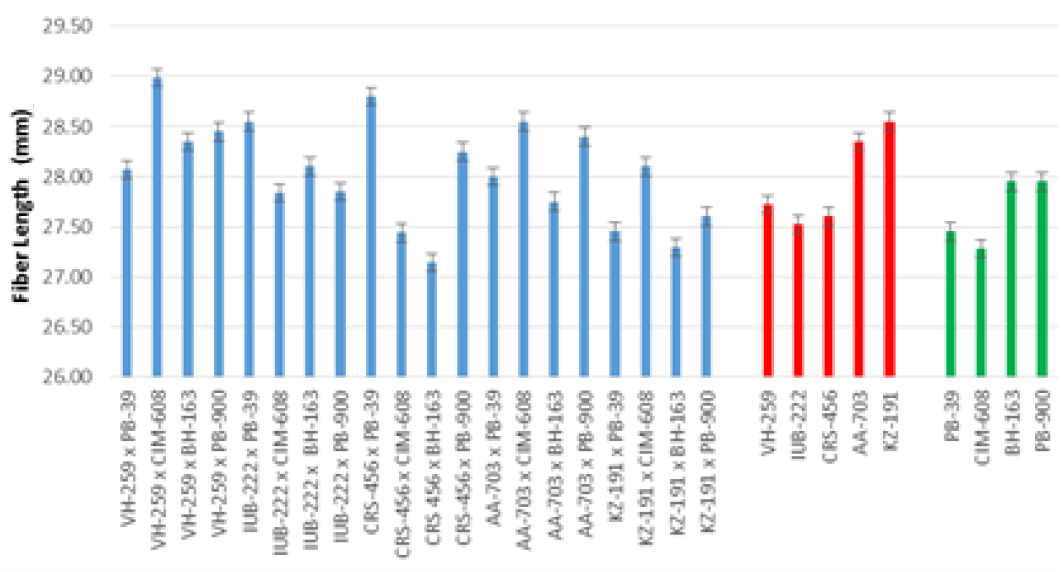
Bar graphs representing the mean values of Fiber Length (mm) for crosses and parents (red bars are representing the female parents and green bars are representing male parents).

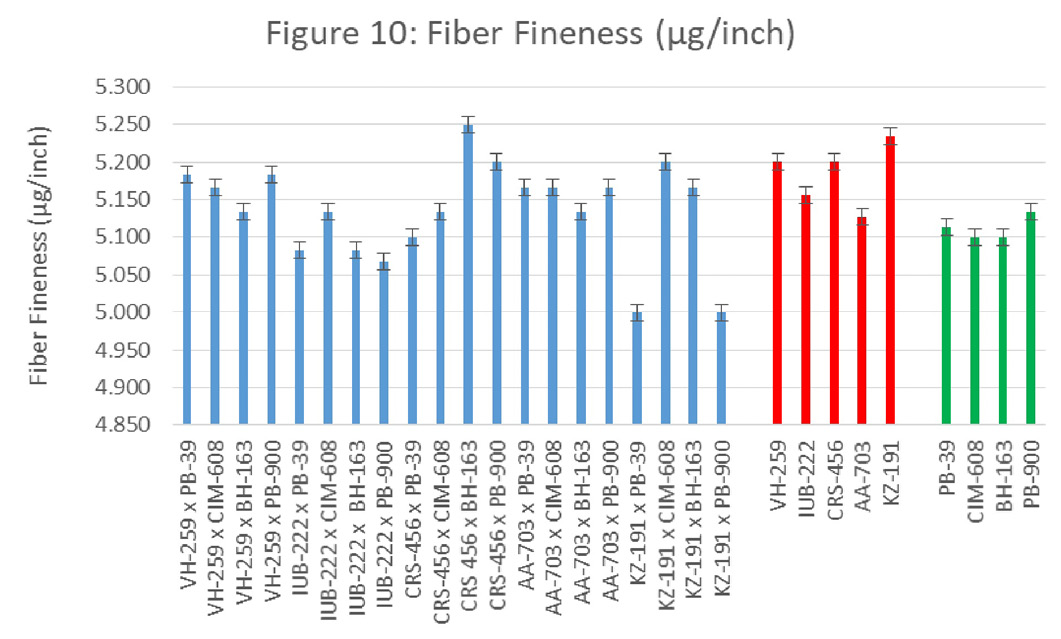
Bar graphs representing the mean values of Fiber Fineness (µg/inch) for crosses and parents (red bars are representing the female parents and green bars are representing male parents).


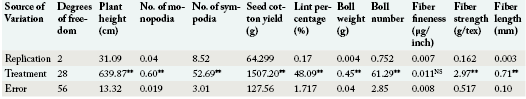
Analysis of variance (ANOVA) showing mean squares for various plant traits in upland cotton.

