
Forecasting Rapeseed and Mustard Production In Pakistan: A Time Series Approach


Research Article
Forecasting Rapeseed and Mustard Production In Pakistan: A Time Series Approach
Zahid Iqbal*, Farhat Ullah Khan and Jalal-ud-Din
Department of Statistics, Allama Iqbal Open University, Islamabad, Pakistan.
Abstract | The study is designed to forecast, production of rapeseed and mustard in Pakistan by using time series analysis. Among different appropriate models like (1,0,0), (1,0,1), and (2,0,0) it is based on Normalized Bayesian criterion (NBIC), Akaike information criterion (AIC), Hannan-Quinn and Schwarz Criterion that Autoregressive (AR) model (1,0,0) is best. The Brock, Dechert and Scheinkman (BDS) test is also applied on the residuals of model (1,0,0) for checking the linearity condition before forecasting. The forecasted values for the year 2016-17 to 2021-22 indicate an increasing trend in future of rapeseed and mustard production in Pakistan.
Received | December 03, 2019; Accepted | November 10, 2021; Published | March 11, 2022
*Correspondence | Zahid Iqbal, Associate Professor, Department of Statistics, Allama Iqbal Open University, Islamabad, Pakistan; Email: Zahid.iqbal@aiou.edu.pk
Citation | Iqbal, Z., F.U. Khan and J.U. Din. 2022. Forecasting rapeseed and mustard production in Pakistan: a time series approach. Sarhad Journal of Agriculture, 38(2): 578-584.
DOI | https://dx.doi.org/10.17582/journal.sja/2022/38.2.578.584
Keywords | Time series ARMA, Linearity, BDS test, rapeseed and mustard production, Forecast
Copyright: 2022 by the authors. Licensee ResearchersLinks Ltd, England, UK.
This article is an open access article distributed under the terms and conditions of the Creative Commons Attribution (CC BY) license (https://creativecommons.org/licenses/by/4.0/).
Introduction
In Pakistan, a large portion of population is using agriculture as profession. Human history in Pakistan is very old about more than five thousand years before Christ and The history of cultivation is also ancient. Now Pakistan country with a population of 220 million people and 38% of work force is used in agriculture (Pakistan Economics Survey 2018-19). If we look at the chart of import-export it is obvious that Pakistan spends a lot of money on the import of edible oil (Soybean and Palm). Pakistanis’ economy can be better position if it manages to decrease imports and increase its export. The demand for edible oil is increasing every year, due attention to this issue is needed. Pakistan Grows many type oil seeds crops, one of the important crops which is sown in Rabi season is rapeseed and mustard (Ali et al., 2015).
Rapeseed (Brassica napus) has beautiful bright and yellow flowers, belongs to the family of Brassicaceae which has many species. In world Rapeseed and Mustard is 3rd important crop (Jafar, 2016). Rapeseed and mustard have an old history in south Asia of more than 5000 years BC (Yan, 1990). Pakistan has a suitable environment for rapeseed and mustard crops, and it is sown in all provinces of Pakistan. In Pakistan, rapeseed and mustard are cultivated in both irrigated and un-irrigated areas due to many advantages of that crop.
The knowledge for future estimates is of much importance for planning and making fruitful decisions. In this study future estimate for rapeseed and mustard crop production in Pakistan is made by using the time series analysis. There is not much attention is given to oilseed crops, as a result, the area and production under the crop are decreased in Pakistan. To forecast the production of rapeseed and mustard we use the time series analysis approach. No doubt for forecasting purposes Box-Jenkins approach is very popular and is used in many studies. We use the BDS test for checking linearity condition in this study also before using the model for forecasting (Bisaglia and Gerolimetto, 2014).
The objectives of this study are;
- To develop appropriate modeling for production of Rapeseed & Mustard crop in Pakistan, which fulfill all prerequisite assumption of normality, stationary and linearity.
- To forecast the production of Rapeseed & Mustard crop in Pakistan.
Materials and Methods
Sources of data
The secondary data of production for rapeseed and mustard from 1947-48 to 2016-17 in Pakistan were retrieved from the website of agriculture marketing service, Punjab, Lahore.
Here we used Box-Jenkins ARIMA approach which is known as one of the reliable and well-recognized techniques for both model building and forecasting production of rapeseed & mustard.
For forecasting is one of the reasons for choosing ARIMA model is that it assumes nonzero autocorrelation between the values of data (Kumar and Anand, 2014). As we know the linear feature of the data can only be capture by ARIMA model, so it is necessary to check linearity condition.
We checked stationary of the series by different tests like as time plot, Correlogram, and unit root test. To remove problem of stationary we use the differencing techniques. We build the ARMA model after making the series stationary. Partial Autocorrelation Function (PACF) and Aut –Correlation Function (ACF) help us in choosing the order of the model. The diagnostic checking based on Akaike.
Information criteria (AIC), Bayesian Information Criteria (BIC). Then BDS test is applied to residuals from fitted linear ARIMA models to check Linearity.
Null hypothesis Ho: Series is linear
In the decade of 1980s, the BDS test was developed first time for testing the independence and identical distribution. And after more studies, it was investigated that it is very useful for checking linearity (Brock, 1991). If the null hypothesis for fitted model is rejected it means a nonlinear time series process.
The BDS test statistics can be calculated as, firstly as xtm = (x1, xt+1, …, xt-m-1) for t= 1,2,3,…, t-m for integer embedding dimension m greater than two. The correlation integral is then computed with ε distance of each other.
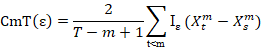
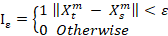
Where Iε is the indicator function.
BDS shows that the observed Xt are independent identical distribute d (iid) under the null hypothesis, then Cm,I (ε) – CI,t (ε)m with probability one as the sample size tends to infinity and ε tends to zero.
Brock et al. (1996) shows, the BDS test statistics as,
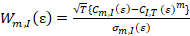
Where;
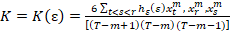
C = C1,T(ε)
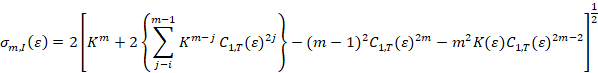
and

Because the BDS test is two-sided test at a 5% significance level the null hypothesis will be rejected, when |wm,I (ε)| > 1.96.
An overall test of joint hypothesis that all the autocorrelation coefficients (ρk) up to certain lags equal to zero, which can be done by Q Statistic by Box and Pierce.
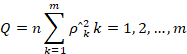
Where;
n: Sample size; m: Lag length; ρˆk: The autocorrelations of the estimated residuals.
The Q statistic for large sample is distributed as χ2 with m degree of freedom, we may reject Null hypothesis when calculated Q exceeds critical region value. A variant of Q statistics is Ljung Box (LB) statistics that are as follows.
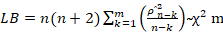
Q statistic and LB statistic follows χ2 distribution with m degree of freedom for large samples but for small sample properties, LB is more powerful (Broock et al., 1996).
Now after successful model testing of selected appropriate best fit ARIMA model, which is satisfying the linearity condition, is used for forecasting purpose.
Results and Discussion
Production of rapeseed and mustard for the period 1947-48 to 2014-15 is used for model building, and an appropriate ARMA model is tested for 2015-16 and 2016-17. Then forecasting for the year 2017-18 to 2021-22 is done.
In time series ARIMA modeling, we checked the stationary of the data production of rapeseed and mustard. We plot the time series as shown in Figure 1, which shows that the series is stationary.
To confirm the stationary condition Augmented Dickey-Fuller (ADF) test is used. Table 1 shows that as p-value=0.0044, so we will reject the Null hypothesis that the series has a unit root. Thus, the series is stationary at level.
Table 1: Unit root test for time series of production of rapeseed & mustard in Pakistan.
|
Null Hypothesis: Production of rapeseed & mustard has a unit root |
||||
|
Exogenous: Constant |
||||
|
Lag Length: 0 (Automatic - based on SIC, maxlag=10) |
||||
|
t-Statistic |
Prob.* |
|||
|
Augmented Dickey-Fuller test statistic |
-3.819688 |
0.0044 |
||
|
Test critical values: |
1% level |
-3.531592 |
||
|
5% level |
-2.905519 |
|||
|
10% level |
-2.590262 |
|||
|
*MacKinnon (1996) one-sided p-values. |
||||
Figure 2 helps us to confirm normality condition for the series, as the value of Jarque- Bera is 0.226896, and p-value 0.892751 suggests that the series is normal.
Hence, we can observe that the values of mean and median are about same, the value of kurtosis is 3 and skewness is also near zero. Which is desirable and thus series fulfills both prerequisite conditions of normality and stationary.
Correlogram is quite helpful to find out the appropriate values of autocorrelation (p) and partial autocorrelation (q). As shown in Table 2 the correlogram for the production of rapeseed and mustard in Pakistan shows first four values of the autocorrelation are crossing the limit after fourth value rest of the values are within the limits and in partial autocorrelation, only first value is crossing the limit. It is also clear from the correlogram that the series is stationary because most of the values are falling within the limits.
We can see in Table 3 that the coefficient of constant and autoregressive of order one are significant. The value of R square is 0.436119 and the value of adjusted R square is 0.418768, similarly, the value of Durbin Watson stat is 2.186352, which is quite reasonable. This all information suggests that the model (1,0,0) is appropriate.
In Table 4 we can observe the values of NBIC, AIC, Schwarz, and Hannan Quinn criterion for different appropriate three models. As in Table 4 we can see the values of AIC for AR model (1,0,0) and ARMA model (1,0,1) are same. On the other hand NBIC, Schwarz and Hannan-Quinn criterion values of the model (1,0,0) are least. Thus the AR (1,0,0) model is best as compared to the models (1,0,1) and (2,0,0) on the basis of NBIC, AIC, Schwarz, and Hannan Quinn criterion.
After choosing the best appropriate AR model (1,0,0), now we will check its normality condition for its residuals. In Figure 3, histogram is shown and the p-value 0.527933 suggests that the normality condition is satisfied.
Table 3: ARMA (1,0,0)
|
Dependent Variable: Pakistan |
||||
|
Method: ARMA Maximum Likelihood (OPG - BHHH) |
||||
|
Date: 12/30/19 Time: 06:54 |
||||
|
Sample: 1 68 |
||||
|
Included observations: 68 |
||||
|
Convergence achieved after 6 iterations |
||||
|
Coefficient covariance computed using outer product of gradients |
||||
|
Variable |
Coefficient |
Std. Error |
t-Statistic |
Prob. |
|
C |
224.9976 |
9.646543 |
23.32417 |
0.0000 |
|
AR(1) |
0.661907 |
0.095815 |
6.908164 |
0.0000 |
|
SIGMASQ |
771.8733 |
144.4131 |
5.344896 |
0.0000 |
|
R-squared |
0.436119 |
Mean dependent var |
226.7882 |
|
|
Adjusted R-squared |
0.418768 |
S.D. dependent var |
37.27316 |
|
|
S.E. of regression |
28.41651 |
Akaike info criterion |
9.583410 |
|
|
Sum squared resid |
52487.38 |
Schwarz criterion |
9.681330 |
|
|
Log-likelihood |
-322.8359 |
Hannan-Quinn criter. |
9.622209 |
|
|
F-statistic |
25.13623 |
Durbin-Watson stat |
2.186352 |
|
|
Prob(F-statistic) |
0.000000 |
|||
|
Inverted AR Roots |
.66 |
|||
Table 4: Goodness of fit tests.
|
Model |
Normalized BIC |
AIC |
Schwarz |
Hannan-Quinn |
|
(1,0,0) |
6.83 |
9.58 |
9.68 |
9.62 |
|
(1,0,1) |
6.87 |
9.58 |
9.71 |
9.63 |
|
(2,0,0) |
6.88 |
9.59 |
9.72 |
9.64 |
Autocorrelation function (ACF) and Partial Autocorrelation Function (PACF) of the residuals are for the AR model (1,0,0) are shown in Figure 4. It is quite clear that all the residuals are within the bounds.
Table 5: Model statistics for (1,0,0).
|
Model |
Number of Predictors |
Model Fit statistics |
Ljung-Box Q(18) |
Number of Outliers |
||
|
Normalized BIC |
Statistics |
DF |
Sig. |
|||
|
Prod of Rapeseed & Mustared Model (1,0,0) |
0 |
6.826 |
17.909 |
17 |
.395 |
0 |
Table 6: BDS test for residuals of (1,0,0) model for production of rapeseed & mustard in Pakistan.
|
BDS Test for RESID |
|||||
|
Date: 12/30/19 Time: 07:58 |
|||||
|
Sample: 1 68 |
|||||
|
Included observations: 68 |
|||||
|
Dimension |
BDS Statistic |
Std. Error |
z-Statistic |
Prob. |
|
|
2 |
-0.006524 |
0.007360 |
-0.886366 |
0.3754 |
|
|
3 |
-0.004953 |
0.011783 |
-0.420386 |
0.6742 |
|
|
4 |
-0.000392 |
0.014130 |
-0.027737 |
0.9779 |
|
|
5 |
0.000932 |
0.014831 |
0.062824 |
0.9499 |
|
|
6 |
0.001862 |
0.014402 |
0.129273 |
0.8971 |
|
|
Raw epsilon |
41.59997 |
||||
|
Pairs within epsilon |
3266.000 |
V-Statistic |
0.706315 |
||
|
Triples within epsilon |
166336.0 |
V-Statistic |
0.529005 |
||
|
Dimension |
C(m,n) |
c(m,n) |
C(1,n-(m-1)) |
c(1,n-(m-1)) |
c(1,n-(m-1))^k |
|
2 |
1061.000 |
0.479873 |
1542.000 |
0.697422 |
0.486397 |
|
3 |
704.0000 |
0.328205 |
1487.000 |
0.693240 |
0.333159 |
|
4 |
477.0000 |
0.229327 |
1440.000 |
0.692308 |
0.229719 |
|
5 |
324.0000 |
0.160714 |
1397.000 |
0.692956 |
0.159783 |
|
6 |
212.0000 |
0.108551 |
1345.000 |
0.688684 |
0.106689 |
To confirm whether time series is white noise, for this purpose we calculate Ljung Box Q statistics = 17.909 in Table 5. This leads us that the series is stationary, and the model is best fit. Before moving toward forecasting we first check the linearity condition of the residuals for the model (1,0,0) also.
The BDS test is applied on the residuals of model (1,0,0) for checking linearity condition as shown in Table 6. All the p values for each dimension are greater than 0.05, this leads us that we don’t reject null hypothesis. Thus we can conclude that the series is linear. Now we can use this model for forecasting.
As we use 68 years for model building, two years for cross-validation, and next five years for forecasting. In Table 7 cross-validation and forecasted values are shown. The information contained in Table 7 leads us to conclude that the production of rapeseed and mustard crops in Pakistan will increase in future.
We can see observed, fitted, and forecasted values in Figure 5, the model fits well, and forecasted values shows an increasing trend in the production of rapeseed and mustard in Pakistan.
Table 7: Cross validated and forecasted values for production of rapeseed & mustard in Pakistan.
|
Year |
Actual |
Predicted |
|
2015-16 |
194 |
218.9 |
|
2016-17 |
180.4 |
221.0 |
|
2017-18 |
N.A |
222.3 |
|
2018-19 |
N.A |
223.2 |
|
2019-20 |
N.A |
223.8 |
|
2020-21 |
N.A |
224.2 |
|
2021-22 |
N.A |
224.5 |
Conclusions and Recommendations
We tried to forecast the production of rapeseed and mustard crops in Pakistan by time series analysis. The NBIC, AIC, Schwarz, and Hannan-Quinn criterion are used to choose the best appropriate model (1,0,0). We fullfill all prerequisite assumptions of the statistical Techniques. We use the BDS test to check the linearity of the residuals of the model (1,0,0) in this study also. After that, the model (1,0,0) is used for forecasting the production of rapeseed and mustard crops in Pakistan and increasing trend is concluded.
While using Box Jenkins methodology beside satisfying normality and stationary conditions, linearity of the residuals should be satisfied before using the model for forecasting purpose. By using approved quality of seed and modern ways of cultivation we can get more production from rapeseed and mustard crop as compared to the past.
Novelty Statement
Linearity is one of the basic assumption of regression which is normally ignored and did not checked in residuals of chosen appropriate model.
Author’s Contribution
Zahid Iqbal: Analysed the data and results and wrote the manuscript.
Farhat Ullah Khan: Provided professional review as an agriculturist and improved the paper.
Jalal-ud-Din: Reviewed and corrected the manuscript.
Conflict of interest
The authors have declared no conflict of interest.
References
Ali, S., Badar, N. and Fatima, H. 2015. Forecasting production and yield of sugar cane and cotton crops of Pakistan for 2013-2030. Sarhad J. Agric., 31(1): 1-9.
Bisaglia, L. and Gerolimetto, M. 2014. Testing for (non) linearity in economic time series: a Monte Carlo comparison (Working Paper Series, N. (3)).
Broock, W.A., Scheinkman, J.A., Dechert, W.D. and LeBaron, B. 1996. A test for independence based on the correlation dimension. Econ. Rev., 15(3): 197-235. https://doi.org/10.1080/07474939608800353
Clement, E.P. 2014. Using normalized bayesian information criterion (BIC) to improve box-jenkins model building. Am. J. Math. Stat., 4(5): 214-221.
Government of Punjab, Agricultural marketing information service Lahore (www.amis.pk).
Gujarati, D.N. and Porter, D.C. 2009. Basic Econometrics 5th edition. McGraw Hill. Higher Education: New Dehli, India.
Islam, T., Mohib, A.A. and Haque, S.Z. 2017. Econometric models for forecasting remittances of Bangladesh. Bus. Manage. Stud., 4(1): 1-9. https://doi.org/10.11114/bms.v4i1.2860
Jaffar, A.H., Maqsood, H., Sarwat, Z., Muhammad, A., Habib, A. and Muhammad, A.I. 2016. Estimating the technical efficiency in rapeseed and mustard production: a case study of District Okara. Germany J. Agric. Econ., 54(4): 801-811.
Kumar, M. and Anand, M. 2014. An application of time series ARIMA forecasting model for predicting sugarcane production in India. Stud. Bus. Econ., 9(1): 81-94.
Mithiya, D., Datta, L. and Mandal, K. 2019. Time Series Analysis and Forecasting of Oilseeds Production in India: Using Autoregressive Integrated Moving Average and Group Method of Data Handling–Neural Network. Asian J. Agric. Ext. Econ. Soc., 30(2): 1-14. https://doi.org/10.9734/ajaees/2019/v30i230106
Yan, Z. 1990. Overview of rapeseed production and research in China. In Proceedings of the International Canola Conference Potash and Phosphate Institute, Atlanta, Georgia (pp. 29-35). Retrieved From https://idl-bnc-idrc.dspacedirect.org/bitstream/handle/10625/19116/IDL-19116.pdf?sequence=1
Zhang, H., Miao, H., Wang, L., Qu, L., Liu, H., Wang, Q. and Yue, M. 2013. Genome sequencing of the important oilseed crop Sesamum indicum L. Genome Biol., 14(1): 401. https://doi.org/10.1186/gb-2013-14-1-401
To share on other social networks, click on any share button. What are these?


