
Evaluation of Field Pea (Pisum sativum L.) Varieties for Yield and Yield-Related Traits


Research Article
Evaluation of Field Pea (Pisum sativum L.) Varieties for Yield and Yield-Related Traits
Gudeta Nepir Gurmu, Tade Bitima Mulisa, Alemu Lenco Gemechu, Kegna Gadisa Amena and Gemechu Nedi Terfa*
Department of Plant Science, School of Agriculture, Ambo University, Mamo Mezemir Guder Campus, P.O.Box,19, Ambo, Ethiopia.
Abstract | Field pea (Pisum sativum L.) is one of the leguminous crops that is rich in protein and essential amino acids. A field experiment was conducted during the 2019 cropping season consisting of eight (Bursa, Burkitu, Adi, Herena, Hortu, Letu, T/shaman, and Weyib) improved field pea varietiesand one local variety at west Showa zone Oromia region to identify high yielding varieties. The experiment was carried out using a randomized complete block design with two replications at Babich, Goda Hora, Chelia Rafiso Alenga, EjersaLafo, and Goromti locations. Data on yield and yield-related traits such as harvest index, above-ground biomass, number of seed per pods, and hundred seed weights were recorded. Analysis of variance combined over five locations manifested significant differences among varieties, environment, environment, and varieties interaction for grain yield and other yield-related traits. The combined mean of grain yield of varieties indicated that Bursa (3.03 t/ha), Adi (2.84t/ha) and Weyib (2.83 t/ha) varieties had the highest grain yield advantage over the other tested varieties without significant difference among the order, whereas Burkitu (2.3 t/ha), Herena (2.35 t/ha) and Hortu (2.39 t/ha) varieties manifested low grain yield. Generally, it is better if the work is repeated in the future for more justification since it was only one season experiment and the grain yield stability test of the higher yield varieties is advisable before recommending the varieties for large-scale production at the studied area.
Received | March xx, 2021; Accepted | March 09, 2022; Published | September 20, 2022
*Correspondence | Gemechu Nedi Terfa, Department of Plant Science, School of Agriculture,Ambo University, Mamo MezemirGuder Campus, P.O.Box,19,Ambo, Ethiopia; Email: gemenedi2017@gmail.com
Citation | Gurmu, G.N., T.B. Mulisa, A.L. Gemechu, K.G. Amena and G.N. Terfa. 2022. Evaluation of field pea (Pisum sativumL.) varieties for yield and yield-related traits. Sarhad Journal of Agriculture, 38(4): 1219-1227.
DOI | https://dx.doi.org/10.17582/journal.sja/2022/38.4.1219.1227
Keywords | Field pea, Grain yield, Leguminous, Variety, Yield related traits
Copyright: 2022 by the authors. Licensee ResearchersLinks Ltd, England, UK.
This article is an open access article distributed under the terms and conditions of the Creative Commons Attribution (CC BY) license (https://creativecommons.org/licenses/by/4.0/).
Introduction
Field pea (Pisum sativum L.) is a self-pollinated diploid (2n=14) annual cool-sseason pulse crop. It is also a major food legume with a valuable and cheap source of protein having essential amino acids that have high nutritional value for resource-poor households (Nawab, 2008; Getachew, 2019). It is widely grown in the cooler temperate zones and in the highlands of tropical regions of the world. The crop is cultivated in a wide range of soil types from light sandy loam to heavy clays but does not tolerate saline and waterlogged soil conditions (Ceyhan and Avci, 2015; Endres et al., 2016). The crop has the potential of growing in variable ranges of altitudes from1450-3200 m.a.s.l, where the annual rainfall is in the ranges of 400-100mm. The crop has a crucial role in the human diet as a protein source (23-25 %) (Bastianelli et al., 1998).
Field pea is among the major cool-season pulse crop grown on the second ranks of worldwide pulse production (Cherinet and Tazebachew, 2015; Muoni et al., 2019). The crop occupies the fourth rank of pulse crops production next to faba bean, haricot bean and chickpea in area coverage 219,927.59 ha with average yield productivity of 1.71 t/ha in Ethiopia (CSA, 2021).The crop has ecological and economic importance in Ethiopian highlands as it plays a significant role in soil fertility amendment and as a break crop. It is suitable for rotation systems to minimize the negative impacts of cereal-based mono-cropping (Fikere et al., 2014; Muoni et al., 2019).
Despite its importance, the average national productivity (1.7 t/ha) is very low (CSA, 2021) when compared with the crop potential yield (3.556 t/ha) and (4.17 t/ha) research finding in Ethiopia reported by Tolasa et al. (2013) and Mogiso (2017) respectivelyand the higher yielder (7-8 t/ha) reported at some European countries (Smykal et al., 2012), this is due to very limited availability of improved seeds and most pulse crops are grown from unimproved cultivars with low genetic potential. In contrast to the release of many improved pulse varieties which are adapted to a wide of rainfall, soil, and altitude regimes, the use of certified improved seeds by farmers is very low (Boere et al., 2015; Mogiso, 2017). To increase yield per unit area of the Oromia region seed of superior varieties must be multiplied and provided to the farmers. Because, availability of quality seed of improved field pea varieties at sufficient quantity is one of the major constraints to increase productivity (Ali et al., 2021).
Since developing a variety takes a long time, as an immediate solution it is recommended to provide the seed of existing improved varieties to the farmers (Tariku et al., 2020). Even though West Showa is a potential area for field pea production, field pea producers in the area cannot afford improved variety as other cereal crops. Therefore, the study was initiated to select higher yield improved field pea varieties for the West Showa zone farming community and other similar agroecology areas. The result of this finding gives valuable information for field pea producers and it also gives direction for researchers and field pea breeders to focus on genotype by environment interaction, while releasing improved variety.
Materials and Methods
Description of the Study Sites
The field experiment was conducted during the 2019 main cropping season from June to December at five locations (Babich, Goda Hora, CheliaRafisoAlenga, EjersaLafo, and Goromti) of West Showa Zone Oromia Region. (Table 1 and Figure 1).
Plant Materials
Eight improved field pea varieties released from federal and regional research centers were obtained from Holeta Agricultural Research Center (HARC) and Sinana Agricultural Research Center (SARC) and one local variety which was popularly used by local farmers of the Goremti site was used in the study. Description of the 9 varieties and their sources are given in Table 2.
Experimental Design and Procedure
The experiment was carried out in a Randomized Complete Block Design (RCBD) with two factors and
Table 1: Agro-climatic descriptions of the study site of West Showa zone, Oromia region Ethiopia.
|
Name of testing site |
Altitude (m.a.s.l.) |
Location |
Rainfall (mm) |
Temperature(oC) |
Soil type |
Agro-ecologies |
||
|
Latitude |
Longitude |
Min |
Max |
Loam soil |
Transitional highland |
|||
|
Goda Hora |
1938 |
8o51’N |
37o27’E |
700-1400 |
12 |
29 |
Red soil |
Transitional highland |
|
Babich |
2532 |
8o58’N |
37o30’E |
700-1400 |
12 |
26 |
Loam soil |
Transitional highland |
|
Goromti |
2560 |
8o55’N |
37o55’E |
500-1600 |
10 |
28 |
Loam soil |
Transitional highland |
|
Ejersalafo |
2254 |
9o02’N |
37o14’E |
750-1170 |
9.3 |
23.8 |
Red soil |
Transitional highland |
|
Chelia RA |
3128 |
8o58’N |
37o28’E |
900-1600 |
12 |
25 |
Loam soil |
Highland |
Sources: From each WANO 2019, RA=RafisoAlenga.
replications across five locations. The selected location is a major field pea producer of the study area. Each variety was sown in 9 rows of 2m length with 20cm inter-row spacing and 10cm intra row spacing between plants and 100kg blended Nitrogen, phosphorus, sulfur, and boron (NPSB) fertilizer ha-1was applied at the planting time. At all locations the land was ploughed three times by oxen and no irrigation supplement was implemented. Other agronomic management practices were also carried out at all sites following standard recommendations.
Table 2: Description of the field pea (Pisum sativum L.) varieties used in the experiment.
|
Genotype |
Source |
Seed Size |
Year released |
Adaptation area(m.a.s.l) |
|
Adi |
HARC/EIAR |
Medium |
1996 |
2300-3000 |
|
Burkitu |
HARC/EIAR |
Medium |
2009 |
1800-3000 |
|
Bursa |
KARC/EIAR |
Medium |
2015 |
1900-3000 |
|
Herena |
KARC/EIAR |
Medium |
2012 |
1800-3000 |
|
Hortu |
KARC/EIAR |
Medium |
2012 |
1800-3000 |
|
Letu |
KARC/EIAR |
Medium |
2010 |
1800-3000 |
|
Local |
GUDER AREA |
Medium |
NA |
1600-3000 |
|
T/shanan |
SARC/OARI |
Medium |
2007 |
1800-3000 |
|
Weyibe |
SARC/OARI |
Medium |
2017 |
1800-3000 |
Source: Crop variety Register (2019).
Data Collected
Data were collected from ten randomly selected plants of central rows on a plot basis on yield and yield-related traits.
Grain Yield (t/ha):The yield was measured from the harvestable central rows. Finally, yield per plot was converted to a per hectare basis and the average yield was recorded in toneha-1.
Hundred Seed Weight: Random samples of 100 seeds were counted from the harvested plot yields immediately after grain moisture determination and were weighed in grams.
Number of Seeds per Pod: Five pods were randomly taken per plant from each of the ten plants after counting the numbers of seeds per pod were determined by the average of pods.
Biomass Yield (g/plot): The weight in grams of the above-ground parts of plants harvested from the plots after sun drying. Finally, the biological yield per plot were converted to a hectare basis and expressed in quintalha-1.
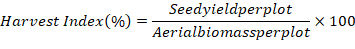
Harvest Index (%):Calculated on a plot basis, as the ratio of dried grain yield weight adjusted to 10% moisture content by the biomass yield and multiplied by hundred.
Data Analysis
The analysis of variance (ANOVA) for each location and combined analysis of variance over locations were performed following the standard procedure given by Gomez and Gomez (1984) using the SAS program (SAS Version,9.3). The homogeneity of error variance was tested using the F-max test method of Hartley (1950) prior to pooled analysis over locations. The F-test was used to detect significant effect while the mean separation was done using Least Significant Difference (LSD) at the 5% probability level.
Results and Discussion
Analysis of variance (ANOVA)
The combined analysis was carried out for the parameters viz., grain yield, number of seeds per pod, hundred seed weight, harvest index, above-ground biomass, and productive branch per plant at five locations. The combined analysis of variance over the five locations revealed significant differences for yield, harvest index, above-ground biomass, thousand seed weight, and the number of seeds per pod among the tested varieties (Table 3). This may be due to the genetic composition of the tested varieties. The analysis of variance also manifested significant differences among the tested varieties, locations, and varieties into environmental interaction. This indicates that the tested locations have different potential for field pea crop production based on their agro-climatic characters (Table 1). Since yield is determined by many factors such as soil, climate, and agronomic conditions (Din et al., 2019).
These results agree with previous findings of Tolesa et al. (2013) and Rezene et al. (2014) which reported that genotypes, environments, and genotypes into environmental interaction were significantly different for grain yield of field pea. Inline with this, Tadele et al. (2018) reported highly significant variation of year, environment, genotypes, genotypes into environmental interaction for mean grain yield of combined data analysis in common bean genotypes. Similarly, Mogiso (2017) reported a significant difference among the tested improved varieties of field pea for over years.
Table 3: Analysis of variance for combined data of yield and yield attributes of field pea varieties at five locations.
|
SV |
Df |
Yield |
HI |
AGB |
HSW |
SPP |
|
Block |
1 |
36.20ns |
35.22 |
0.43ns |
2.13ns |
0.07ns |
|
Location |
4 |
2574.12** |
6225.44** |
14314.01** |
363.10** |
4.99** |
|
Variety |
8 |
60.24** |
213.62** |
394.09** |
5.065** |
0.91** |
|
Var *Loc |
8 |
60.24** |
139.14** |
253.94* |
4.67** |
0.51ns |
|
Error |
44 |
539.17 |
453.97 |
5368.18 |
89.12 |
17.99 |
|
CV |
13.31 |
8.50 |
14.31 |
7.19 |
12.29 |
*and **: significance probability level at 0.05 and 0.01, ns: non-significant, Df: degree of freedom, GY: grain yield, HI: harvest index, AGB: above-ground biomass, HSW: hundred seed weight, SPP: number of seed per pod.
Mean Performance of the varieties
The mean grain yield of evaluated field pea varieties across the five environment/locations ranged from 3.0 for Bursa to 2.3 t/ha for Burqitu (Table 4). Moreover, the performance of the varieties was not consistent across the five environments. This maybe due to environmental variations and the genotype by environment interaction (GEI) that causes variation in yield and phenotypic traits of specific genotype (Niedbała, 2019; Niazian and Niedbała, 2020). For combined data analysis, variety Adi revealed the highest mean harvest index over locations followed by Weyib, T/shaman, while Hortu manifested the lowest harvest index. For above-ground biomass characters, Bursa manifested the maximum value (87 q/ha), while Adi revealed the minimum value (69.45 q/ha) for above-ground biomass followed by Burkitu (Table 4). The maximum hundred seed weight (20.77 gm) was observed in Local variety for the combined data analysis, while the minimum hundred seed weight of 19.03 gm was shown by Adi. The maximum number of seeds per pod 5.7 was registered for Weyib, while the minimum number of seeds per pod 4.85 was manifested by Burqitu over locations (Table 4).
Table 4: Combined mean value of yield and yield related traits of nine field pea variety over 5 locations.
|
Variety |
GY (t/ha) |
HI |
AGB |
HSW |
SPP |
|
Adi |
2.84ab |
45.21a |
69.45c |
19.03bc |
5.38ab |
|
Burkitu |
2.3c |
36.77c |
71.0c |
20.5a |
4.85b |
|
Bursa |
3.0a |
36.35c |
87a |
19.21bc |
4.85b |
|
Herena |
2.35c |
33.88cd |
76.45bc |
18.76c |
5.24ab |
|
Hortu |
2.4c |
31.87d |
77.16abc |
19.56abc |
5.41ab |
|
Letu |
2.74ab |
35.97c |
81.7ab |
20.31ab |
5.36ab |
|
T/shaman |
2.6bc |
42.13b |
71.3c |
19.64abc |
4.89b |
|
Weyib |
2.83ab |
43.25ab |
75.33bc |
20.32ab |
5.72a |
|
Local |
2.6bc |
34.56cd |
85.05ab |
20.77a |
5.1b |
|
Grand mean |
2.63 |
37.78 |
77.16 |
19.79 |
5.2 |
|
LSD( 5 %) |
3.15 |
2.89 |
9.95 |
1.28 |
0.58 |
|
SD |
3.5 |
3.2 |
11.04 |
1.42 |
0.64 |
|
CV |
13.31 |
8.50 |
14.31 |
7.19 |
12.29 |
GY: grain yield, HI: harvest index, AGB: above ground biomass, HSW: hundred seed weight, SPP: number of seed per pod. Mean in the same column followed by the same letters are non-significantly different at 5 % significance level.
The combined data analysis for the number of seeds per pod revealed significant differences among the tested varieties. The highest number of seeds per pod (5.72) was manifested by Weyib, whereas the lowest seed per pod (4.85) was revealed by Burkitu and Bursa varieties (Table 4).
Grain Yield
Grain yield may be the result of many plant characteristics which are interacting with numerous external factors during the life of the plants. The ranking of varieties based on grain yield may be considered a reliable measure for genotypic performance (Niazian and Niedbała, 2020). At all locations, the yield obtained showed a statistically significant difference among the tested varieties for grain yield except
at Ejersalafo site (Table 5). At the Babich site, the highest mean grain yield of 2.8 t ha-1was obtained from the Bursa variety, while the lowest yield 1.29 t ha-1was obtained from Harena (Table 5). At CheliaRefisoAlenga location, the maximum grain yield 2.92 t/ha-1 was manifested by Weyib variety, while the minimum grain yield 0.91 t/ha-1 was revealed by Burkitu (Table 5). On another hand, all the tested varieties revealed non-significant differences for grain yield at the Ejersolafo site (Table 5). The maximum grain yield mean value of 5.06 t ha-1was manifested for Adi variety followed by Weyib 4.72 t ha-1, while the minimum grain yield mean value 3.33 t ha-1was revealed by Local at Goda hora location (Table 6). At the Goremti location, the highest grain yield mean value of 1.75 t ha-1 was manifested by Letu variety followed by Adi 1.62 t ha-1, while the lowest grain yield 0.96 t ha-1was manifested by Herena (Table 6). The mean grain yield of the tested varieties across the environment was varied, this indicated the existence of significant genotypes into environmental interaction. Larger yield variation between environments indicated that the environments were variable whereas some of the environments were more favorable for field pea varieties to produce high yield while other locations were less favorable. It also indicated that the varieties responded differently at different locations due to the effects of genotype x environment interaction. The performance of a given variety depends upon its genetic potential and the environment where it is grown (Mangistu et al., 2011). Among locations, the Goremti site was not conducive for field pea production since all the tested varieties manifested low grain yield. Likewise, Fikere et al. (2010) and Kindie et al. (2019) had reported significant differences among the tested field pea genotypes across the tested environments for grain yield and other yield-related traits.
Harvest index
Harvest index is a critical factor of yield-related traits which can influence grain yield. At all locations, the yield obtained showed statistically significant differences among the tested varieties for harvest index except at Ejersalafo site (Table 5). At the Babich site, the maximum harvest index value of 24.55 was manifested for the Bursa variety, while a minimum mean value (12.4) was revealed for Herena (Table 5). At CheliaRefisoAlenga location, the maximum harvest index (45.5) was manifested by the T/shaman variety, while the minimum value (20) was revealed by Burkitu (Table 5). On the other hand, all the tested varieties revealed non-significant differences for harvest index at the Ejersolafo site (Table 5). The highest harvest mean value 77.3 was manifested for Adi variety followed by the T/shaman variety with mean value of 75.65, while the lowest mean value of 43.75was revealed by Hortu at Goda hora location (Table 6). At the Goremti location, the highest harvest index (28.8) was manifested by the Adi variety, while the lowest value of 12.8was manifested by Herena (Table 6).
Table 6: Mean value of grain yield and yield-related traits of nine tested field pea variety at Goda hora and Goremti.
|
Variety |
Test environment |
|||||||||
|
Goda hora |
Goremti |
|||||||||
|
Parameters |
GY (t/ha) |
HI |
AGB |
HSW |
SPP |
GY (t/ha) |
HI |
AGB |
HSW |
SPP |
|
Bursa |
4.64b |
54.1d |
85.75b |
10.31a |
3.5c |
1.31ab |
15.9c |
84.0a |
22.3ab |
5.8a |
|
Local |
3.33e |
37.95f |
87.75a |
12.82a |
5ab |
1.12ab |
15.2c |
75ab |
24.15a |
5a |
|
Adi |
5.06a |
77.3a |
65.5e |
13.42a |
4 bc |
1.62ab |
28.80a |
57.50ab |
18.4c |
6 a |
|
Weyib |
4.72ab |
68.9b |
68.5d |
12.82a |
5.5a |
0.97b |
12.8c |
75.5ab |
23.1ab |
6.3a |
|
Letu |
3.33e |
40.7ef |
81.75c |
13.22a |
4 bc |
1.75a |
23.30b |
74.50ab |
21.3abc |
5.75a |
|
T/shaman |
3.61de |
75.65a |
47.75h |
11.38a |
4bc |
1.08ab |
16.8c |
64.50ab |
23.9a |
5.5a |
|
Burqitu |
4.17c |
68.95b |
60.5g |
11.67a |
3.5c |
1.29ab |
15.4c |
84.0a |
23.15ab |
6.1a |
|
Hortu |
3.61de |
43.75e |
82.5c |
14.26a |
5.5a |
1.35ab |
25.6ab |
55.50b |
19.5bc |
5.75a |
|
Herena |
3.89dc |
62.2c |
62.5f |
10.51a |
4.5abc |
0.96b |
13.35c |
72ab |
22.1abc |
5.5a |
|
EMS |
2.35 |
3.75 |
0.74 |
4.15 |
0.25 |
11.47 |
3.81 |
149.5 |
2.76 |
0.40 |
|
LSD (5%) |
3.53 |
4.47 |
1.99 |
4.69 |
1.15 |
7.81 |
4.49 |
28.19 |
3.83 |
1.46 |
GY: grain yield, HI: harvest index, AGB: above ground biomass, HSW: hundred seed, SPP number of seed per pod. Mean in the same column followed by the same letters are non-significant different at 5 % significance level.
Above-ground biomass
At all locations, the yield obtained showed statistically significant differences among the tested varieties for above-ground biomass traits except at the Ejersalafo site (Table 6). At the Babich site, the maximum above-ground biomass (121q/ha) was manifested for the local variety, while a minimum value (91q/ha) was revealed for Hortu (Table 5). At Chelia Refiso Alenga location, the maximum above-ground biomass (45.5q/ha) was manifested by T/shaman variety, while the minimum (20q/ha) was revealed by Burkitu (Table 5). On the other hand, all the tested varieties revealed statistically non-significant differences for above-ground biomass at the Ejersolafo site (Table 5). The highest above ground biomass value (87.75 q/ha) was manifested for Local variety followed by T/shaman variety with mean value of 75.65 q/ha, while the lowest value of 62.5 q/ha was revealed by Herena at Goda hora location (Table 6). At the Goremti location, the highest above ground biomass mean value (84 q/ha) was manifested by Bursa and Burkitu varieties, while the lowest value 55.5was manifested by Hortu (Table 6).
Hundred seed weight
Even though a hundred seed weight is one of the seed yield determining traits, in the present study the maximum hundred seed weight was not revealed for the maximum grain seed variety at the Babich site. This may be due to the effect of genotype and its interaction with the environment. But Habtamu and Million (2013) reported a negative association of hundred seed weight and seed yield. In the present study, a hundred seed weight showed statistically significant differences among the tested varieties at all studied locations. At the Babich site, the maximum hundred seed weight mean value of 22.21gm was manifested for Burkitu variety, while a minimum value of 15.42gm was revealed for Herena (Table 5). At CheliaRefisoAlenga location, the maximum hundred seed weight of 23.12 gm was manifested by the Hortu variety, while the minimum (20.26gm) was revealed by Bursa (Table 5). But all the tested varieties revealed statistically non-significant differences for hundred seed weight at the ChaliyaRefisoAlenga site (Table 5). The highest hundred seed weight value of 24.4gm was manifested for the Herena variety, while the lowest value (22.55gm) was revealed by Herena at the Ejersalafo location (Table 5). The highest hundred seed weight (14.26gm) was manifested for the Hortu variety, while the lowest value of 10.31gm was revealed by Bursa at Goda hora location (Table 5), but a statistically non-significant difference was observed between them. At the Goremti location, the highest hundred seed weight biomass (24.15gm) was manifested by Local variety, while the lowest value of 18.4was manifested by Adi (Table 6). The obtained value for hundred seed weights varied among locations within the same variety, this is due to the existence of genotypes into environmental interaction. But Ceyhan and Avci (2015) reported that the observed differences in grain weight among varieties might be due to inherent genetic differences among the varieties.
Number of seeds per pod
In the present study, the number of seeds per pod showed statistically significant differences among the tested varieties at all studied locations, except Goremti. At the Babich site, the maximum seed per pod (5.7) was manifested for the Weyib variety, while a minimum value of 4.4 was revealed for the Burkitu variety (Table 5). At CheliaRefisoAlenga location, the maximum seed per pod 6.12 was manifested by the Hortu variety, while the minimum value of 4.45 was revealed by T/shaman (Table 6). The highest seed per pod (6.5) was manifested for the Adi variety, while the lowest value (5) was revealed by Hortu at the Ejersalafo location (Table 5). The highest seed per pod (5.5) was manifested for Weyib and Hortu varieties while the lowest value of 3.5 was revealed by Bursa and Burkitu varieties at Goda hora location (Table 6). At the Goremti location, the highest seed per pod mean value of 6.3 was manifested by the Weyib variety, while the lowest value of 5 was manifested by Local variety (Table 6). The obtained value for seed per pod varied among locations within varieties, this was due to genotypes x environmental interaction. Number of seed per plant, biological yield, and harvest index were the most important factors in determining seed yield indicating that selection for any one of them may permit improvement in grain yield in field pea program (Gao and Ashamo, 2014).
Conclusions and Recommendations
Based on the present find Bursa variety is best performed at Babich, Weyibe variety is best performed at both CheliyaRefisoAlenga and Goda Hora sites, while Herena variety best performed at the Ejersalafo and Letubest performed at Goremti site. This suggested that testing of varieties over different locations is recommendable before large-scale production.Finally, to recommend the best varieties in the studied area yield stability analysis of the varieties is advisable and this work should be repeated in the future for more justification.
Acknowledgments
The authors acknowledge Ambo University for the financial support during work and all the district developmental agents (DA) for the experimental site facilitation.
Novelty Statement
The study was identified best varieties for the studied area and for an area of similar agro-ecology.
Author’s Contribution
Gudeta Nepir Gurmu: Designed the work, data collection and manuscript editing.
Alemu Lenco Gemechu and Kegna Gadisa Imana: Collected the data.
Gemechu Nedi Terfa: Layout the experiment, data
analysis and manuscript writing.
Conflict of interest
The authors have declared no conflict of interest.
References
Ali, Y., F. Mekibib and Z. Bishaw. 2021. Seed Quality Analysis of Field Pea (Pisum Sativum L.) from Formal and Informal Sources in EnarjEnawuga and YilmanaDensa Districts, West Amhara Region, Ethiopia. Int. J. Agric. Sci. Food Technol., 7(1): 001-013. https://doi.org/10.17352/2455-815X.000081
Avci, M.A. and E. Ceyhan. 2013. Determination of some agricultural characters of pea (Pisum sativum L.) genotypes. J. Anim. Vet. Adv., 12(7): 798-802. URL : http://docsdrive.com/.../798-802
Bastianelli, D., F. Grosjean, C. Peyronnet, M. Duparque and J.M. Regnier. 1998. Feeding value of pea (Pisum sativum L.) 1. Chemical composition of different categories of pea. Anim. Sci., 67(3): 609-619.
Boere, A., T. Rutgers, D.Willems, D. Kidane and W. Dolfen. 2015. Business Opportunities Report Oilseeds and pulses #5 in the series written for the “Ethiopian Netherlands business event 5-6 November 2015, Rijswijk, The Netherlands
Ceyhan, E. and M.A. Avci. 2015. Determination of some agricultural characters of developed pea (Pisum sativum L.) lines. Int. J. Agric. Biosyst. Eng., 9(12): 1235-1238.
Cherinet, A. and A. Tazebachew. 2015. Adaptability of field pea (Pisum sativum L.) varieties under irrigation, Western Amhara Region, Ethiopia. Int. J. Plant Breed. Gen., 9(1): 28-31. https://doi.org/10.3923/ijpbg.2015.28.31
CSA. 2021. Central Statistical Agency Agricultural Sample Survey: Report on area and production of major crops (private peasant holdings, Meher’ season of 2020/2021). Stat. Bull. 1: 590. CSA, Addis Ababa, Ethiopia.
Din, M., F. Khan, A. Karim, Tajuddin and Saifullah. 2019. Evaluation of different varieties of pea under agro-climatic conditions of Gilgit-Baltistan. Adv. Food Technol. Nutr. Sci. Open J., 5(2): 50-53. https://doi.org/10.17140/AFTNSOJ-5-156
Endres, G., S. Forster,H.Kandel, J. Pasche, M.Wunsc, J. Knodel and K. Hellevang. 2016. Field pea production. NDSU extension service, PP 1-11.
Fikere, M., T. Tadesse, S. Gebeyehuand B. Hundie. 2010. Agronomic performances, disease reaction and yield stability of field pea (Pisum sativum L.) genotypes in Bale Highlands, Ethiopia. Aust. J. Crop Sci., 4(4): 238-246. https://search.informit.org/doi/10.3316/informit.216870134088210
Fikere, M., D.J. Bing, T. Tadesse and A. Ayana. 2014. Comparison of biometrical methods to describe yield stability in field pea (Pisum sativum L.) under south eastern Ethiopian conditions. Afr. J. Agric. Res., 9(33): 2574-2583. https://doi.org/10.5897/AJAR09.602
Getachew, T. 2019. Pulse crops production opportunities, challenges and its value chain in Ethiopia: A review article. J. Environ. Earth Sci., 9(1): 20-29.
Goa, Y. and M. Ashamo. 2014. Evaluation of field pea (Pisum sativum L.) genotypes performance for yield and yield components at five growing environments of southern Ethiopia. Curr. Res. Agric. Sci., 1(3): 65-76.
Gomez, K.A. and A.A. Gomez. 1984. Statistical procedures for agricultural research. John Wiley & Sons.
Habtamu, S. and F. Million. 2013. Multivariate analysis of some Ethiopian field pea (Pisum sativum L.) genotypes. Int. J. Gen. Mole. Biol., 5(6): 78-87. https://doi.org/10.5897/IJGMB2013.0080
Hartley, H.O. 1950. The maximum F-ratio as a short-cut test for heterogeneity of variance. Biometrika, 37(3/4): 308-312. https://doi.org/10.1093/biomet/37.3-4.308
Kindie, Y., A.Bezabih, W. Beshir, Z. Nigusie, Z. Asemamaw, A. Adem, B. Tebabele, G. Kebede, T. Alemayehu and F. Assres. 2019. Field pea (Pisum sativum L.) variety development for moisture deficit areas of eastern amhara, Ethiopia. Adv. Agric. https://doi.org/10.1155/2019/1398612
Mangistu, G., C. Dhaba, A. Temesgen, D. Lule and N. Geleta. 2011. Genotype x environment interaction for yield in field pea (Pisum sativum L.). East Afr. J. Sci., 5(1): 6-11.
Mogiso, M. 2017. Adaptation and Performance on Yield and Yield Components of Field Pea (Pisum sativum L.) Varieties at Adiyo District, Southwestern Ethiopia. J. Biol. Agric. Healthcare,7(1): 42-46.
Muoni, T., A.P. Barnes, I. Öborn, C.A. Watson, G. Bergkvist, M. Shiluli and A.J. Duncan. 2019. Farmer perceptions of legumes and their functions in smallholder farming systems in east Africa. Int. J. Agric. Sustain., 17(3): 205-218. https://doi.org/10.1080/14735903.2019.1609166
Nawab, N.N., G.M. Subhani, K.Mahmood, Q. Shakil and A. Saeed. 2008. Genetic variability, correlation and path analysis studies in garden pea (Pisum sativum L.). Jour Agric Res, 46: 333-340
Niazian, M. and G. Niedbała. 2020. Machine learning for plant breeding and biotechnology. Agriculture, 10(10): 436. https://doi.org/10.3390/agriculture10100436
Niedbała, G., M. Piekutowska, J. Weres, R. Korzeniewicz, K. Witaszek, M. Adamski, K. Pilarski, A.Czechowska-Kosacka and A. Krysztofiak-Kaniewska. 2019. Application of artificial neural networks for yield modeling of winter rapeseed based on combined quantitative and qualitative data. Agronomy, 9(12): 781. https://doi.org/10.3390/agronomy9120781
Smýkal, P., G. Aubert, J. Burstin, C.J. Coyne, N.T. Ellis, A.J. Flavell, R. Ford, M. Hýbl, J. Macas, P. Neumann and K.E. McPhee. 2012. Pea (Pisum sativum L.) in the genomic era. Agronomy, 2(2): 74-115. https://doi.org/10.3390/agronomy2020074
Tadele, T., S.Gashaw, A. Belay and T. Amanuel. 2018. Application of AMMI for grain yield stability analysis in large speckled bean genotypes grown in midlands of bale zone. Chem. Biomol. Eng., 3(3): 17-21. https://doi.org/10.11648/j.cbe.20180303.11
Tariku. S., M. Selamawit and S. Tamirat. 2020. Evaluation of finger millet (Eleusine coracana (L). Gaertn.) varieties for grain yield in lowland areas of southern
Ethiopia, Cogent Food & Agriculture, 6:1, 1788895,
Tolessa, T.T., G. Keneni, T. Sefera, M. Jarso and Y. Bekele. 2013. Genotype × environment interaction and performance stability for grain yield in field pea (Pisum sativum L.) genotypes. Int. J. Plant Breed., 7(2): 116-123.
Rezene, Y., A. Bekele and Y. Goa. 2014. GGE and AMMI biplot analysis for field pea yield stability in SNNPR state, Ethiopia. Int. J. Sustain. Agric. Res., 1(1): 28-38.
To share on other social networks, click on any share button. What are these?


