Evaluating the Impact of Variable Seed Rates on Growth, Productivity and Yield attributes of different Wheat (Triticum aestivum L.) Genotypes of Barani Areas


Research Article
Evaluating the Impact of Variable Seed Rates on Growth, Productivity and Yield attributes of different Wheat (Triticum aestivum L.) Genotypes of Barani Areas
Amina Batool1*, Saba Aleem1, Ali Nawaz1, Muhammad Imran Khan1, Waheed Arshad1, Muhammad Aslam2, Shiraz Ali3 and Muhammad Zeeshan3
1Barani Agricultural Research Station, Fatehjang, Punjab, Pakistan; 2Barani Livestock Production Research Institute, Kherimurat, Fatehjang, Punjab, Pakistan; 3Groundnut Research Station, Attock, Punjab, Pakistan.
Abstract | Seed rate is one of the most pivotal factors that significantly impact grain quality and yield in wheat. In wheat-based crop production system, it can be easily managed. An indiscrimination in seeding rate can lead to higher production cost but will also result in decline of crop yield and quality. Hence, the present experiment was designed to establish the optimal seeding density of three different wheat genotypes (Fatehjang-2016, Dharabi-11 and 16FJ17) of the Barani Areas to attain maximum economic yield. The research experiment was managed in split amidst the cropping season of Rabi 2019-20; one at the laboratory by growing three diverse genotypes of wheat at four different levels of seeding densities in pots and the other at field area of Barani Agricultural Research Station, Fateh Jang at four discrete levels of seeding density of 80, 100, 120 and 140 kg ha-1, respectively. The experiment was laid down using a RCBD with three replication and four treatments. Different seed rates and genotypes significantly affected all plant traits except days to 50% heading, plant height and germination percentage. Contrarily, the interactive effect of genotype and seeding rate on all growth and yield attributes was found non-significant. Whereas, seeding density of 120 kg ha-1 exhibited more germination percentage (85 %), shoot length (11.57 cm), coleoptile length (3.97 cm), days to 50% heading (130), plant height (110 cm), nodes per stem (5.0), 1000 grain weight (49.53 g), grain per spike (41.0), days to maturity (172.67) and grain yield (3755 kg ha-1) in Fatehjang-2016. Whereas Dharabi-11 showed maximum root length (17.64 cm) and tiller count (405.67 m-2) at same level of seeding density. In contrast, 16FJ17 stood second in all parameters except root length and number of tillers m-2. The value for grain per spike (40.0) and shoot length (10.55 cm) is at par with Fatehjang-2016 and Dharabi-11, respectively at 120 kg ha-1 of seeding level. It is evident from the results that wheat variety Fatehjang-2016 can effectively be planted at an optimum seed rate of 120 kg ha-1 for general cultivation and better economic returns in Barani Areas of Pakistan, provided all the agronomic and crop management practices must be kept optimum.
Received | November 19, 2020; Accepted | June 30, 2022; Published | June 28, 2022
*Correspondence | Amina Batool, Barani Agricultural Research Station, Fatehjang, Punjab, Pakistan; Email: amnabatool22@gmail.com
Citation | Batool, A., S. Aleem, A. Nawaz, M.I. Khan, W. Arshad, M. Aslam, S. Ali and M. Zeeshan. 2022. Evaluating the impact of variable seed rates on growth, productivity and yield attributes of different wheat (Triticum aestivum L.) genotypes of Barani areas. Pakistan Journal of Agricultural Research, 35(2): 285-302.
DOI | https://dx.doi.org/10.17582/journal.pjar/2022/35.2.285.302
Keywords | Seeding density, Plant height, 1000 grain weight, Grain per spike; Randomized complete block design
Copyright: 2022 by the authors. Licensee ResearchersLinks Ltd, England, UK.
This article is an open access article distributed under the terms and conditions of the Creative Commons Attribution (CC BY) license (https://creativecommons.org/licenses/by/4.0/).
Introduction
Wheat (Triticum aestivum) is a prime member of the family Poaceae and major staple food in Pakistan (Ahmad et al., 2018). It also plays a pivotal role in the advancement of civilization and is also known as the first domesticated crop around 12,000 to 10,000 years ago (Ulaş et al., 2018). Being the king of cereals, it is one of the most extensively grown and widely adaptable crop around the world (Venske et al., 2019). Nearly 35% of the global population consume wheat as staple food (Grote et al., 2021). It is speculated that the worldwide population will grow from 7 billion to 9 billion by 2050 necessitating crop production to double to successfully meet global food demand in future (FAO, 2020).
Following the international wheat production statistics, Pakistan ranks eighth as the largest producer of wheat crop globally and it is grown almost in every part of the country (Agriculture Statistics of Pakistan, 2020-21). Its contribution to GDP and value-added is 1.8 and 9.2 percent, respectively. In Pakistan, wheat was cultivated on an area of 9177.6 thousand hectares with an impeccable production of 27.2934 million tonnes (Economic Survey of Pakistan, 2020-21).
The crop yields are inconsistent significantly among different areas and cropping seasons in the similar area. These major factors of variation are soil, date of sowing, seeding density, type and volume of available nutrients, cropping season and other differences in cultural practices. To date, several varieties of bread and durum wheat have been worked on and developed in order to meet the growing production demands (Abboye et al., 2020).
The environment, selected genotypes/ varieties and planting density greatly influence the number of productive tillers. Whereas, sufficient moisture availability, extensive light interception and optimum availability of nitrogen through vegetative phase can assist in increased tillering capacity; however, all of these factors significantly depend upon varieties (Jemal et al., 2015). Seed rate is a very pivotal agronomic factor that require great attention for attaining enhanced yield in various crops. Increased seeding rate influences the resources availability amongst crops, like it heightens the contestation for mutual resources such as water, availability of nutrients and interception of sunlight ultimately resulting in poor yield and quality. Considering this, it is necessary to enhance the production and productivity of the crop by identifying and improving the most cost-effective varieties and profitable plant population rates with low cost of production inputs (Abboye et al., 2020). However, 125 kg ha-1 is the most common seed rate applied all over the country and is applicable on all the wheat varieties. Similarly, in the area under study it has been personally observed that farmers are more inclined towards this trend of using higher seed rates (plant population m-2) for both of small and large sized bread wheat varieties (own observation). Seed rates should be in sync with the favorable or unfavorable environmental conditions that will ultimately reduce the degree of contestation among tillers specifically around tiller initiation. This clearly reflects that the adjustment of seeding density can be effectively managed by in depth knowledge and good understanding of genotypic response of tillering to environmental and agricultural management practices thus resulting in higher economic yield (Ozturk et al., 2006).
Particularly, in developing countries most of the farmer practice greater seed rate than the suggested regime, as it is a general perception among farming community that this could be the remedy and counter measure to control weed infestation and give better crop production (Abboye and Teto, 2020). The practice of higher planting density should be discouraged as it has adverse effects upon the quality of seed especially on weight and size of seed. Rather farmer should pay closer attention towards the instructions about recommended seed production practices (Tigabu and Asfaw, 2016). Furthermore, row spacing is another key factor influencing the optimal growth, development and productivity of wheat when manage at its optimum level; additionally, it provides space for the plants to efficiently utilize nutrients and sun radiations (Woldekiros, 2020).
In the light of that, it is crucial to discern the ideal plant population for different seed sized varieties of bread wheat aimed at improving and attaining the production and productivity of the crop by pinpointing the most cost-effective varieties and profitable plant population rates with low cost of production inputs (Abboye et al., 2020).
Objectives
The prime aims and objectives of this research experiment were:
- To optimize the seed rates of given genotypes for wheat growers of Barani Areas.
- To conclude how different seeding densities can modify economic yield.
- To understand the interactive influence of seeding densities and genotypes on various growth and yield related attributes with the aim to provide farmers with enhanced and alternate management practices encountering lower grain yields.
Materials and Methods
Experimental material, site and design
Pakistan has two major cropping seasons i.e., Kharif and Rabi. Kharif being the primary sowing season commences from the month of April to June and is harvested during October to December. However, Rabi being the secondary sowing season begins from the month of October to December and harvesting is commenced from April to May. Agricultural productivity of Pakistan is mainly reliant on timely availability of water Economic Survey of Pakistan, 2020-21.
The field experimental trials were executed through the Rabi season of 2019-20 at the field area of Barani Agricultural Research Station Fateh Jang located at 33.54998 North and 72.57929 East 504m above sea level. The climate was sub humid with rain-fed agriculture. The soil texture was sandy loam with pH 7.81 and deficient in Phosphorus and Potassium. Three different wheat genotypes (Fatehjang-2016, Dharabi-11 and 16FJ17) were sown at varying seeding rates of S1 80, S2 100, S3 120 and S4 140 kg ha-1, respectively. The experiment was carried out in split; the first half was executed in laboratory conditions with three genotypes grown at varying seed densities in pots with growing media. However, the second half was grown in the field with three genotypes at four varying seed densities of 36 g/plot, 48 g/plot, 60 g/plot and 72 g/plot, respectively, in triplicate using Randomized Complete Block Design in Factorial arrangement following the procedure of Gomez and Gomez (1984). The row to row distance was maintained at 30cm with 4 rows per treatment of 4m length whereas, the total plot size was 4.8m2. All other agronomical procedures were sustained homogenously for all the treatments. Sowing was performed with a single seed coulter hand drill on 5 November 2019 during Rabi season. Seasonal weather data regarding precipitation and mean temperature during the experiment was collected from the field observatory as elucidated in Figure 1. Nutrients were readily applied at 90-60-30 NPK kg ha-1 in the form of DAP (di-ammonium phosphate), urea and sulphate of potash respectively. All N, P and K were applied during final land preparation at the time of sowing. Weeding and hoeing were completed manually once before the canopy closure thereby alleviating the chances of weed-crop competition. The trial was harvested during the last week of April 2020 dated 25-04-2020.
Treatments
This experiment was comprised on twelve treatments in total. The treatment combinations were three diverse wheat genotypes and four different plant densities. The selected bread wheat genotypes (Fatehjang-2016, Dharabi-11 and 16FJ17) were classified as medium with respect to seed size. The three different bread wheat genotypes were assigned the main plot treatment however; the four seed rates were allocated as sub plot treatments.
The seed rate for all treatments was computed with help of equation/ formula mentioned below derived by (Herwaarden et al., 2003; Habte, 2017; Abboye et al., 2020).
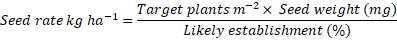
For instance, if a genotype has a seed weight of 46.4 mg (TGW of 46.4g), and an expected establishment percentage of 90%, the seeding density of 140 kg ha-1 then the plant population m-2 can be computed by the following equation/formula:

Table 1: Plant population computed for different wheat genotypes planted at varying seed rates.
|
Treatment No. |
Genotype |
Seed rate (kg ha-1) |
Treatment combinations |
Plant population per m2 |
Plant population per ft2 |
|
1 |
Fatehjang-2016 |
80 kg ha-1 |
V1S1 |
155 seeds m-2 |
14 seeds ft2 |
|
2 |
Fatehjang-2016 |
100 kg ha-1 |
V1S2 |
194 seeds m-2 |
18 seeds ft2 |
|
3 |
Fatehjang-2016 |
120 kg ha-1 |
V1S3 |
233 seeds m-2 |
21 seeds ft2 |
|
4 |
Fatehjang-2016 |
140 kg ha-1 |
V1S4 |
272 seeds m-2 |
25 seeds ft2 |
|
5 |
Dharabi-11 |
80 kg ha-1 |
V2S1 |
181 seeds m-2 |
17 seeds ft2 |
|
6 |
Dharabi-11 |
100 kg ha-1 |
V2S2 |
227 seeds m-2 |
21 seeds ft2 |
|
7 |
Dharabi-11 |
120 kg ha-1 |
V2S3 |
272 seeds m-2 |
25 seeds ft2 |
|
8 |
Dharabi-11 |
140 kg ha-1 |
V2S4 |
317 seeds m-2 |
29 seeds ft2 |
|
9 |
16FJ17 |
80 kg ha-1 |
V3S1 |
162 seeds m-2 |
15 seeds ft2 |
|
10 |
16FJ17 |
100 kg ha-1 |
V3S2 |
203 seeds m-2 |
19 seeds ft2 |
|
11 |
16FJ17 |
120 kg ha-1 |
V3S3 |
243 seeds m-2 |
22 seeds ft2 |
|
12 |
16FJ17 |
140 kg ha-1 |
V3S4 |
284 seeds m-2 |
26 seeds ft2 |
Note: G is for genotype and S is for varying seed rates; kg ha-1is for kilogram per hectare.
Target plants m-2 = (140 kg ha-1 x 90 %) / 46.4mg = 272.5 seeds m-2
Similar calculations for each variety with varied thousand grain weight (g) and similar likely establishment % (germination) were computed for all the treatments elucidated in the Table 1. The computations were made with likely establishment of 90% but it may differ with the diverse results of the germination percentage (Abboye et al., 2020).
Experimental design
Both factors i.e., wheat genotypes and seed rates were evaluated in RCBD, factorial arrangement. The experimental data was collected and subjected to Analysis of Variance (ANOVA) test using Statistix 8.1 computer Analytical Software (2005), the treatment means were differentiated using Least Significance (LSD) test at P<0.05 (Gomez and Gomez, 1984). The interaction plots were compiled using Minitab 17 Statistical Software Minitab (2010).
Observation and sampling
As the experiment was carried out in split; data collection for the following twelve parameters was also bifurcated into two parts. Initially, ten plants were randomly selected from each pot and data for germination percentage, coleoptile length, root and shoot length was calculated. In the similar way ten plants from each plot were randomly selected in the field and data for other parameters was calculated and means were computed.
All the traits studied in this experiment are elucidated in Table 2 along with abbreviations and units, respectively.
Table 2: Observations/ Traits studies in this research experiment with their abbreviations and units.
|
Observation/ Traits |
Abbreviation |
Unit |
|
Germination percentage |
G.P % |
% |
|
Root length (cm) |
R.L |
cm |
|
Shoot length (cm) |
S.L |
cm |
|
Coleoptile length (cm) |
C.L |
cm |
|
Days to 50% heading |
D.O.H 50% |
Days |
|
No. of tillers/ m2 |
NoT |
m-2 |
|
Plant height |
P.H |
cm |
|
Nodes per stem |
NPS |
No. |
|
Thousand grain weight |
1000 G.W |
g |
|
Grain per spike |
GPS |
No. |
|
Days to maturity |
D.O.M |
Days |
|
Grain yield |
G.Y |
Kg ha-1 |
Germination percentage
Counting was made after first seedling emergence, and computed by the equation/ formula given below, derived by Smith and Millet (1964).

Root length (cm)
Root length was measured after 2 weeks of seed germination with a ruler and average was computed for statistical analysis.
Shoot length (cm)
Shoot length was measured after 2 weeks of seed germination by using a scale and the mean was worked out.
Coleoptile length (cm)
Coleoptile length was noted after attaining the maximum length as indicated by the emergence of primary leaf from the coleoptile. Coleoptile length was measured by the scale and mean was computed.
Days to 50% heading
Days to 50% Heading (A stage when panicle appeared subsequently the unfolding of the flag leaf) were documented from the sowing date to the date of 50% heading (Muller, 1991).
No. of tillers m-2
Number of tillers were counted from the m2 area at the time of maturity.
Plant height (cm)
The plant height was measured from ground level to the top of the spike termination node at harvest through measuring tape in centimeters.
Nodes per stem
Number of nodes were counted prior to maturity.
1000 grain weight (g)
The thousand grain weight was measured by separately harvesting threshing each plot. The grains were counted by using an electronic seed counter and weight of 1000 seeds sampled from each plot was measured using a sensitive weighing balance of precision 0.001 g. The 1000 grain weight was recorded after the grain moisture content was adjusted to 12.5%.
Number of grains per spike
It was counted ten times from randomly selected spikes of ten arbitrarily selected plants per net plot at the time of harvesting and was averaged to per spike basis. Subsequently, spikes had been totaled from each plot and threshed to obtain the number of grains per spike. The mean average value from ten plants was computed as number of grains per spike.
Days to maturity
Days to physiological maturity were jotted down as from when the crop was sown to the date of maturity (when about 90% of the wheat crop turned yellow).
Grain yield
Wheat bundles were harvested and threshed from each sub plot separately. Also, the average grain yield from each plot was recorded separately and then converted into kg per hectare after 12.5 percent grain moisture content was adjusted.
Results and Discussion
The main attributes of wheat growth and yield studied in this experimental study were germination percentage, root length, shoot length, coleoptile length, days to 50 % heading, number of tillers, plant height, nodes per stem, thousand grain weight, grain per spike, days to maturity and grain yield of three diverse genotypes. Samples of these yield traits were studied at four different level of seed rates. The results were computed for all treatments that exhibited significant and, in some cases, non-significant differences clearly representing wide range of expression for all the characters under study. To attain maximum yield returns and amenable quality in spring wheat varietal selection, seed rate and fertilizer management are main choices. Moreover, an interaction can occur among management aspects and new varieties that have varied morphological characters. Thus, selection of cultivar/ variety plays a pivotal role in influencing the economic yield and quality of wheat. All the genotypes in this experiment vary greatly in terms of grain yield and other agronomic traits. Our results affirm the findings of Otteson et al. (2008); who stated that the response of specific genotypes was affected by the varying seeding rates. The trait wise discussion is explained below:
Germination percentage (%)
The analysis of variance (Table 3) revealed that genotypes had non-significant (>0.05) effect on germination percentage contrarily, different seed rates had a significant effect on germination percentage (<0.05). It is evident from these results that plant population per plot remain statistically non-significant with respect to different genotypes under different treatments except seed rate. This clearly reflects that sowing of wheat was done under appropriately and uniformly in each treatment using viable and good grade seed to maintain better seed germination and crop stand. Whereas, the interactive influence of seeding rates and genotypes was found non-significant as shown in interaction plot (Figure 2).
Table 3: Growth and Yield related traits of different wheat genotypes averaged across seed rates evaluated at Barani Agricultural Research Station, Fatehjang during 2019-20.
|
Plant traits |
Genotypes |
LSD value |
||
|
Fatehjang-2016 |
Dharabi-11 |
16FJ17 |
||
|
G.P % |
77.500a |
72.917a |
75.417a |
6.1618ns |
|
R.L |
11.982b |
12.183b |
14.101a |
0.7493** |
|
S.L |
9.6667a |
8.6417b |
9.8092a |
0.6743** |
|
C.L |
3.3275a |
2.7742c |
3.1008b |
0.2093** |
|
D.O.H 50% |
1280.00a |
117.33b |
120.83b |
3.5492** |
|
NoT |
157.83c |
374.33a |
275.17b |
7.7970** |
|
P.H |
102.58a |
68.92c |
81.08b |
5.2408** |
|
NPS |
4.1667a |
3.0833b |
3.5000b |
0.6424** |
|
1000 G.W |
46.450a |
39.792c |
44.408b |
0.9417** |
|
GPS |
38.167a |
35.583b |
37.833a |
1.1920** |
|
D.O.M |
172.08a |
149.83c |
159.33b |
3.8637** |
|
G.Y |
3501.6a |
2836.3c |
3050.1b |
103.19** |
Note: * and ** are significant and highly significant at 0.05 and 0.01 probability level, respectively; NS = Non-significant.
Although, it was non-significant still the genotype Fatehjang-2016 revealed maximum germination percentage at optimum seeding density of 120kg ha-1 (85 %), followed by 16FJ17 (80%) at same level of seeding density (Table 6). Conversely, Dharabi-11 showed lowest germination percentage (75%) proving that varying seed rates had a prominent effect on germination percentage (Table 4). The analyzed data clearly represents that germination percentage decreased with an increment in seeding density of 80, 100, 120 and 140 kg ha-1 as elucidated by (Geleta, 2017). He also found the highest mean value for germination percentage at the seeding density of 125 kg ha-1 whilst lowest mean value was observed at a higher seed rate of 200 kg ha-1. The findings of Yadav and Dhanai (2017) revealed that maximum germination percentage was obtained at a seeding level of 100 kg ha-1 in contrast to our findings we have observed a greater germination percentage at 120 kg ha-1 in all three genotypes of wheat under study. Our results are conformity with findings of Satyanarayana (2015) who also observed an increase in germination percentage with an increment in seed rate and nitrogen levels applied. He also revealed that germination percentage was greatly affected by the varied seed rates applied. Our results corroborate with the findings of (Abboye et al., 2020) who also found a highly significant effect of plant population on seed germination percentage. Our findings are marginally similar with the results of (Rai et al., 2018) who also stated that a higher germination percentage with an increase in seed rate. But our study reveals best germination percentage at 120 kg ha-1 however they reported highest germination percentage at 150 kg ha-1. The trend is quite similar but an increment in seeding density up to an optimum level shows maximum germination percentage whereas, at 140 kg ha-1 planting density the germination percentage is at par with that of 120 kg ha-1 Table 5. This divulges that farmer should practice an optimum seeding density for wheat plantation rather than high seed rates that will ultimately increase the net cost. Farmers while using poor grade seed of low viability can practice more seed rates to enhance plant population m-2.
Table 4: Growth and Yield related traits of wheat as affected by various seed rated averaged across genotypes evaluated at Barani Agricultural Research Station, Fatehjang during 2019-20.
|
Plant traits |
Seed rates (kg ha-1) |
LSD value |
|||
|
80 kg ha-1 |
100 kg ha-1 |
120 kg ha-1 |
140 kg ha-1 |
||
|
G.P % |
70.556 c |
77.778ab |
80.00 a |
72.778bc |
7.1151* |
|
R.L |
11.520a |
12.457b |
15.640a |
11.404c |
0.8652** |
|
S.L |
7.886 d |
9.890b |
10.900 a |
8.814 c |
0.7786** |
|
C.L |
2.9444bc |
3.0633 b |
3.4878 a |
2.7744 c |
0.2417** |
|
D.O.H 50% |
120.44a |
120.22a |
123.33a |
124.22a |
4.0983ns |
|
NoT |
237.22c |
273.56b |
296.89 a |
268.78 b |
9.0032** |
|
P.H |
81.778b |
84.889ab |
89.889a |
80.222b |
6.0515ns |
|
NPS |
3.1111b |
3.6667 b |
4.4444 a0 |
3.1111b |
0.7418** |
|
1000 G.W |
41.822c |
44.378b |
46.467a |
41.533c |
1.0874** |
|
GPS |
34.778c |
36.778b |
39.667a |
37.556b |
1.3765** |
|
D.O.M |
158.56b |
160.22b |
157.78b |
165.11a |
4.4615** |
|
G.Y |
2936.9c |
3133.4b |
3280.0a |
3166.9ab |
119.16** |
Values of LSD within a row are shown in parentheses for each trait is significant/ highly significant at (P≤0.05).
Present study also revealed that germination percentage has a direct relation to the plant population and ground cover, so it proves to be a crucial factor with significant impact on growth and economic yield of wheat. It is recommended to use viable seeds with excellent grade and size for each variety to enhance the germination percentage (Nik et al., 2011). For genotypes with low viability and poor grade seed, a higher than normal seed rate is usually recommended to compensate the plant population m-2 thereby promising a good economic return. It is commonly observed around the study area that farmers are now more inclined to purchase seed of novel varieties that are more adaptable to the Barani environment and have enhanced seed viability and quality (own observation). This practice has visibly improved the yield potential of wheat growers of Barani tract as well as rest of the country. Present year wheat crop recorded a high production of 27.293 million tonnes exhibiting an upsurge of 8.1 percent over last year production of 25.248 million tonnes. This was fundamentally due to a shift of agricultural policies providing farmers with an increase in minimum support price and a surge in area under cultivation (Economic Survey of Pakistan, 2020-21).
Root length
Interactive effect of seeding rates and genotypes was non-significant on root length (Table 6) however, the individual effect of seed rate on root length of various genotypes was highly significant (Figure 3). The data clearly reflects that Dharabi-11 exceeds in root length (17.64 cm) at 120kg ha-1 of seeding density. However, the root length of Fatehjang-2016 and 16FJ17 were 14.350 cm and 14.93 cm, respectively at the same seeding rate (Table 4). However, lower planting density of 100 kg ha-1 (11.543cm, 14.48 cm 11.340 cm) exhibited more root length in all three genotypes than greater seeding density of 140 kg ha-1 (10.873 cm, 11.863 cm, 11.477 cm). This clearly reflects that an optimum seeding density of 100 to 120 kg ha-1 can result in more root length than higher seed rates (Table 5). An optimal seeding level of 100 kg ha-1 will result in an ideal level of plant population m-2 that will limit the intra-plant competition for nutrients uptake. Our findings corroborate with the results of (Nik et al., 2011) who also found an enhanced root length of good grade seed at 120 kg ha-1 planting density. He also reported that seed with good size had more vigor and produced more shoot, root and coleoptile length with excellent utilization of seed reserves. Similar results were reported by (Geleta, 2017) who also reported maximum seedling root length at seeding density of 125 kg ha-1 whereas the shortest root length was observed at 200 kg ha-1 planting density. These findings show a similar trend that an optimal increase in seed rate results in enhanced root length however, an excessive planting density can negatively affect root length.
Shoot length
Shoot length of three different wheat genotypes was studied at four different regimes of sowing density. i.e., 80, 100, 120 and 140 kg ha-1 as shown in Table 6 which clearly reflects a highly significant difference in the mean values. Fatehjang-2016 revealed maximum shoot length (11.57 cm) at 125 kg ha-1 seeding density. The shoot length of Dharabi-11 (10.573 cm) was at par with 16FJ17 (10.557 cm) at the same seeding level (Table 4). It is shown that the shoot length decline with the increasing seeding density as revealed by analysis of variance. Contrarily, planting density of 100 kg ha-1 (8.70 cm, 10.71 cm, 8.52 cm) revealed more shoot length than higher planting density of 140 kg ha-1 (8.70 cm, 8.20 cm, 9.53 cm) although lesser than 120 kg ha-1 altogether (Table 5). Parallel conclusions were found by (Geleta, 2017) who also reported greater shoot length at an optimum seed rate of 125 kg ha-1 while the minimum shoot length was revealed at higher seeding density of 200 kg ha-1. This disparity among shoot length may be due to lesser plant population at lower seed rate with minimum competition for nutrients, space, and sunlight. However, Yadav and Dhanai (2017) reported different results finding maximum shoot length at greater seeding density of 150 kg ha-1 but found a significantly higher shoot length in 125 kg ha-1 than 100 kg ha-1. This might be owing to the change in agronomic practices and fertilizer level used, clearly reflecting that shoot length is significantly affected by the factors like genotype, seed rate, agronomic practices and fertilizer level. The interaction of seed rate and genotype on shoot length was non-significant as elucidated in interaction plot (Figure 4).
Coleoptile length
A clear difference was observed in coleoptile length at planting density of 125 kg ha-1 among all genotypes in study (Table 5). Among all, Fatehjang-2016 excelled in coleoptile length standing at 3.97 cm. However, 16FJ17 had more coleoptile length than Dharabi-11. It is evident from the results stated in Table 4 that Seed rate and genotype had a substantial impact on coleoptile length, but the interaction between the two parameters was not significant (Table 6). Parallel findings were stated by (Nik et al., 2011) in wheat who concluded that coleoptile length was influenced by genotype and seed size. Likewise, Shahryari et al. (2008) also found that there were substantial variations in coleoptile length between wheat genotypes. The interaction of genotype and seed rate for coleoptile length are elucidated in the interaction plot (Figure 5).
Days to 50% heading
Crop phenological events such as days to 50 % heading were substantially influenced by the genotype studied however seed rate affect was non-significant (Table 3). At seeding density of 120 kg ha-1, Fatehjang-2016 had the highest number of days to 50% heading (130 days), compared to Dharabi-11 (118 days) and 16FJ17 (121 days). Whereas, lower planting density of 100 kg ha-1 revealed an early 50% anthesis data in all three genotypes (124, 117 and 119 days) respectively (Table 6). In contrast, days to 50 % anthesis were increased in wheat grown at higher planting density of 150 kg ha-1 (Table 5). It is desired to have an early anthesis (130 days) as it will ultimately lead to an early maturity; also, a desired factor while considering the climate of Barani areas. As clearly reflected from the rainfall and average temperature graph Figure 1 that winter monsoon happens during the first few months of the year. This precipitation can eventually assist in plant growth at anthesis stage which is a critical growth stage as mentioned by (Basavaraddi et al., 2021). Our findings corroborate to those of (Abboye et al., 2020) they also stated that the seeding rate had no influence on days to 50% heading. But diverse genotypes respond differently to various seeding densities. This significant response might be attributed to the genetic variation among various genotypes (Table 4).
The data of seed rate and genotype interaction exhibited a non-significant response as explained in interaction plot (Figure 6). On contrary, Forward et al. (2019) found a significant interaction between seed rate and genotype pertaining to days to 50 % anthesis. They reported that days to 50% heading decreased with the increase in seeding density. Another research by Iqbal et al. (2010) revealed the results of heading affected by different seeding regimes. Wheat crop with early days to 50% heading have an increased risk of frost damage whereas crop that exhibits delayed heading have more risk of high temperature and water deficit. These factors can ultimately affect the grain formation and grain-filling stage of wheat (Forward et al., 2019).
Number of tillers m-2
In bread wheat tillering capacity is one of the most primary components that determines the yielding ability of any genotype. It is of significant agronomic importance because it has the capacity to compensate for differences in plant population across unoccupied spaces (Adhena, 2018). Highly significant results were found in terms of number of tillers among seed rate and genotypes (Table 3). Our results found a highly significant effect of planting density on tillering ability of all three genotypes. Highest number of tillers were found in Dharabi-11 (405 tillers/m-2) at 120 kg ha-1. However, Fatehjang-2016 produced lowest number of tillers (168 tillers m-2) at the same seeding density. 16FJ17 excelled in tillering ability from Fatehjang-2016 with 317 tillers m-2 at 120 kg ha-1 planting density (Table 6). This difference in tillering ability can be attributed to variation in genetic makeup of studied genotypes also the average spaces available per plant (Abboye et al., 2020). As indicated in the interaction plot, the interactive effect of seed rate and genotype on the number of tillers was non-significant (Figure 7). It is evident from the results that number of tillers improved with increased seed rates but upto an optimum level of 120 kg ha-1 as found by Tahir et al. (2019) (Table 5). Our findings are similar to the results of (Adhena, 2018), who also reported highest number of fertile tillers from 125 kg ha-1 planting density as compared to greater seeding density of 150 kg ha-1. Likewise, Harishankar et al. (2017), and Ayalew (2017) reported a higher number of fertile tillers at an optimum seeding density of 125 kg ha-1 in comparison to greater seeding densities of 150 and 175 kg ha-1. Naveed et al. (2016) also found a similar rise in the number of tillers with an increase in seed rate, i.e., 287 tillers m-2 at 140 kg ha-1.
Our findings contradict to those of (Chauhdary et al., 2015), who concluded that tillering capacity enhances with increased planting density in wheat. Similarly, Mekonnen (2017) also reported a higher number of tillers m-2 at 150 kg ha-1 seeding density. Tigabu and Asfaw (2016) found that lower seed densities of 75 and 100 kg ha-1 resulted in more fertile tillers, but higher seed rates of 125 and 150 kg ha-1 resulted in a smaller number of fertile tillers. These results clearly reflect that the number of tillers decreased with a higher seeding density. At increasing plant populations, this could be owing to increased intra-plant competition for nutrients, moisture, space, and light. Matsuyama and Ookawa (2020) also reported that with decreasing seed rate number of tillers also decreased. Likewise, Chauhdary et al. (2015) found a greater number of tillers (297.94 tillers m-2) at 160 kg ha-1 and lowest count for tillers (264.17 tillers m-2) were noticed at 100 kg ha-1. Our findings contradict the conclusions of (Al-Dahi and Al-Taweel, 2021), who said that a high seed rate of 300m-2 produced a greater number of tillers (396.06) however, lowest number of tillers (309.89 tillers m-2) were produced at seeding density of 20 m-2.
Plant height
Plant height is primarily influenced by the genotype’s genetic makeup and environmental conditions (Shahzad et al., 2007; Tigabu and Asfaw, 2016). According to the analysis of variance the main influence of genotype and seeding density was statistically (P < 0.05) different in response to plant height (Table 3). Fatehjang-2016 exhibited maximum plant height (110 cm) at planting density of 120 kg ha-1. Whilst 16FJ17 and Dharabi-11 revealed minimum plant height (86.33 and 73.33 cm) at same planting density (Table 6). On the other hand, in response to plant height the interaction effect of seed rate and genotype was non-significant (Figure 8). Stature of the wheat crop is primarily influenced by the genetic makeup of a genotype and environmental conditions (Forward et al., 2019). They also reported that plant height slightly increases with the seed rate but to up to an optimum level of seeding density. As with the higher seed rate plant population m-2 also increases thereby restricting plant food resources. Our findings are in agreement with those of (Basir et al., 2018), who also discovered a non-significant effect of seed rates on plant height. Rossini et al. (2020); also revealed the similar findings stating that genotype and environmental factors have a significant influence on plant height. His results were in contradiction with our findings revealing a high seeding density of 350 m-2 producing higher plants than lower seeding density of 250 m-2. Woldekiros (2020) revealed somewhat dissimilar results exhibiting an increase in plant height with higher seed rate. At a seed rate of 175 kg ha-1, maximum plant height was attained, while at a seed rate of 100 kg ha-1, shorter plant height was observed (Table 5). This might be due to more ground cover at higher plant population increasing an interspecific competition for sunlight absorption. On the contrary, our results disclose less impact of seed rate on genotype for plant height illustrating that genetic makeup of different genotypes determine their plant height in wheat. Likewise, Babu et al. (2017) also reported that maximum plant height was obtained at 150 kg ha-1 seeding density and minimum at 125 kg ha-1. Adhena (2018) revealed higher plant height at 200 kg ha-1 followed by 150 kg ha-1 seeding density. Also, Chauhdary et al. (2015) revealed non-significant difference of various sowing regimes (100, 130 and 160 kg ha-1) on wheat revealing similar plant height (91 cm). Contrarily, Twizerimana et al. (2020) found highly significant influence of seed rate on plant height. He also indicated that at a greater seed rate of 225 kg ha-1, maximum plant height was observed, while the lowest plant height was reported at 112.5 kg ha-1. This clearly illustrates the trend of higher plant height with higher seed rate in contestation with our findings where plant height was evidently influenced by genotype more than seeding density. Furthermore, Tigabu and Afaw (2016) reported diverse results revealing statistically significant impact of various seeding densities on plant height. They found maximum plant height (83.87 cm) at 75 kg ha-1 followed by 100 kg ha-1 with 79.72 cm plant height. Their findings reveal that an increment in seeding density decreased plant height.
Nodes per stem
According to the analysis of variance, seed rate and genotype both showed a highly significant (P < 0.01) effect on nodes per stem (Table 3). Highest number of nodes per stem (5 NPS) were found inn Fatehjang-2016 at seeding density of 120 kg ha-1. However, Dharabi and 16FJ17 had (4 and 4.33 NPS) at the same seeding level (Table 6). Data revealed that nodes per stem increased with the increment in seed rate up to an optimal level of 120 kg ha-1 but it declined at 140 kg ha-1 (Table 5) (Woldekiros, 2020) reported that higher seed rate result in taller plants with more nodes per stem and increased intermodal length with reduced stem thickness hence more prone to lodging. Taller plants with more nodes per stem and denser plant population heightened intra plant competition. Our results are comparable with the conclusion of (Leghari et al., 2011) who also established that 125 kg ha-1 panting density yielded a greater number of shorter nodes per stem (5.3) with enhanced plant height. However, he also reported similar number of nodes per stem (5.3) at 150 kg ha-1 which are slightly divergent from our findings.
Otteson et al. (2008) and Forward et al. (2019) also concluded that greater planting density and poor light penetration had a direct influence on plat height and intermodal length. Thereby affirming the fact that more plant height results in a greater number of nodes per stem. The interaction of seed rate and genotype on nodes per stem was found non-significant as elucidated by interaction plot (Figure 9).
1000 grain weight
Thousand grain weight is a significant yield determining feature that is said to be impacted by genetic constitution of a plant therefore less affected by environmental factors (Geleta, 2017). Different seed rate had significantly affected thousand grain weight in all genotypes. Fathejang-2016 exceeded in thousand grain weight among all genotypes understudy revealing 49.533g at 120 kg ha-1 planting density (Table 6). At 120 kg ha-1 planting density, 16FJ17 generated a greater thousand grain weight (47.30 g), which is comparable to Fatehjang-2016. However, lowest thousand grain weight (42.56 g) was revealed by Dharabi-11 at the same seeding density (Table 4). A gradual increase in 1000 grain weight has been observed in all genotypes with the increment in seeding density but up to 120 kg ha-1. Higher seeding density of 140 kg ha-1 revealed lesser 1000 grain weight (43.56g, 38.60 g and 42.5 g) that is at par with the grain weight produced at 80 kg ha-1 (45.33g, 37.5 g and 42.63 g) in all three genotypes respectively (Table 5).
Thousand kernel weight is an important quality parameter that determines grain yield and generally controlled by the genetic makeup of given genotype (Abboye et al., 2020). They also reported similar results with highly significant effect of genotypes on thousand kernel weight. However, he revealed that seed rate had no effect on the yield attribute. Our results contest with their findings stating that thousand kernel weight decreased by increasing seeding densities thus reducing plant population m-2 and interspecific competition with more photosynthesis available for grain filling ultimately enhancing thousand grain weight. Similarly, Woldekiros (2020) reported higher value for thousand kernel weight at lower seed rates. Likewise, Yadav and Dhanai (2017), reported same results with greater thousand seed weight (43 g) at 100 kg ha-1 and lowest (41 g) at 125 and 150 kg ha-1 respectively. Also Basir et al. (2018) reported that seed rate of 90 kg ha-1 revealed greater thousand grain weight in in comparison to 140 kg ha-1 that revealed lowest value for thousand grain weight in wheat.
However, our results corroborate with the conclusions of (Tahir et al., 2019) who also described greater thousand grain weight (35 g) at 100 and 125 kg ha-1 with statistically comparable results. However, lowest grain weight (33 g) was found at 175 kg ha-1 and 150 kg ha-1. Abboye and Teto (2020) also reported marginally similar results revealing high value for thousand kernel weight at 125 and 150 kg ha-1 in different genotypes. Although, wheat quality and higher kernel weight were not influenced by the higher seed rates. Twizerimana et al. (2020) reported somewhat similar results stating higher thousand kernel weight at 112.5 kg ha-1 while the lesser value was noticed in 187.5 kg ha-1. Al-Dahi and Al-Taweel (2021) reported a statistically significant effect of genotype and non-significant effect of seed rates on thousand kernel weight. Our findings are somewhat similar with the conclusions of (Chauhdary et al., 2015) who noticed heaviest thousand kernel weight at 100 kg ha-1 and lightest at 160 kg ha-1. The key is to find an optimum plant density with uniform distribution and efficient utilization of available resources. Higher plant population may produce fewer kernels per head and lower seed weight (Forward et al., 2019). Our conclusions affirm the results of (Babu et al., 2017) who revealed a higher thousand grain weight at 125 kg ha-1 seeding density that is substantially greater than grain weight produced at 150 and 100 kg ha-1. Interaction plot is elucidated in Figure 10 revealing non-significant interaction for 1000 grain weight among genotypes and seed rates.
Number of grains per spike
The number of grains per spike is an important factor in influencing wheat production in terms of yield. The analysis of variance reveals a highly significant influence of seed rate and genotype on number of grains per spike (Table 3). A greater value for grains number per spike (41) was observed in Fatehjang-2016 that is at par with 16FJ17 (40) at 120 kg ha-1 seeding density followed by Dharabi-11 with 38 grains per spike at same seeding level (Table 6). As indicated in the interaction plot, the interaction between seed rate and genotype was not significant (Figure 11). An increment in seed rates revealed higher number of grains per spike but up to an optimum level of 125 kg ha-1. The data reveals slightly similar response of varieties at 100 and 150 kg ha-1 seeding density revealing that higher seed rates negatively affect this trait (Table 5). Shah et al. (2016) also reported parallel results observing a significant impact of seed rates on grains per spike. They also reported that highest number of grains per spike were achieved at 120 kg ha-1 seeding level. However, lowest grain per spike was obtained at 60 kg ha-1. Our conclusions are in consonance with the results of (Yadav and Dhanai, 2017) who also reported a greater value for grains per spike at 100 and 125 kg ha-1 in contrast to 150 kg ha-1. Tahir at al. (2019) observed similar results, finding a higher number of grains per spike at 125 kg ha-1 seeding density, while the lowest number of grains per spike was reported at 175 kg ha-1, following the same trend as this study. Our conclusions are in full agreement with the results of (Basir et al., 2018) they also stated greater value for grains per spike at 120 kg ha-1 seeding rate when sown early (November 5). Marginally similar findings were described by (Akhter et al., 2017) who also observed an increase in grain number per spike as seed rate increased. They also revealed greater value of grains per spike at 140 kg ha-1, which is statistically comparable to the number of grains found at 120 kg ha-1. Twizerimana et al. (2020) observed slightly similar results, with the largest kernel per spike at 112.5 kg ha-1 seed rate and the lowest at 225 kg ha-1 seed rate.
Contrarily, highest number of grains per spike were reported by (Woldekiros, 2020) at 100 kg ha-1 seeding level whereas the lowest kernel number was recorded at 175 kg ha-1. Also, Abboye et al. (2020) revealed an increase in kernel per spike as seed rate increased may be due to more plant population per m-2 and a greater number of spikes and spikelet. But he also reported a decline in kernel number per spike with increasing seed size. Our study is in conflict with the findings of (Tigabu and Asfaw, 2016) who stated non-significant influence of seeding density on kernel per spike. Likewise, in terms of grain number per spikelet, (Matsuyama and Ookawa, 2020) found a substantial relationship between seed rate and cultivars. Where grain number achieved was 5% higher at seeding density of 60 seed m-2 contrary to 180 seeds m-2. Our results contest with the findings of (Al-Dahi and Al-Taweel, 2021) who as well stated that higher kernel number per spike was recorded at 200 seed m-2 level of seeding density however lowest was found at 250 seed m-2. According to Chauhdary et al. (2015) a larger number of seed per spike was observed when sowed at a seed rate of 100 kg ha-1, while the lowest was found at a seeding density of 160 kg ha-1.
Days to maturity
With respect to days to maturity, analysis of variance exhibited a highly significant effect of seed rate and genotype (Table 3). However, interactive effect of seed rate and genotype was non-significant as shown in interaction plot (Figure 12). Highest value for days to maturity (172.67 days) was found in Fatehjang-2016 when sown at 120 kg ha-1 seeding density. However, lowest value for days to maturity (147.67 days) was found in Dharabi-11 at same seeding level (Table 4). 16FJ17 was stood at (153 days) at 120 kg ha-1 planting density. The data shown in Table 6 reveals that days to maturity increased with increasing seed rate which may be due to genetic makeup of the variety as well with the high plant density the intra plant competition increases for available resources. It is evident that an optimal raise in seed rate results in high days to maturity. Keeping in view the climate and weather conditions of the study area it can be seen that best crop harvesting time is after winter monsoon (April-May). Fatehjang-2016 took nearly 170 to 175 days to mature which is best time for harvesting and threshing. Abboye and Teto (2020), confirmed similar results, finding a highly significant influence of seed rate and genotype on days to maturity. Our results are in partial agreement with those of (Abboye et al., 2020) who also found a highly significant influence of genotype on days to maturity however seed rate affect was non-significant. Laghari et al. (2011) also reported that maximum number of days to maturity were revealed when sown at 125 kg ha-1 seeding level. He also found that with increasing seed rate the days to maturity increased.
Grain yield
In wheat higher grain yield is an ultimate goal towards which all efforts are focused. Data of analysis of variance exhibit a highly significant influence of seed rate and genotype on grain yield (Table 3). At a seeding density of 120 kg ha-1, all genotypes produced better grain yields. However, maximum grain yield (3755.7 kg ha-1) was obtained in genotype Fatehjang-2016 when grown at 120 kg ha-1. Dharabi-11 (2931.7 kg ha-1) had the lowest grain yield at 120 kg ha-1, while 16FJ17 had 3152 kg ha-1 grain yield at the same planting density (Table 6). The interaction among genotype and seed rate was non-significant in terms of grain yield (Figure 13). Comparable results were reported by (Babu et al., 2017) who obtained highest grain yield at 125 kg ha-1 seeding density. Also, similar trend was observed by (Ayalew, 2017) stating decline in grain yield with increasing seed rate. He also concluded that 125 kg ha-1 seeding density produced higher grain yield while lowest at 175 kg ha-1. Our findings are in consonance with the results of (Al-Dahi and Al-Taweel, 2021) who also stated that highest grain yield was observed at seeding level of 250 seeds m-2 in all genotypes understudy. Abboye and Teto (2020) reported slightly similar results finding a significant influence of genotype on grain yield. Therefore, they recommended a variety specific seed rate owing seed size. For medium 125 kg ha-1 is an optimum seed rate. However, seeds with smaller size should be planted at a higher seeding density of 150 and 175 kg ha-1. Our findings are consistent with those of (Shah et al., 2016), who showed that the maximum grain yield (3460 kg ha-1) was obtained at 120 kg ha-1 seed rate, while the minimum grain yield was observed at 60 kg ha-1 seed rate. Our results affirm the findings of (Akhter et al., 2017) who also reported a maximum grain yield at 140 kg ha-1 while 120 kg ha-1 seeding density produced statistically comparable grain yield. Our arguments are further confirmed by (Basir et al., 2018) also stated that greater bio-yield and grain yields were highest at 120 kg ha-1 seed rate, and lowest at 140 kg ha-1 seeding density. The reason for statistically higher yields at 120 kgha-1 is due to maintenance of an optimum plant population therefore improving effective utilization of available nutrients, solar radiation and proper translocation of photosynthates to the sink. Quite similar findings were revealed by (Harishankar et al., 2017) who also obtained higher grain yield at 150 kg ha-1 which was statistically comparable with seed rate of 125 kg ha-1. Tahir et al. (2019) also found the best grain production at 125 kg ha-1 sowing level. Seed rate plays a fundamental role in wheat grain yield and quality.
The present findings contrast from those of (Forward et al., 2019), who found that the major influence of seed rate on grain production was non-significant. They achieved higher grain yield at 32 g/plot i.e., less than 80 kg ha-1. Our findings contradict with those of (Adhena, 2018), who stated that the best grain yields were observed at 150 and 175 kg ha-1, whereas the lowest yields were observed at 125 kg ha-1. They found a 16% increase in yield when grown at 150 kg ha-1 over 125 kg ha-1. Our findings contradict with those of (Mekonnen, 2017), who reported the maximum grain output at 150 kg ha-1 and the lowest at 100 kg ha-1. Similarly, Chauhdary et al. (2015) found that seeding density of 160 kg ha-1 produced better grain production than seeding density of 100 kg ha-1. Abboye et al. (2020) found maximum grain yield at high seeding level of 300-400 seeds m-2 in different varieties. Our findings differ from those of (Woldekiros, 2020), who reported a maximum grain production of 150 kg ha-1, possibly due to increased plant density. Planting density greatly affects the yield associated traits in wheat (Zecevic et al., 2014). Our findings are in contrast with the study of (El-Hendawy, 2016) who reported that seed rate of 250-350 germinating seeds m-2 is recommended for maintaining a sufficient number of good and healthy spikes accompanied with ample yield and quality structure.
Conclusions and Recommendations
The findings of this research clearly reflect that the plantation of wheat (spring) in Barani Areas of Punjab Province with an optimum seed rate of 120 kg ha-1 results in higher yield index and quality, thereby enhancing the economic returns to the farmer with less expenditure on inputs.
In the light of research results the genotype Fatehjang-2016 performed best at seeding density of 120 kg/ha. It excelled in several growth and yield related attributes including germination percentage (85%), shoot length (11.57 cm), coleoptile length (3.97 cm), days to 50% heading (130 days), plant height (110 cm), nodes per stem (5.0), 1000 grain weight (49.53 g), grain per spike (41.0), days to maturity (172.67 days) and grain yield (3755 kg ha-1) from other genotypes. Therefore, an optimum seed rate of 120 kg/ha is highly recommended for obtaining enhanced yield in wheat genotype Fatehjang-2016 for Barani Areas.
Acknowledgments
We highly praise, acknowledge and applaud all the efforts made by the scientists of Barani Agricultural Research Station, Fatehjang and our dear colleagues from various other esteemed institutions for their untiring efforts and contribution in preparation of this research article.
Novelty Statement
Information about the Impact of seed rates on d/f wheat genotypes has been presented in the paper which was not previously studied
Author’s Contribution
Amina Batool: Prepared write-up of the research paper and conducted field trials.
Saba Aleem: Helped in data analysis of various traits and paper review etc.
Ali Nawaz: Provided guidance for execution of this research experiment.
Muhammad Imran Khan: Helped in collecting data for various traits.
Waheed Arshad: Helped in data analysis and write up of this paper.
Muhammad Aslam: Captiously evaluated the manuscript and made amendments.
Shiraz Ali: Critically reviewed the manuscript for revision.
Muhammad Zeeshan: Helped the author in write-up of the paper.
Conflict of interest
The authors have declared no conflict of interest.
References
Abboye, A.D., A. Megresa and D. Hirpa. 2020. Effect of plant population on growth, yields and quality of bread wheat (Triticum aestivum L.) varieties at Kulumsa in Arsi Zone, South-Eastern Ethiopia. Int. J. Res. Std. Agric. Sci., 6(2): 32-53. https://doi.org/10.20431/2454-6224.0602005
Abboye, A.D., and A.M. Teto. 2020. Response of seed rates and row spacing on growth, yield and yield components of wheat (Triticum aestivum L.) crop. J. Nat. Sci. Res., 10(3): 28-36.
Adhena, M.S., 2018. Effects of blended fertilizer and seed rates on yield and nitrogen and phosphorus use efficiency of bread wheat (Triticum aestivum L.) at Ofla district, northern Ethiopia. M.Sc. thesis University of Gondar College of Agriculture and Rural Transformation. Gondar, Ethiopia.
Agriculture Statistics of Pakistan, 2020-21. Federal Bureau of Statistics, Statistics Division 17. Islamabad Pakistan.
Ahmad, S., Z. Khan., H. Rahim., M.A. Khan, Usman and M. Haris. 2018. Different tillage practices and seed rates affected phenology and various growth stages of wheat. Agric. Res. Tech., 14(5): 555-939.
Akhter, M.M., A.E.L. Sabagh M.N. Alam, M.K. Hasand, E. Hafez, C. Barutçularc, and M.S. Islam. 2017. Determination of seed rate of wheat (Triticum aestivum L.) varieties with varying seed size. Sci. J. Crop Sci., 6(3): 161-167.
Al-dahi, W.T., and M.S. Al-Taweel. 2021. The effect of sowing dates and seed rates on new inputs of Durum Wheat under drought conditions. Euphrates J. Agric. Sci., 13(2): 33-43.
Analytical Software, 2005. Statistix 8.1 user’s manual, Tallahassee, Florida.
Ayalew, T., 2017. Response of wheat (Tritium aestivum L.) to variable seed rates: The case of Hawassa area, Southern Ethiopia. Afr. J. Agric. Res., 12(14):1177-1181.
Ayalew, T., B. Abebe and T. Yoseph. 2017. Response of wheat (Tritium aestivum L.) to Variable seed rates: The case of Hawassa Area, Southern Ethiopia. Afr. J. Agric. Res., 12: 1177-1181.
Babu, R., S.K. Kakraliya, L. Prakash, P. Kumar and R.A. Yadav. 2017. Effect of plant geometry and seed rates on growth, yield attributes, productivity as well as weed dynamics of wheat (Triticum aestivum L.). Int. J. Curr. Microbiol. App. Sci., 6(3): 81-88. https://doi.org/10.20546/ijcmas.2017.603.008
Basavaraddi, P.A., R. Savin, S. Bencivenga, S. Griffiths, and G.A. Slafer. 2021. Wheat developmental traits as affected by the interaction between Eps-7D and temperature under contrasting photoperiods with insensitive Ppd-D1 background. Plants, 547(10): 1-15. https://doi.org/10.3390/plants10030547
Basir, A., A. Tahir, K. Afridi, S. Fahad, Z. Ahmad, M. Adnan, M. Alam, S. Shah, A. Khan, F. Wahid, M. Ibrahim, I. Rahman, M.A. Khan and R. Ali. 2018. Optimization of sowing time and seed rates can enhance wheat yield in semi-arid environment. Philipp. Agric. Sci., 101(4): 326-332.
Chauhdary, J.N., U.D. Khan, S.H.H. Shah, M.A. Shahid and M. Arsalan. 2016. Effect of sowing methods and seed rates on wheat yield and water productivity. Qual. Assur. Saf. Crop. Foods, 8(2): 267-272. https://doi.org/10.3920/QAS2015.0685
El-Hendawy, S., 2016. Optimal coupling combinations between irrigation and seeding rates for improving production and water use efficiency of wheat grown under arid conditions. J. Plant Prod. Sci., 5: 1-11. https://doi.org/10.21608/jpps.2016.7390
Eshete, Y., B. Alamirew and Z. Bishaw. 2021. Yield and cost effects of plot-level wheat seed rates and seed recycling practices in the east Gojam Zone, Amhara Region, Ethiopia: Application of the Dose–Response Model. Sustainability, 3793(13): 1-14. https://doi.org/10.3390/su13073793
Food and Agriculture Organization of the United Nations, 2020. FAOSTAT Statistical Database. Rome: FAO, 2020.
Forward, B., M. Lawrence and K.A. Tapiwa. 2019. Effect of varying seed rates on yield performance of winter wheat cultivars. Int. J. Agric. Agric. Bus., 4(2): 133-138.
Geleta, T., 2017. Seed rate and sowing method effects on seed quality of bread wheat (Triticum aestivum L.) varieties in Horo District, Western Ethiopia. Malays. J. Med. Res., 4(2): 117-128. https://doi.org/10.18034/mjmbr.v4i2.436
Gomez, K.A. and A.A. Gomez. 1984. Statistical procedure for agricultural research. 2nd edition. 680. Wiley Publishers, New York, USA.
Economic Survey of Pakistan. 2020-21. Ministry of Food, Agriculture and Livestock, Government of Pakistan, Statistics Division (Economic Wing), Islamabad 2017-18, p. 23.
Grote, U., A. Fasse, T.T. Nguyen and O. Erenstein. 2021. Food security and the dynamics of wheat and maize value chains in Africa and Asia. Front. Sustain. Food Syst., 4: 317. https://doi.org/10.3389/fsufs.2020.617009
Habte, D., 2017. Technical manual, Volume 1, planning and management of field experiments in agricultural research. Ethiopian Institute of Agricultural Research, Addis Ababa, Ethiopia. pp. 99-100.
Harishankar, G., P. Pali and G.S. Tomar. 2017. Growth and yield of wheat (Triticum aestivum L.) As influenced by methods of sowing and seed rates. Progr. Res. Int. J., 12(3): 401-403.
Herwaarden, A.V., H.G. Macpherson, H.M. Rawson, J.A. Kirkegaard, K.J. Bligh, and W.K. Anderson. 2003. On-farm trials for adapting and adopting good agricultural practices. Food Agric. Org. U. N. Rome.
Iqbal, N., N. Akbar, M. Ali, M. Sattar and L. Ali. 2010. Effect of seed rate and row spacing on yield and yield components of wheat (Triticum aestivum L.). J. Agric. Res., 48(2): 151-156.
Jemal, A., T. Tana and F. Eticha. 2015. Response of bread wheat (Triticum aestivum L.) varieties to seeding rates at Kulumsa, Southeastern Ethiopia. Asian J. Plant Sci., 14(2): 50-58. https://doi.org/10.3923/ajps.2015.50.58
Laghari, G.M., F.C. Oad, S. Tunio, Q. Chachar, A.W. Ghandahi, M.H. Siddiqui, S.W. Hassan and A. Ali. 2011. Growth and yield attributes of wheat at different seed rates. Sarhad J. Agric., 27: 177-183.
Matsuyama, H., and T. Ookawa. 2020. The effects of seeding rate on yield, lodging resistance and culm strength in wheat. Plant Prod. Sci., 23(3): 322-332. https://doi.org/10.1080/1343943X.2019.1702469
Mekonnen, A., 2017. Effects of seeding rate and row spacing on yield and yield components of bread wheat (Triticum aestivum L.) in Gozamin. J. Biol. Agric. Healthc., 7(4): 19–37.
Minitab. 2010. Minitab 17 statistical software. State college, PA: Minitab.
Muller, J., 1991. Determination of leaf area by means of linear measurements in wheat and triticale (Brief report). Arch. Fuchtungsforschung, 21: 121-123.
Naveed, K., M.A. Khan, M.S. Baloch and K. Ali. 2016. Effect of different seeding rates on yield attributes of dual-purpose wheat. Sarhad J. Agric., 30(1): 83-91.
Nik, M.M., M. Babaeian and A. Tavassoli. 2011. Effect of seed size and genotype on germination characteristic and seed nutrient content of wheat. Sci. Res. Essay, 6(9): 2019-2025. https://doi.org/10.5897/SRE11.621
Otteson, B.N., M. Mergoum and J.K. Ransom. 2008. Seeding rate and nitrogen management on milling and baking quality of hard red spring wheat genotypes. Crop Sci., 48: 749-755. https://doi.org/10.2135/cropsci2007.08.0473
Ozturk, A., O. Caglar and S. Bulut. 2006. Growth and yield response of facultative wheat to winter sowing, freezing sowing and spring sowing at different seeding rates. J. Agron. Crop Sci., 192: 10-16. https://doi.org/10.1111/j.1439-037X.2006.00187.x
Rai, A.K., J.P. Dixit, J.M. Sharma, D. Gaur and D.K. Paliwal. 2018. Effect of wheat (Triticum aestivum L.) varieties under fertility levels and seed rates on growth and economics of crop plant. J. Pharmacogn. Phytochem., 7(2): 3742-3747.
Rossini, F., M.E. Provenzano, L. Kuzmanovi´c, C. Ceoloni and R. Ruggeri. 2020. Assessing the ability of durum wheat-thinopyrum ponticum recombinant lines to suppress naturally occurring weeds under different sowing densities. Agronomy, 709(10): 1-19. https://doi.org/10.3390/agronomy10050709
Satyanarayana, M., 2015. Response of different wheat (Triticum aestivum L.) varieties to graded levels of nitrogen - a critical review. Int. J. Appl. Biol. Pharm. Technol., 6(3): 241-248.
Shah, W.A., Z. Hayat, R. Amin, S. Anwar, M. Islam, Anjum and Ikramullah. 2016. Effect of irrigation levels and seed rates on wheat production. Pure Appl. Biol., 5(4): 895-905. https://doi.org/10.19045/bspab.2016.50113
Shahryari, R., E. Gurbanov, A. Gadimov and D. Hassanpanah. 2008. Tolerance of 42 bread wheat genotypes to drought stress after anthesis. Pavlov. P. J. Biol. Sci., 11(10): 1330-1335. https://doi.org/10.3923/pjbs.2008.1330.1335
Shahzad, M.A., W.U. Din, S.T. Sahi, M.M. Khan, Ehsanullah and M. Ahmad. 2007. Effect of sowing dates and seed treatment on grain yield and quality of wheat. Pak. J. Agric. Sci., 44(4): 581-583.
Smith, P.G. and A.H. Millet. 1964. Germinating and sprouting responses of tomato at low temperature. J. Am. Soc. Hortic. Sci., 84: 480-484.
Tahir, S., A. Ahmad, T. Khaliq and M.J.M. Cheema. 2019. Evaluating the Impact of Seed Rate and Sowing Dates on Wheat Productivity in Semi-arid Environment. Int. J. Agric. Biol., 22(1).
Tigabu, R., and F. Asfaw. 2016. Effects of seed rate and row spacing on yield and yield components of bread wheat (Triticum aestivum L.) in Dalbo Awtaru Woreda, Wolaita Zone, Southern Ethiopia. J. Biol. Agric. Healthc., 6(7): 58-67.
Twizerimana, A., E. Niyigaba, I. Mugenzi, W.A. Ngnadong, C. Li, T.Q. Hao, B.J. Shio and J.B. Hai. 2020. The combined effect of different sowing methods and seed rates on the quality features and yield of winter wheat. Agriculture, 10(5):153-173. https://doi.org/10.3390/agriculture10050153
Ulaş, B., H. Cakan and H. Özkan. 2018. Wheat. In: (ed. S.L. López Varela). The encyclopedia of archaeological sciences. Wiley-Blackwell, Chinchester, pp. 500-506. https://doi.org/10.1002/9781119188230.saseas0608
Venske, E., R.S. Dos Santos, C. Busanello, P. Gustafson, and A. Costa de Oliveira. 2019. Bread wheat: A role model for plant domestication and breeding. Hereditas, 156: 16. https://doi.org/10.1186/s41065-019-0093-9
Woldekiros, B., 2020. Effects of row spacing and seed rate on yield and yield components of bread wheat (Triticum aestivum L.) in mid altitude of Sankura District, South Ethiopia. Int. J. Res. Agric. For., 7(1): 10-13.
Yadav, M.S., and C.S. Dhanai. 2017. Effect of different doses of nitrogen and seed rate on various characters and seed yield of wheat (Triticum aestivum L.). J. Pharmacogn. Phytochem., 6(2): 1-5.
Zecevic, V., J. Boskovic, D. Knezevic and D. Micanovic. 2014. Effect of seeding rate on grain quality of winter wheat. Chil. J. Agric. Res., 74: 23-28. https://doi.org/10.4067/S0718-58392014000100004
To share on other social networks, click on any share button. What are these?