
Evaluating the Impact of Variable Seed Rates on Growth, Productivity and Yield attributes of different Wheat (Triticum aestivum L.) Genotypes of Barani Areas


Evaluating the Impact of Variable Seed Rates on Growth, Productivity and Yield attributes of different Wheat (Triticum aestivum L.) Genotypes of Barani Areas
Amina Batool1*, Saba Aleem1, Ali Nawaz1, Muhammad Imran Khan1, Waheed Arshad1, Muhammad Aslam2, Shiraz Ali3 and Muhammad Zeeshan3
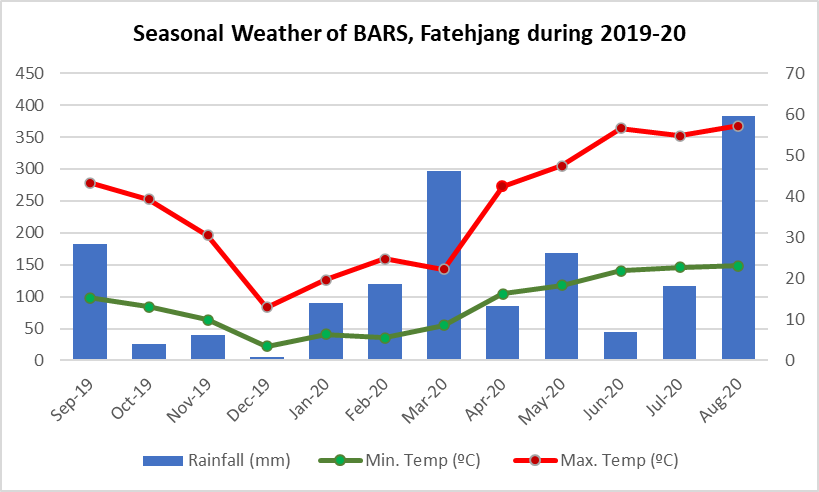
Seasonal weather of Barani Agricultural Research Station, Fatehjang during 2019-20.
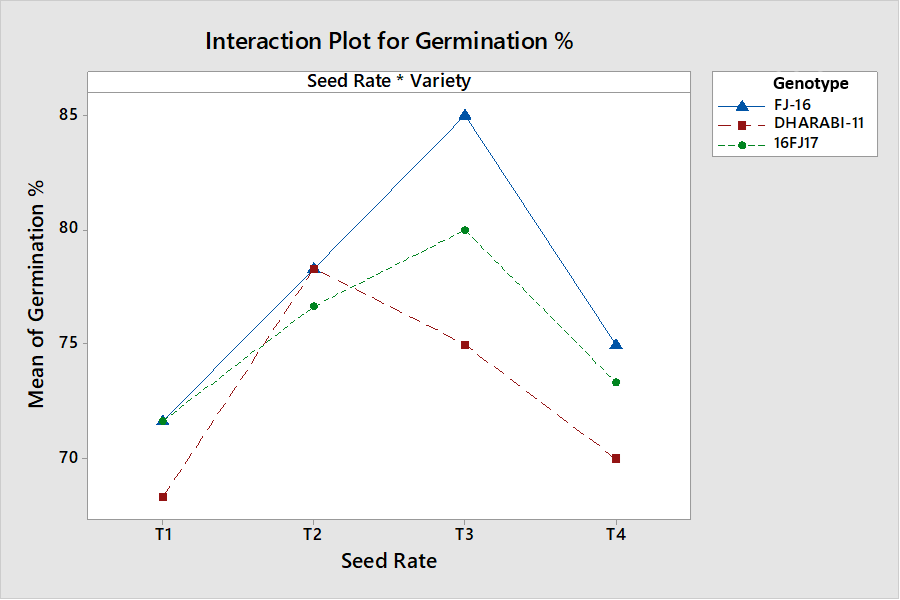
Interactive effects of seed rate and genotypes on germination percentage.
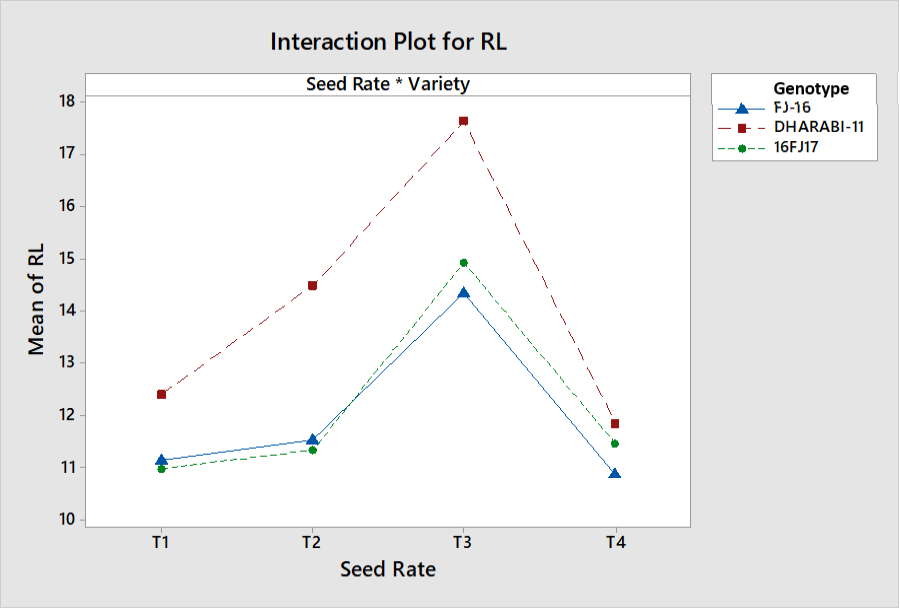
Interactive effects of seed rate and genotypes on root length.
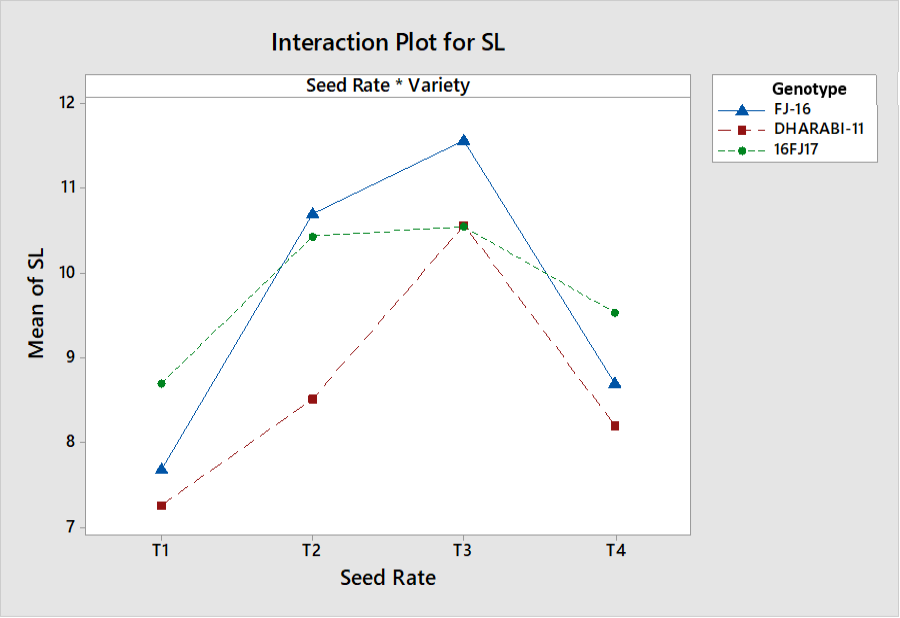
Interactive effects of seed rate and genotypes on shoot length.
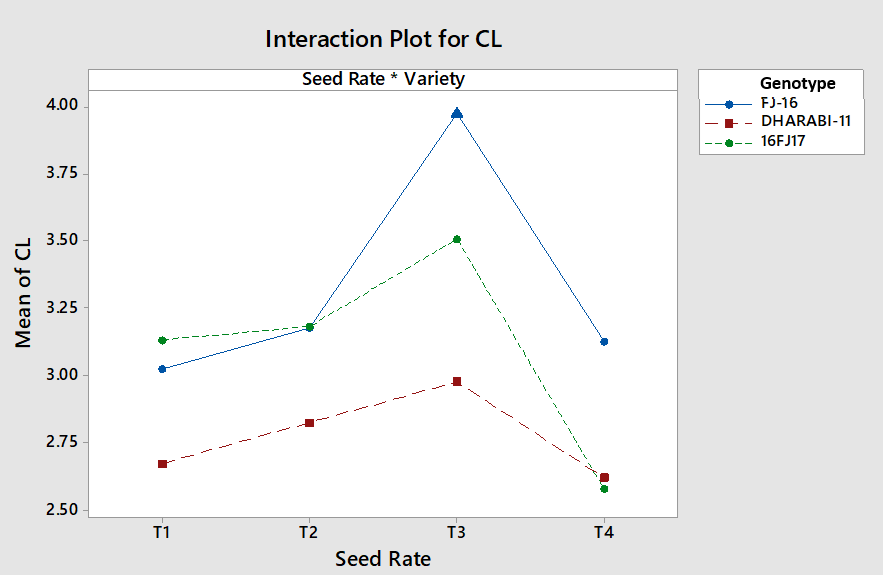
Interactive effects of seed rate and genotypes on coleoptile length.
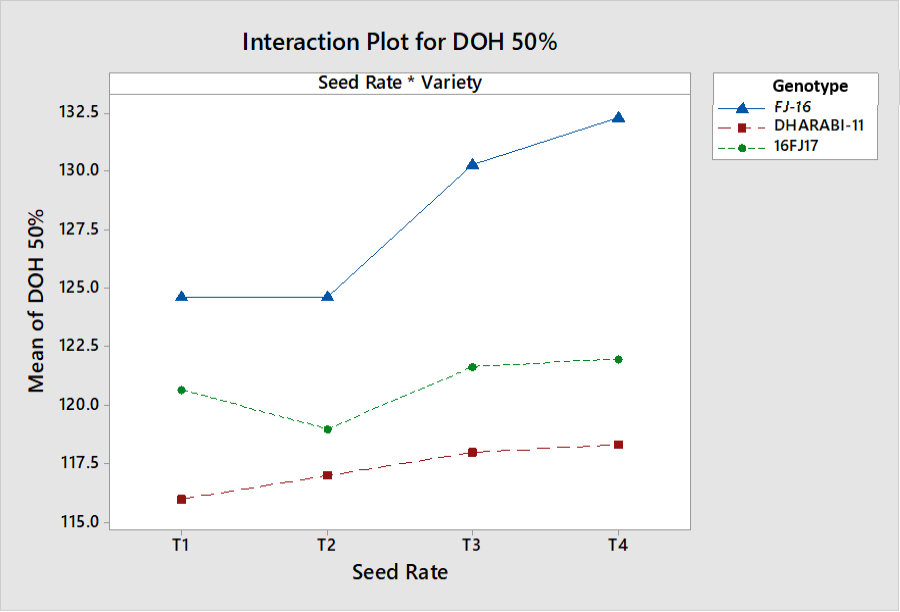
Interactive effects of seed rate and genotypes on Days to 50% heading.
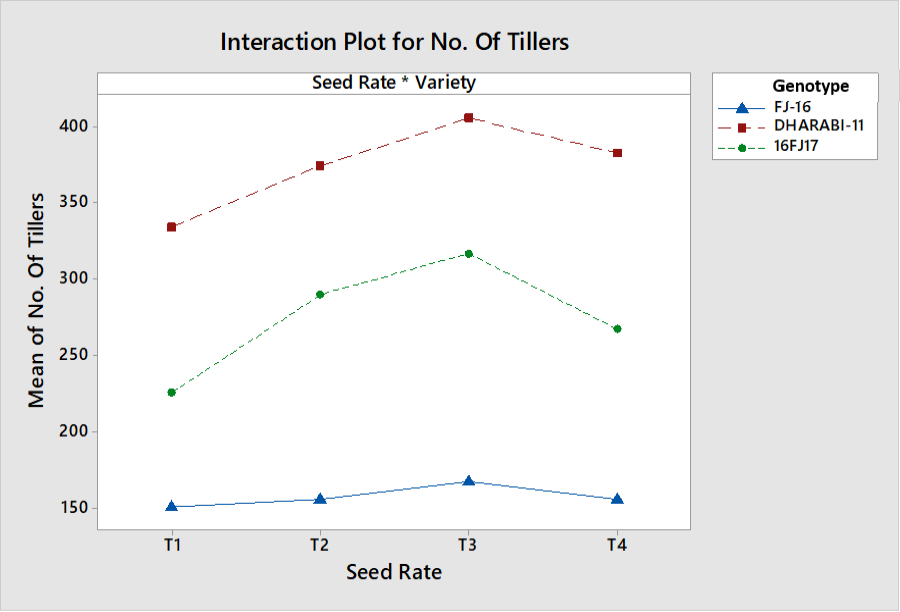
Interactive effects of seed rate and genotypes on number of tillers.
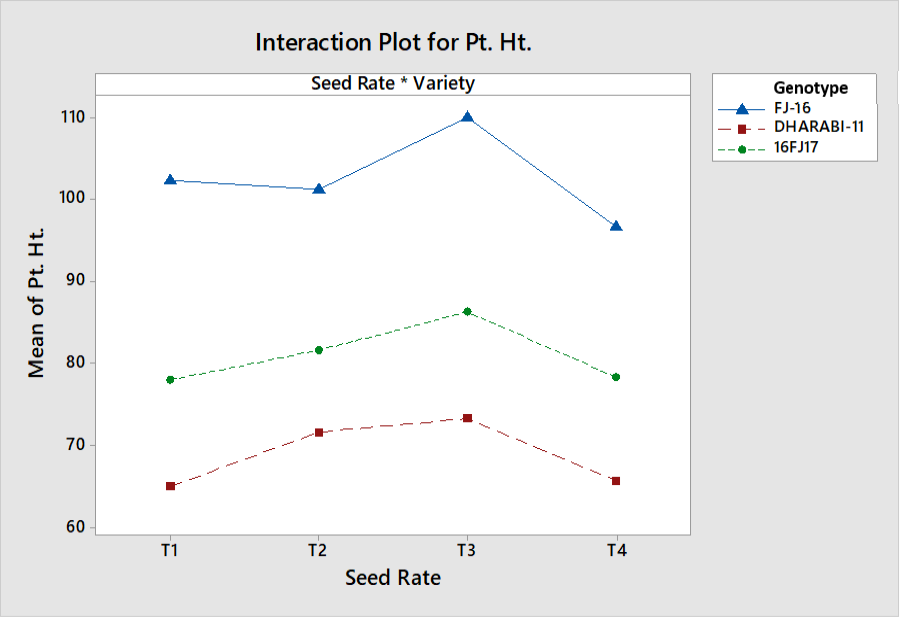
Interactive effects of seed rate and genotypes on plant height.
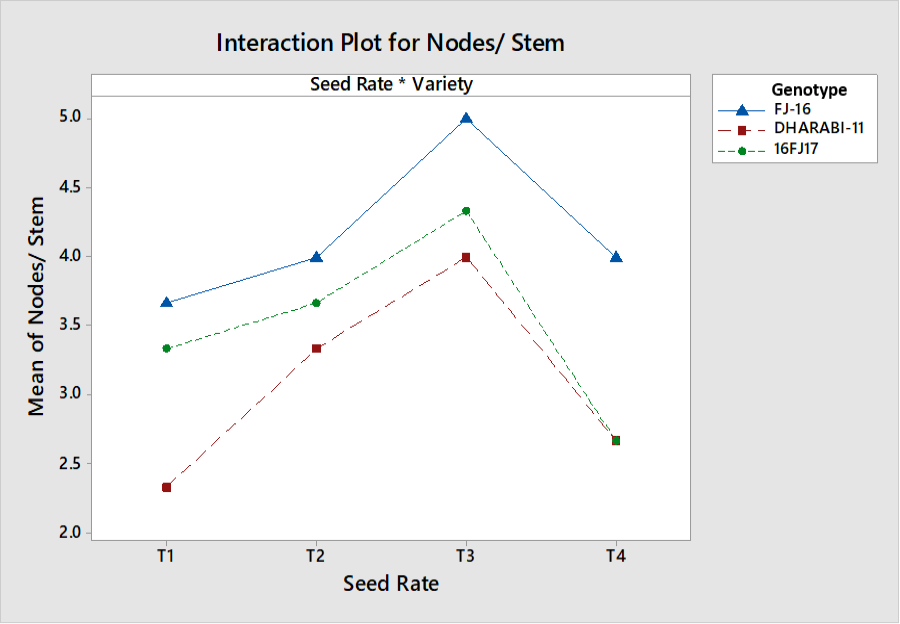
Interactive effects of seed rate and genotypes on nodes per stem.
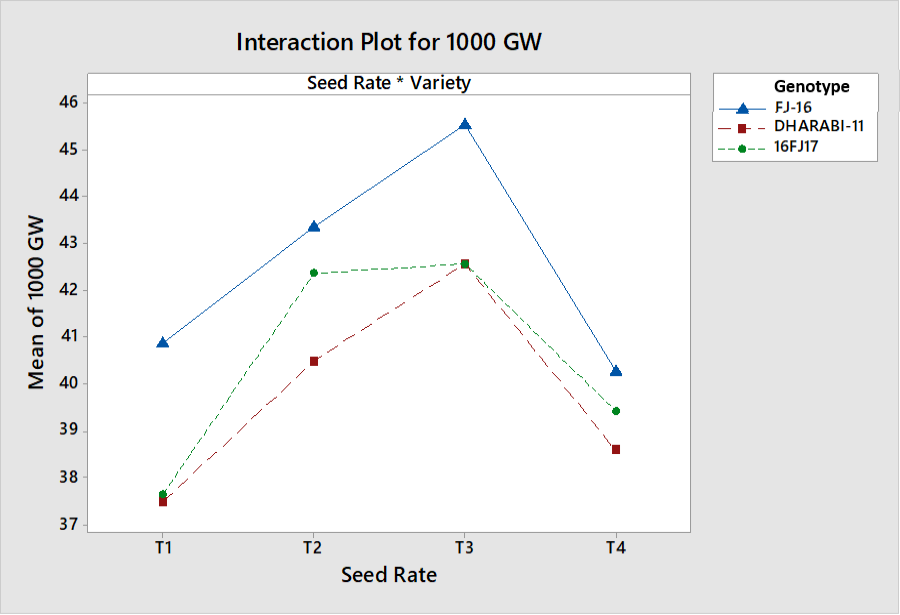
Interactive effects of seed rate and genotypes on 1000 grain weight.

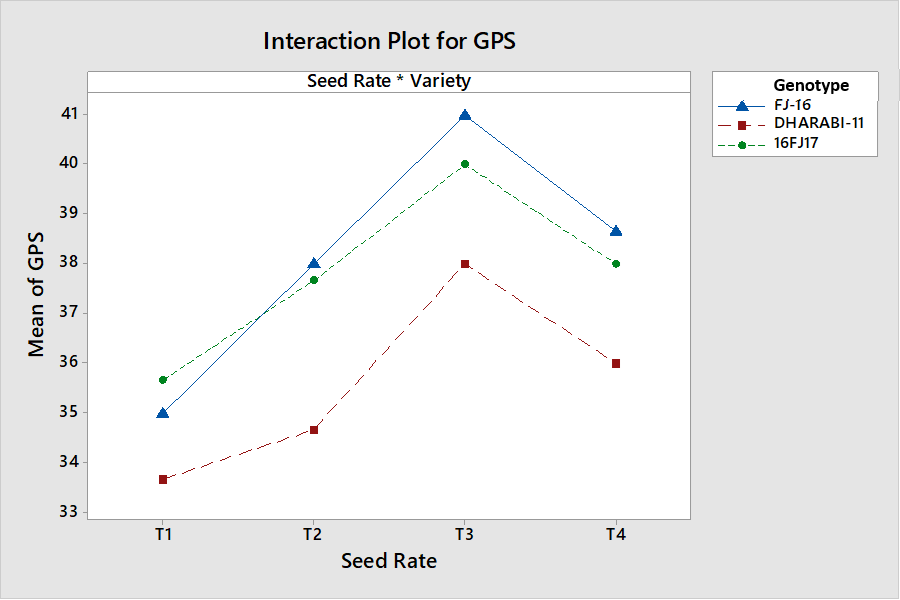
Interactive effects of seed rate and genotypes on grain per spike.

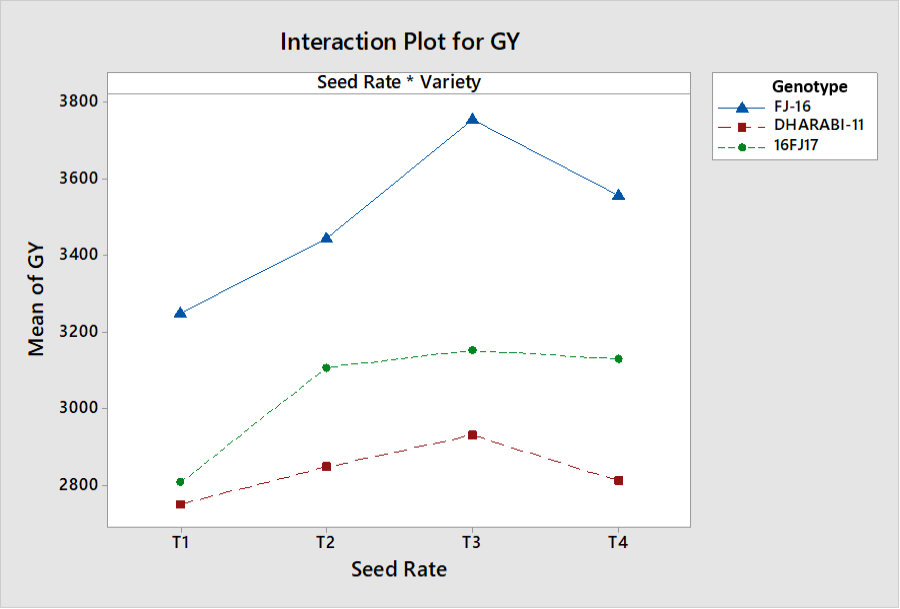
Interactive effects of seed rate and genotypes on grain yield.


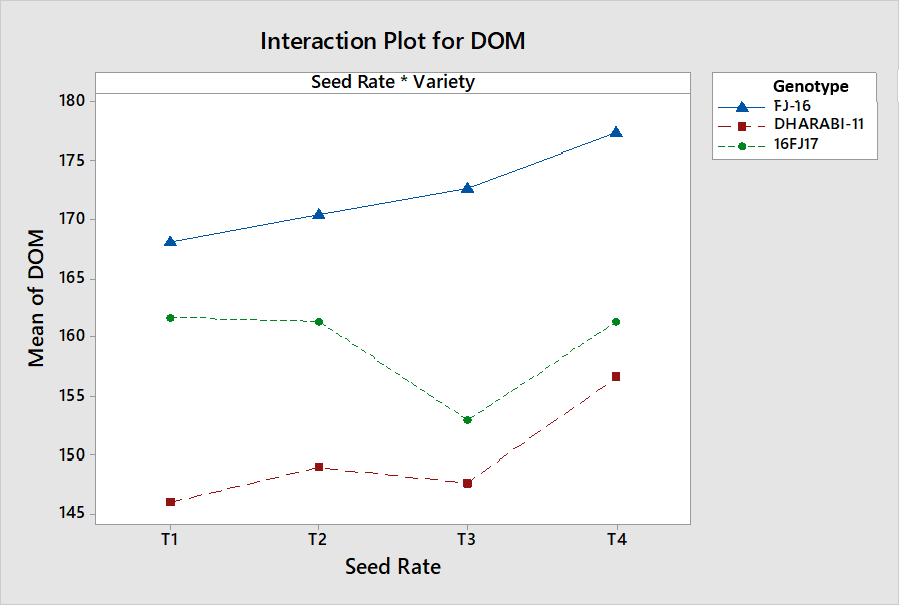
Interactive effects of seed rate and genotypes on days to maturity.
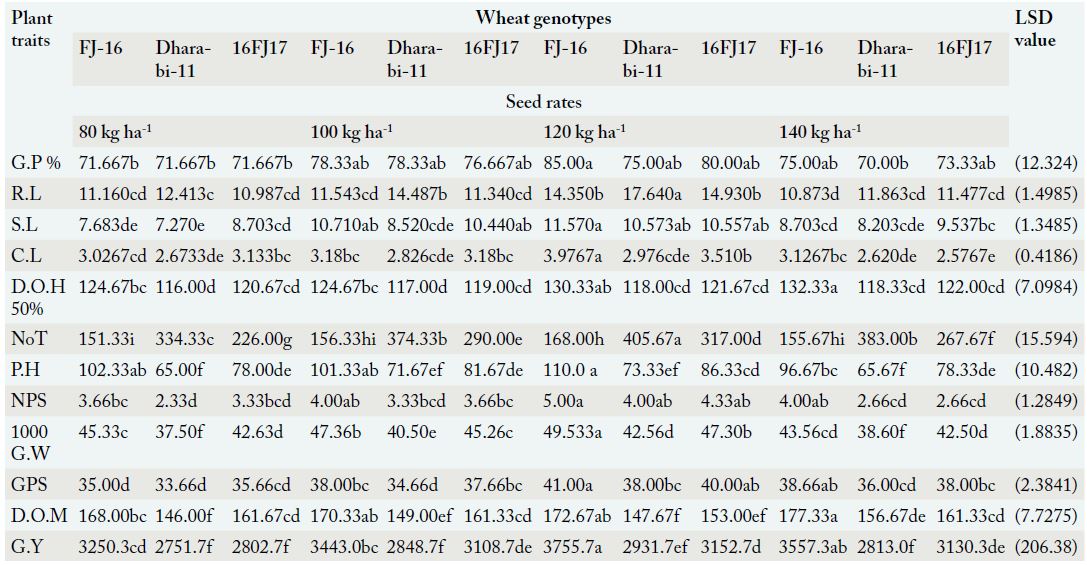
Interactive effect of seed rate and genotypes on growth and yield related traits evaluated at Barani Agricultural Research Station, Fatehjang during 2019-20.
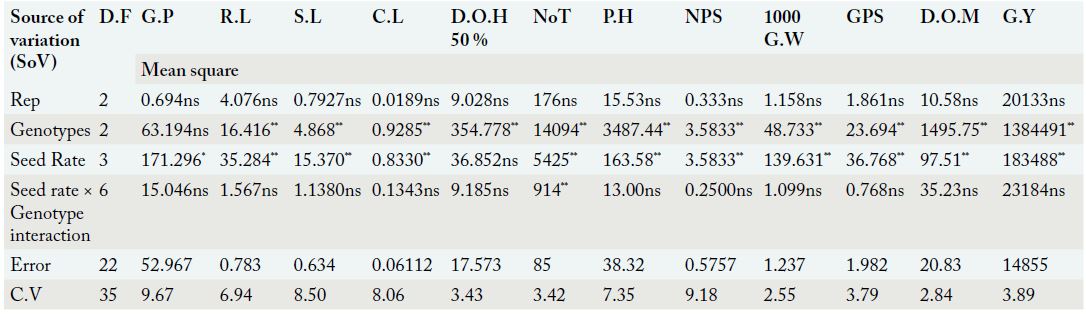
Analysis of variance for the wheat growth and yield traits as affected by seed rate, genotype and their interactions for the field experiments conducted in 2019-20.

