
Estimation of Crop Water Demand for Rice by the FAO Penman Monteith Evapotranspiration Model


Research Article
Estimation of Crop Water Demand for Rice by the FAO Penman Monteith Evapotranspiration Model
Phan Truong Khanh* and Tran Thi Hong Ngoc
Faculty of Environment Technology Engineering, An Giang University, Vietnam National University, Ho Chi Minh City, Vietnam.
Abstract | An Giang is one of the most important rice producing provinces in Vietnam. However, while water is generally abundant, some parts of the province experience seasonal water shortages. This, coupled with the increasing frequency and severity of droughts, perhaps linked to climate change, is impacting adversely on rice production. The overall purpose of the study is planning of irrigation scheduling, it requires information of precise quantity of water needed by crop in a certain set of meteorological condition of the region. Moreover, determination of water requirement for crop is a first stage in the design, operation and planning of irrigation schemes to ensure adequate water is available to meet agricultural needs. In this work we use the FAO-Penman-Monteith Evapotranspiration Model to calculate evapotranspiration of rice harvests in the province of An Giang, Vietnam, and evaluating the entire water demand for the production of rice in the year 2020. The results showed that the value ET0 for rice in An Giang province ranged from 3.2 to 3.91 mm.d-1, and averaged 3.73 ± 0.34mm.d-1 (equivalent to 1,323 mm.yr-1). Crop evapotranspiration (ETc) and its actual estimation was 1,588 mm.yr-1. In whole province the total water demand in the year 2020 was based on 2,796 million m3. The results also showed that reliable projections of water requirements at different spatial scales enable water management authorities to assess and upgrade irrigation infrastructure and manage water allocation to meet for rice production.
Received | April 30, 2022; Accepted | September 01, 2022; Published | November 28, 2022
*Correspondence | Phan Truong Khanh, Faculty of Environment Technology Engineering, An Giang University- Vietnam National University, Ho Chi Minh City, Vietnam; Email: ptkhanhagu@gmail.com
Citation | Khanh, P.T., and T.T.H. Ngoc. 2022. Estimation of crop water demand for rice by the FAO penman monteith evapotranspiration model. Sarhad Journal of Agriculture, 38(5): 158-165.
DOI | https://dx.doi.org/10.17582/journal.sja/2022.38.5.158.165
Keywords | Evapotranspiration, Water demand, Rice, FAO-penman-monteith, An Giang
Copyright: 2022 by the authors. Licensee ResearchersLinks Ltd, England, UK.
This article is an open access article distributed under the terms and conditions of the Creative Commons Attribution (CC BY) license (https://creativecommons.org/licenses/by/4.0/).
Introduction
An Giang is a key rice growing province in the Vietnamese Mekong River Delta, in 2019 producing 4,022 million tons of grain from a cultivation area of 625,400 ha. This represents about 20% of the total production of rice in the delta (Irrigation Departments in An Giang Province, 2019), and contributes significantly to national food security and to rice exports (Statistical Yearbook of An Giang Province, 2019). A large quantity of water is needed to achieve the current yields of 6.43 tons/ha (International Rice Research Institute, 2007), and the benefits of recently introduced varieties that produce even higher yields in response to nitrogen are highly dependent on water supply, highlighting the the need to use irrigation water wisely and efficiently.
While An Giang Province, in general, still has sufficient water resources to satisfy requirements for rice culture on an annual origin, nearby a number of seasonal difficulties associated through highly variable and unpredictable weather, and with changes in water use in upstream regions of the Mekong River basin. the intrusion of salt water throughout the dry period, caused chiefly by a reduction in flow in the Mekong River and its tributaries (Irrigation Departments in An Giang province, 2019), together with drought, often lead to a shortage of fresh water for Winter-Autumn rice crops in the latter part of the dry season (February to March), and also impact on the late reproductive phase of the October crop (Ngoc and Honti, 2017). Whereas, the crops in October are generally experiences waterlogging during the early vegetative stages, due to heavy rain and floodwaters from upstream in the Mekong River basin.
Currently water requirement for agricultural productivity gradually turns out to be a momentous task in the situation of climate change challenges in An Giang. In particular, the farmers are in front of water scarcity in the farming of paddy field rice in the season of Summer-Autumn. In the situation of climate change, in future the increase in water shortage will occur (Chuong, 2019). In Mekong Delta droughts and famines is one of the furthermost challenges for agricultural productivity. During dry seasons in Mekong Delta targeting to improve crop water requirements for cultivation, several studies on water demand for agriculture have been done.
Water requirement for rice crops was calculated for Long Xuyen Quadrangle, Vietnam by (Lee and Dang, 2018). The finding of the study estimated that summer-autumn and winter-spring harvest required water irrigation nearly 5,830m3/ha and 8,186m3/ha respectively, whereas the harvest in autumn-winter required approximately a total 2,204 m3/ha. In Autumn-winter crop the minimum value evapotranspiration (ETc) with reference was approximately 607.8 mm/crop arisen in Autumn-Winter crop, whereas the maximum value 709.9 mm/crop estimated in Summer-Autumn crop (Lee and Dang, 2018). The findings of the study by Nguyen and Phung (2020) presented that the temperature is likely to increase by 0.4-1.2°C and the precipitation is comparatively heavy (increasing as of 0.6mm-8.9 mm) in coming years till 2035. By 2035, the total water demanded for crop water irrigation will be increased up to about 4% compared to 2015 Nguyen and Phung (2020). Vietnam-Netherlands Mekong Delta Master Plan Project (2011) calculated water needs for 120 irrigation subdivisions and found that the water demand for agriculture accounted 68% for the entire water demanded. However, in January and February the required amounts of water used has increased, because of low precipitation. The average monthly water requirement demand for rice was 354.40 (m3/s). Nguyen (2019) investigated the water demand of major land use types in the Srepok Stream basin, a major branch of the Mekong Stream, using the tool CROPWAT 8.0. Irrigation water demand in 2015 was the highest for winter-spring rice crop at 7,746 m3/ha/crop, and the forecast for the future (2045) showed that the demand for irrigation tends to decrease at different levels (11.7% for the low scenario, 18.59% for the medium scenario and 4.25% for the high scenario) compared to 2015. Climate change has been impacting agriculture, increasing crop water demand and increasing evaporation. This is evidenced by the study of (Le Tuan Anh, 2014) on the irrigation zone of Trung Ha, Suoi Hai. Research results have shown that the irrigation water demand of the crop rice increases by at least 0.6% in 2050 and 1.9% by 2100, corresponding to the B2 scenario (Le, 2014). According to the development investment bank, an increase in temperature of 1 degree Celsius, will reduce rice yield by 10% (Vu, 2015). Climate change is predictable to a rise in temperature, changes in rainfall patterns and increasingly unpredictable weather (EPA, 2001). Higher evapotranspiration due to rising temperatures will have an impact on the hydrological cycle and water reserves (Shahid, 2011), and consequently variations in evapotranspiration are nearly expected to be a key factor determining water availability (Shahid, 2011). Given this, and since processes linked to evapotranspiration dominate total regional water demand, it is important to estimate evapotranspiration from rice paddy fields in order to ensure optimal water allocation for rice cultivation. In this study, we estimate evapotranspiration by rice crops and the demand of water for rice crop cultivation in the province of An Giang. It is very considerably indispensable for agricultural designing and planning of irrigation ventures. We chose the physically-based FAO-Penman-Monteith equation for this purpose because it is arguably the most widely used and reliable method for estimating evapotranspiration.
Materials and Methods
Study area
An Giang Province lies at latitude 10°11’ to 10°58’ north and longitude 104°46’ to 105°35’ east, in the north-west of the Vietnamese Mekong Delta, just to the east of the border with Cambodia, and forms part of a regional area known as the Long Xuyen Quadrangle (Figure 1). The province had a population of 1,908,352 in the month of April, 2019 (An Giang Statisticcal Office, Statistical Yearbook of An Giang, 2019), and has area of 3,537km2, or about 71% of the total area of the Long Xuyen Quadrangle. There are seven directorial components, Chau Doc city, Thoai Son, Long Xuyen city, Tinh Bien, Tri Ton and the districts of Chau Thanh, Chau Phu. Overall, with 90% of the area having a raise of less than 2m above mean sea level and the province is low-slung and plane (and 80% with an elevation of < 1m). The remaining 10%, around Tri Ton and Tinh Bien districts, is mountainous with an elevation of 2–700m.
An Giang has a steamy rainy season climate, and is humid and hot all over the year with 27°C of average temperature and an annual average relatively based on humidity from 75 to 80% (An Giang Statisticcal Office, Statistical Yearbook of An Giang, 2019). There are two different seasons, one is based on dry season from the month of November of year to April of the second year and a precipitated (wet) spell from May to November of the same year. The average yearly precipitation is around 1,130mm and total monthly sunshine hours range from 180h to 268h per month (An Giang Statisticcal Office, Statistical Yearbook of An Giang, 2019).
Water from the Mekong River flows into An Giang from Cambodia via the Hau and Tien Rivers, which run more or less parallel over a distance of 220–250 km from An Giang southeast to the sea. The combined flow of both rivers ranges from 5,020 m3·s-1 in the dry season up to about 24,000 m3·s-1 in the flood season, with an averge annual flow of 13,800 m3·s-1 (Duc et al., 2018). Flows in canals of the floodplain reach 30–130 m3·s-1 during floods (Tran, 2014). Up to 70% of the province is flooded to depths of 1–2.5 m for 2.5–5 months, depending on the severity of flooding, with significant impacts on domestic use and agricultural farm requirements (Irrigation Departments in An Giang Province, 2019). However, even though plentiful, resources of water are unequally dispersed, both spatially and temporally; several sub areas have an oversupply of water resources and are severely flooded for much of the year, while others experience periods of water shortage for both production and domestic use.
The water demand of rice are very complex, climate reliant on. They necessitate consistent approximations of evapotranspiration. In this paper, climate data in 2020 were measured at hydro-meteorological stations in An Giang province and FAO-Penman evapotranspiration model including 27 formulas in the appendix was used to calculate water demand for rice by excel.
Hydro-meteorological data
Scheduled meteorological records of relative humidity, air temperature, precipitation, and solar radiation were collected with weather stations set up in an exposed area without nearby buildings in An Giang province.
Monitoring air temperature and humidity with Testo equipment: Relative humidity and air temperature and were estimated with a Testo Model 174H (US of Manufacture) temperature and humidity meter. This was housed in a [Stevenson Screen/well-ventilated home-made screen] to avoid exposure to direct and reflected long-wave solar radiation, at a height of 1.5 m. RH measurement and temperature logger is extensively permanent for incessant usage and has from top to bottom accurateness. The relative humidity and air temperature were recorded daily at 1h, 7h, 13h, and 19h, and then averaged for each day The daily maximum and minimum temperature was the highest or lowest temperature recorded in the four observations taken between 19:00 on consecutive days. Monthly mean temperature and relative humidity were calculated from the daily means.
Wind speed: Wind speed and direction was measured by an anemometer (Young, USA) with the sensor located on a pole 10 m above ground and the readout housed in the office. This instrument records windspeed and direction for a period of two minutes at hourly intervals. The average wind speed was calculated as the mean of all 24 two minute records taken each day. value is the average value of hours that the machine has saved (1, 2, 3, … 24 hours daily). The maximum and minimum wind speed were the highest and lowest average windspeeds during a two minute sampling period.
Rainfall: Rainfall was measured using a standard rain gauge 8 cm in diameter and 40 cm tall, with a collecting area of 200 cm2. Rainwater was collected in a graduated measuring cylinder where each graduation corresponded to a volume of 2 cm3, or 0.1 mm of rainfall; Daily measurements of rainfall were made at 1h, 7h, 13h and 19h. In the case of heavy rain, measurements were taken immediately after the rain or, if necessary, throughout the precipitation.
Reference evaporation was considered as mentioned by the FAO-Penman-Monteith equation following the calculations described by author, and using the climatic conditions for An Giang province shown in Table 1.
Table 1: Meteorological parameters is used in study in 2020 were obtained in An Giang province.
|
Months |
Air temperature (K) |
Relative humidity (%) |
Rainfall (mm) |
Monthly mean radiation [W m-2] |
Wind speed (m/s) |
|
Jan |
297.75 |
74 |
13.00 |
370.49 |
0.104 |
|
Feb |
298.65 |
79 |
3.25 |
400.74 |
0.127 |
|
Mar |
300.65 |
79 |
16.00 |
428.25 |
0.127 |
|
Apr |
301.85 |
80 |
61.50 |
439.76 |
0.115 |
|
May |
301.55 |
79 |
163.70 |
436.07 |
0.138 |
|
Jun |
301.05 |
83 |
137.50 |
429.99 |
0.173 |
|
July |
301.45 |
81 |
149.50 |
430.73 |
0.185 |
|
Aug |
301.05 |
80 |
173.20 |
431.34 |
0.138 |
|
Sep |
301.05 |
81 |
204.30 |
406.63 |
0.162 |
|
Oct |
300.05 |
81 |
280.00 |
406.63 |
0.127 |
|
Nov |
301.15 |
80 |
157.00 |
376.19 |
0.127 |
|
Dec |
299.95 |
77 |
39.20 |
359.27 |
0.127 |
Potential evapotranspiration
The calculation was based on probable evapotranspiration (ET0) based on daily scale as mentioned by the altered FAO Penman-Monteith and its equation.
FAO Penman-Monteith the physically-based equation is the furthermost worldwide used least-empirical model for evapotranspiration. Here in this research assignment, we have mentioned below as benchmark of the two empirical models.
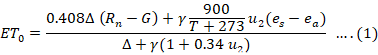
Where;
T = mean value of daily air temperature above 2m from the ground in (˚C); u2 = 2m above the ground surface (m s−1) the wind speed at; es= vapor pressure saturation (kPa); ea= actual vapor pressure (kPa).
Actual crop evapotranspiration the crop water need
Actual rice crop evapotranspiration, which is equivalent to crop water need, was designed by multiplying the reference crop evapotranspiration (ET0) derived as mentioned by FAO-Penman-Monteith equation by an empirical crop coefficient, Kc,
ETc = Kc·ET0, (2)
Here Kc is a crop-specific coefficient.
The coefficient Kc diverges among crops, the growth phases of plants and seasons of cultivation (growth, germination, flowering, harvesting and fruiting). Based on experimental analysis and findings, values for Kc were expected and research assignments from FAO for rice production in Southeast Asia (Table 2).
Table 2: The crop coefficient (Kc) for rice at different growth stages in Southeast Asia based on experiment carried (FAO,2001).
|
Growth phase |
Initial |
Development |
Middle |
Late |
Harvest |
|
Kc |
1.1-1.15 |
1.1-1.15 |
1.1-1.3 |
0.95-1.05 |
0.95-1.05 |
Results and Discussion
From weather data and meteorological environment of An Giang province in 2020: latitude = 10°12’; longitude = 105°35’; Alt = 5m, we calculated the parameters in the FAO Penman-Monteith equation as follows:
Table 3: The value of parameters in the FAO penman- monteith equation.
|
Month |
Tmin [K] |
Tmax [K] |
Rs [MJ m-2 d-1] |
u2 (ms-1) |
Delta |
P [kPa] |
Gamma [kPa C-1] |
ea [hPa] |
|
Jan |
293.66 |
303.66 |
18.885 |
0.10416 |
0.143 |
101.288 |
0.067 |
2.412 |
|
Feb |
293.86 |
304.16 |
20.629 |
0.12731 |
0.145 |
101.288 |
0.067 |
2.442 |
|
Mar |
295.66 |
305.66 |
22.797 |
0.12731 |
0.159 |
101.288 |
0.067 |
2.726 |
|
Apr |
296.66 |
307.16 |
21.296 |
0.11574 |
0.168 |
101.288 |
0.067 |
2.896 |
|
May |
296.66 |
305.66 |
21.373 |
0.13888 |
0.169 |
101.288 |
0.067 |
2.896 |
|
Jun |
295.86 |
303.66 |
16.936 |
0.17361 |
0.162 |
101.288 |
0.067 |
2.760 |
|
Jul |
295.66 |
303.86 |
16.618 |
0.18518 |
0.160 |
101.288 |
0.067 |
2.726 |
|
Aug |
295.76 |
303.66 |
18.491 |
0.13888 |
0.161 |
101.288 |
0.067 |
2.743 |
|
Sep |
295.66 |
303.56 |
13.352 |
0.16203 |
0.161 |
101.288 |
0.067 |
2.726 |
|
Oct |
295.66 |
303.36 |
19.059 |
0.12731 |
0.161 |
101.288 |
0.067 |
2.726 |
|
Nov |
294.16 |
303.16 |
19.315 |
0.12731 |
0.148 |
101.288 |
0.067 |
2.488 |
|
Dec |
293.66 |
303.16 |
17.619 |
0.12731 |
0.143 |
101.288 |
0.067 |
2.412 |
|
Note: Tmax=maximum daily air temperature; Tmin = minimum daily air temperature;Tmean= Tmax+Tmin/2; Rs Mean daily solar radiation (Rs) (MJm-2day-1) = Rs (Wm-2day-1)*0.0864; Wind speed (u2); Slope of saturation vapor pressure curve (Δ); Atmospheric Pressure (P); Psychrometric constant (γ); Actual vapor pressure (ea) derived from relative humidity. |
||||||||
|
Month |
es[hPa] |
Omega (rad) |
Ra [MJ m2 d-1] |
Rso [MJ m-2 d-1] |
Rnl [MJ m-2 d-1] |
Rs [MJ m-2 d-1] |
Rns [MJ m-2 d-1] |
|
|
Jan |
0.32600 |
1.515 |
31.939 |
23.954 |
3.421 |
18.885 |
14.541 |
|
|
Feb |
0.30915 |
1.546 |
34.547 |
25.910 |
3.449 |
20.629 |
15.884 |
|
|
Mar |
0.34512 |
1.585 |
36.918 |
27.688 |
3.326 |
22.797 |
17.553 |
|
|
Apr |
0.36205 |
1.726 |
37.910 |
28.433 |
2.745 |
21.296 |
16.398 |
|
|
May |
0.36664 |
1.644 |
37.593 |
28.195 |
2.767 |
21.373 |
16.457 |
|
|
Jun |
0.33250 |
1.645 |
37.069 |
27.802 |
2.011 |
16.936 |
13.041 |
|
|
Jul |
0.33660 |
1.624 |
37.132 |
27.849 |
1.965 |
16.618 |
12.796 |
|
|
Aug |
0.34288 |
1.588 |
37.185 |
27.889 |
2.334 |
18.491 |
14.238 |
|
|
Sep |
0.33660 |
1.55 |
35.055 |
26.291 |
1.444 |
13.352 |
10.281 |
|
|
Oct |
0.33660 |
1.515 |
35.055 |
26.291 |
2.702 |
19.059 |
14.675 |
|
|
Nov |
0.31097 |
1.495 |
32.430 |
24.323 |
3.361 |
19.315 |
14.873 |
|
|
Dec |
0.31330 |
1.498 |
30.972 |
23.229 |
3.216 |
17.619 |
13.567 |
|
|
Note: Mean saturation vapor pressure derived from air temperature(es); Sunset hour angle (ωs) Extraterrestrial radiation (Ra); Clear sky solar radiation (Rso); Net outgoing long wave solar radiation (Rnl); Rs = the incoming solar radiation, MJ m-2 day-1; Net solar or net shortwave radiation (Rns). |
||||||||
|
Month |
N [hrs] |
n [hrs] |
Rn [MJ m-2d-1] |
Rn [mm d-1] |
ET0 (mm.d-1) |
ET0 (mm month-1) |
ETc (mm month-1) |
|
|
Jan |
11.574 |
7.900 |
11.121 |
4.53726 |
3.29411 |
100.264 |
120.3175 |
|
|
Feb |
11.811 |
8.200 |
12.435 |
5.07347 |
3.56331 |
108.458 |
130.1500 |
|
|
Mar |
12.109 |
8.900 |
14.228 |
5.80484 |
3.56516 |
108.514 |
130.2175 |
|
|
Apr |
12.350 |
7.700 |
13.653 |
5.57042 |
3.91337 |
119.113 |
142.9361 |
|
|
May |
12.557 |
8.000 |
13.691 |
5.58583 |
3.88058 |
118.115 |
141.7384 |
|
|
Jun |
12.568 |
5.200 |
11.030 |
4.50009 |
3.82561 |
116.442 |
139.7307 |
|
|
Jul |
12.403 |
4.900 |
10.831 |
4.41889 |
3.83188 |
116.632 |
139.9595 |
|
|
Aug |
12.133 |
6.000 |
11.904 |
4.85669 |
3.83749 |
116.803 |
140.1645 |
|
|
Sep |
11.843 |
3.100 |
8.836 |
3.60519 |
3.61754 |
110.108 |
132.1307 |
|
|
Oct |
11.577 |
6.800 |
11.973 |
4.88504 |
3.61754 |
110.108 |
132.1307 |
|
|
Nov |
11.430 |
7.900 |
11.511 |
4.69651 |
3.34530 |
101.822 |
122.1872 |
|
|
Dec |
11.447 |
7.300 |
10.351 |
4.22301 |
3.19442 |
97.2303 |
116.6764 |
|
|
Note: Rn = net radiation; ET0 Potential Evapotranspiration; ETc: Actual crop evapotranspiration. |
||||||||
The value of ET0 from the FAO Penman-Monteith model fluctuated in the range of 3.2-3.91mm.d-1, with an average of 3.73 ± 0.34 mm.d-1 (equivalent to 1,323 mm.yr-1). As expected, ET0 values were highest (3.9 mm.d-1) in the dry months of April and May, and then decreased gradually during the wet season from June onwards, with the lowest (3.2 mm.d-1) in December, early in the following dry season. The average ET0 of 3.73 ± 0.34 mm.d-1 (equivalent to 1,323 mm.yr-1) for An Giang is equivalent that (3,70mm.d-1) reported for the average evapo-transpiration in a rice paddy field in Japan (Yan et al., 2017) and was a little lower than that (4.4 mm.day-1) in Australia (Siva, 2015) and evaporation losses (3.91-5.0 mm.d-1) was reported for Malaysia (Nurul et al., 2012; Seyed et al., 2009). In Malaysia the highest ET0 value was found in the drier months of February, March, April, and the lowest in the wetter, cloudier months of September to November (Nurul et al., 2012). These figures are reliable through the value of ET0 in our study is in Southern Vietnam. It is expected that these figures will be changed on the influences of site-specificly, alos cyclical climatic changes and modifications in farming practices. Actual crop evapotranspiration (ETc) was 1,588 mm.yr-1.
Crop water demand
To each rice yield typically takes 3.5 months (100 days). The periodic seasonal timetable can be shown as follows:
- Winter as Spring for rice as a 1st crop: On or after November to February.
- Summer as Autumn for rice as a 2nd crop: On or after March to July.
- Autumn as Winter for rice as a 3rd crop: On or after August-December.
The findings demonstrate the requirement of water aimed by harvests is usually increasing in the early month (Table 4). Later on, in the demand of water greatly reduces in next few months. Total demand of water for the farm of Summer-Autumn of the rice crop (as a 2nd rice crop) was increased for about (5,390m3/ha). Because in March the temperature at this time was very high compared to other months, water was lost quickly. The number of times to pump water into the rice paddy was very much at this stage. Subsequently, the Winter-Spring period (rice the 1st crop) estimated as 4,671m3/ha. Lowermost demand of water at Autumn-Winter yield of rice (as a 3rd crop), estimated as 2,748m3/ha, for the reason that this time overlaps through the showery period, so the additional water desired for the rice crop is a smaller amount than the residual calendar months. Water demand aimed at rice crop in the wheezing time of year is 6-8 times advanced than the showery period of time, but farming approaches are not significantly different for each season.
The results of demand of water for rice by districts in the province of An Giang in 2020 are shown in Figure 2. The highest water demand was in Thoai Son (475.54 million m3), followed by Tri Ton (459.25 million m3) and t hen Chau Phu (413.14 million m3) (Figure 2). The other districts of Phu Tan, Chau Thanh and Cho Moi, had a water demand for rice ranging from 165 to 362 million m3yr-1 (Figure 2). The two cities of Long Xuyen (55.97million m3) and Chau Doc (84 million m3) had the lowest water demand for rice because they are largely urban areas with only a small area under rice cultivation. The total crop water demand for rice in whole province in 2020 was 2,796.97million m3.
However, the water demand for rice production is expected continue to rise until at least 2025, and perhaps beyond, due to an increase in the area where a third rice crop is grown, to the introduction of new rice varities with higher yields in response to fertilizers, and to other intensification measures aimed at increasing rice production.
Table 4: This calculation shows the amount of water demanded by three rice crops unit: m3/ha.
|
Months |
Jan |
Feb |
Mar |
Apr |
May |
Jun |
Jul |
Aug |
Sep |
Oct |
Nov |
Dec |
Total |
|
The 1st crop |
1,202 |
1,166 |
0 |
0 |
0 |
0 |
0 |
0 |
0 |
0 |
1,558 |
746 |
4,671 |
|
The 2ndcrop |
0 |
0 |
3,594 |
540 |
458 |
373 |
425 |
0 |
0 |
0 |
0 |
0 |
5,390 |
|
The 3rd crop |
0 |
0 |
0 |
0 |
0 |
0 |
0 |
1,773 |
172 |
0 |
558 |
245 |
2,748 |
|
Total |
1,202 |
1,166 |
3,594 |
540 |
458 |
373 |
425 |
1,773 |
172 |
0 |
558 |
245 |
12,809 |
Conclusions and Recommendations
In An Giang water resources are presently being used for many different purposes, with over 90% being exploited for agricultural purposes. Currently, on a local and yearly scale, outward water is abundant but seasonal water shortages already occur in certain districts due to a high demand for water in agriculture which cannot be met by existing irrigation infrastructure. Reliable projections of future water requirements at different spatial scales enable water management authorities to assess and upgrade irrigation infrastructure and manage water allocation to meet current and emerging water requirements for rice production, as well as for other needs. Our results demonstrate that estimates of evapotranspiration derived from the FAO Penman Monteith model can be used to predict rice crop water demand on a monthly or sub-monthly basis at different spatial scales. This will be especially critical for predicting water use in response to global warming and other impacts of climate change.
Acknowledgements
We are obliged to Vietnam National University, Ho Chi Minh City Vietnam for financial support of the study: “Water balance assessment for sustainable agriculture development in floodplains in of An Giang Province”. No. B2020_16_03.
Novelty Statement
The water demand for rice was calculated through 20 sub-formulas of FAO Penman-Monteith using Excell software (Not Cropwat software). This is rarely seen in previous papers.
Author’s Contribution
Phan Truong Khanh and Tran Thi Hong Ngoc: Developing research ideas and methodology, data processing; coordinating article writing; editing the article.
Conflict of interest
The authors have declared no conflict of interest.
References
Chuong, V.H., 2019. Drought and conflicts at the local level: Establishing a water sharing mechanism for the summer-autumn rice production in Central Vietnam. Int. Soil Water Conserv. Res., 7(4): 362-375. https://doi.org/10.1016/j.iswcr.2019.07.001
Duc, T.D., G. van Halsema, P.J.G.J. Hellegers, L.P. Hoang, T.Q. Tran, M. Kummu, F. Ludwig. 2018. Assessing Impacts of Dike Construction on the Flood Dynamics of the Mekong Delta. Hydrol. Earth Syst. Sci., 22: 1875–1896. https://doi.org/10.5194/hess-22-1875-2018
EPA, 2001. Climate Change Indicators: Weather and Climate. https://www.epa.gov/climate-indicators/weather-climate.
FAO, 2001. Crop evapotranspiration-Guidelines for computing crop water requirements. Chapter 6 ETc Single crop coefficient (Kc). 2001. http://www.fao.org/docrep/X0490E/x0490e0b.htm
International Rice Research Institute, 2007. Rice science for better world. Annual Report of the Director General, 2006-07. Vol.17. April. 2007.http://books.irri.org/AR2006-07_content.pdf.
Irrigation Departments in An Giang Province, 2019. Báo cáo quy hoạch nguồn nước tỉnh An Giang giai đoạn 2020-2030.[Translate] Report on water resources planning in An Giang province in the period of 2020-2030.
Lee, S.K., and T.A. Đang. 2018. Water requirement for rice crops in the context of changing climate: A case study in the Long Xuyen Quandrangle, Vietnam. 18(4): 595-604. https://doi.org/10.5958/2348-7542.2017.00101.2
Le Tuan Anh, 2014. Một số kết quả nghiên cứu bước đầu về ảnh hưởng của biến đổi khí hậu đến nhu cầu nước tưới của cây trồng trên vùng tưới Trung Hà –Suối Hai. Tạp Chí Khoa học Kỹ thuật Thủy lợi môi trường số 36 tháng 03.2014. [Translate] Le Tuan Anh, 2014. Some preliminary research results on the effects of climate change on irrigation water demand of crops for the Trung Ha –Suoi Hai region. J. Environ. Sci. Technol., 36.
Nurul, N.A.T., S. Harun, and S. Shahid. 2012. Comparison of different methods in estimating potential evapotranspiration at Muda Irrigation Scheme of Malaysia. J. Agric. Rural Dev. Trop. Subtropics. 113(1): 77–85.
Ngoc, T.T.H., and M. Honti. 2017. Application of different evapotranspiration models to calculate total agricultural water demand in a tropical region. Period. Polytech. Civ. Eng., 61(4): 904–910. https://doi.org/10.3311/PPci.10283
Nguyen, T.H., and N.K. Phung. 2020. Evaluation of the effects of climate change to water demand for agriculture in Da Lat city, Lam Dong province. Vietnam J. Hydrometeorol., 4: 23-30. https://doi.org/10.36335/VNJHM.2020(4).23-30
Nguyen, T.N.Q., 2019. Forecast of water use demand for land use types in SREPOK river basin in the context of climate change. Vietnam J. Agric. Sci., 17(2): 126-136.
Shahid, S., 2011. Impacts of climate change on irrigation water demand in Northwestern Bangladesh. Clim. Change, 105(3-4): 433–453. https://doi.org/10.1007/s10584-010-9895-5
Seyed, R.S., S. Mustapha, S. Ibrahim and E. Randjbaran. 2009. Comparison of daily and monthly results of three evapotranspiration models in tropical zone: A case study. Am. J. Environ. Sci., 5(6): 698-705. https://doi.org/10.3844/ajessp.2009.698.705
Siva S., 2015. Water balance of flooded rice in the tropics, irrigation and drainage - sustainable strategies and systems, Dr. Muhammad Salik Javaid (Ed.), ISBN: 978-953-51-2123-7, InTech, https://doi.org/10.5772/59043
Statistical Yearbook of An Giang, 2019. An Giang statisticcal office. An Giang Province, Vietnam. 2018. Statistical Yearbook of An Giang, An Giang Statisticcal Office. An Giang Province, Vietnam. 2019.
Trenberth, K.E., A.G. Dai, R.M. Rasmussen and D.B. Parsons, 2003. The changing character of precipitation. Bull. Am. Meteorol. Soc., 84: 1205–1217. https://doi.org/10.1175/BAMS-84-9-1205
Tran, H.T., 2014. Diễn biến dòng chảy ở Đồng bằng Sông Cửu Long. Tạp chí khí tượng và Thủy văn, số 7. 2014. [Translate] Tran Hong Thai, 2014. Flow in the Mekong Delta. J. Meteorol. Hydrol., pp. 7.
Vietnam-Netherlands Mekong Delta Masterplan Project. 2011. Mekong Delta water resources assessment studies. 2011. Vietnam News, 2018. Sediment loss in Mekong River killing southern delta. https://vietnamnews.vn/society/422256/sediment-loss-in-mekong-river-killing-southern-delta.html.
Vu, T.T., 2015. Thích ứng cây trồng trước biến đổi khí hậu. [Translated] Vu The Thuong, 2015. Adaptation of plants to climate change. https://nhandan.vn/chuyen-de-cuoi-tuan/thich-ung-cay-trong-truoc-bien-doi-khi-hau-234294/
Yan, H., Z. Chuan, H. Oue, P. Guangjie and R.O. Darko. 2017. Determination of crop and soil evaporation coefficients for estimating evapotranspiration in a paddy field. Int. J. Agric. Biol. Eng., 10(4): 130–139. https://doi.org/10.25165/j.ijabe.20171004.2290
To share on other social networks, click on any share button. What are these?

