
Empirical Analysis of Total Factor Productivity of the Agriculture Sector and Economic Growth of Pakistan


Research Article
Empirical Analysis of Total Factor Productivity of the Agriculture Sector and Economic Growth of Pakistan
Abdul Wadood Khan1, Sabahat Subhan1*, Asif Ali Abro2 and Riaz Shahid3
1Department of Economics, National University of Modern Languages, Islamabad, Pakistan; 2Newports Institute of Communications and Economics, Karachi, Pakistan; 3Institute of Development Studies, The University of Agriculture, Peshawar; Pakistan.
Abstract | The current research describes the Total Factor Productivity (TFP) of the agriculture sector and economic growth of the Pakistan from 1980-2018. To analyze the long run relationship among the variables, the Autoregressive Distributed Lag model was used. While constructing the production function, most of the common variables in the production function were utilized. In the construction of productivity and input quantity index, the data of input and output were employed respectively. The data of GDP, capital and labour was used in the agriculture sector for obtaining the agriculture TFP of Pakistan. In addition, the time-series data from 1980-2018 was taken from various publications and official resources. For the period study the estimated annual average of agriculture TFP growth was 2.14% and it contributes 58% to overall agriculture output. The findings explained that the TFP of the agriculture sector was remained highest at 2.86% for a few years and the minimum 0.96% in the 70s. In the 80s, followed by 90s the growing rate of agriculture TFP was 2.24 and 2.46%. During these decades, the TFP growth contributed around (33, 53 and 81%) to agriculture productivity. The analysis of TFP of the agriculture sector shows a significant variation in the TFP growth, due to climate change patterns, public interference, and macroeconomics strategies. The study recommends a dire need to increase capital stock, skilled labour, and cultivated land to boost and enhance agriculture growth as these are the key factors for the agricultural TFP and economic growth of country’s.
Received | January 06, 2021; Accepted | November 20, 2021; Published | March 31, 2022
*Correspondence | Sabahat Subhan, Department of Economics, National University of Modern Languages, Islamabad; Email: ssubhan@numl.edu.pk
Citation | Khan, A.W., S. Subhan, A.A. Abro and R. Shahid. 2022. Empirical analysis of total factor productivity of the agriculture sector and economic growth of Pakistan. Sarhad Journal of Agriculture, 38(2): 648-656.
DOI | https://dx.doi.org/10.17582/journal.sja/2022/38.2.648.656
Keywords | Agriculture Sector, Economic growth, Macroeconomics strategies, Pakistan, Total factor productivity
Copyright: 2022 by the authors. Licensee ResearchersLinks Ltd, England, UK.
This article is an open access article distributed under the terms and conditions of the Creative Commons Attribution (CC BY) license (https://creativecommons.org/licenses/by/4.0/).
Introduction
After industrial revoluation 1970’s, agriculture sector had become the second prominent sectors for economic growth in Pakistan. It is the main foundation for livelihood and development. Which contributes 18.5% to the total Gross Domestic Product, and important source of employment (38.5% to the total labor force) for country’s people. However, with passage of time, agriculture sector production has been decreasing as compare to the other sectors. The industrial sector gets the raw material from agriculture, and it is a key sector for foreign exchange earnings of the country. The reasons of the decrease in the agriculture production are (Division addresses soil, water and land use issues). Due to which it causes a decrease in the GDP growth of the country. In 2010-11, the modest growth was recorded 1.2% in the agriculture sector, there is a need to enlarge this sector to increase export, the revival of the industrial sector is responsible for encouraging consumption. Similarliy, in 2018 to 2019 the agriculture growth was very inadequate as compared to the target set by the government of Pakistan. The cumulative growth rate is only 0.85% was less than the target of 3.8% claimed at the beginning. As matter of the fact, the agriculture sector still provides positive support to other manufacturing sectors in order to increase exports. (Government of Pakistan, 2018-19).
Figure 1 shows that agricultural growth has more fluctuation than GDP growth. In Pakistan, the agriculture sector is being considered an engine for the GDP growth and country’s development. However, the data shows that there is an inconsistency in the agriculture growth in Pakistan.
In general, in 1950 the share of the agriculture sector was 53% to the GDP. Admittedly, decrease had been reported in 2010 (21.5%) and in 2018 (18.5%). In 1950s, due to the green revolution, more than half of the GDP growth of Pakistan’s was dependent on the agriculture sector. By 2018, there is a drop of 32 percent in the contribution of the farming sector. For the time being the agriculture sector shows a consistent decrease in the share. So, it causes that the GDP was growing at a low rate. This sector is still the main and the second leading sector for the Pakistan economy (Government of Pakistan, 2018-19).
Contribution of the Study
This study examines the factor which effect the Total Factor Productivity of agriculture sector. The growth of this sector is very important, because it is the main contributor to the GDP growth of Pakistan, but this area is neglected much in the literature, therefore this research find out the TFP of agriculture sector of Pakistan and evaluates the impact of TFP of agriculture sector on the economic growth of Pakistan.
Significance of the Study
Agriculture sector played usually very important role to ensure food security for the growing population of Pakistan. Pakistan is an agriculture-centered country, so the agriculture sector holds huge significance for Pakistan. But the share of the sector is reducing since its birth, the rise in the production of industrial sector has not removed the significance of the agriculture sector. Industrial sector cannot grow without the growth of agriculture sector because agriculture sector provided raw material to the manufacturing sector. So, it is necessary for the economic growth to increase capital use in agriculture, human capital in rural sector. If we want to achieve a sustainable development in that sector, so there is need of modern technology, high yielding varieties of common seeds like cotton, wheat, sugarcane, and grains etc. As well as make investment for the best irrigation system, for the agricultural research, and make sure efficient physical infrastructure.
Materials and Methods
There have been very few studies estimated TFP growth for the agriculture sector of Pakistan. The innovative among these is the estimation by the Wizarat (1981). The researcher used annual time series data for the period 1953-1979 to estimate the arithmetic TFP index in the growth accounting framework. According to the estimates, TFP growth in the agriculture sector of Pakistan remained at 1.1%.
Khan et al. (1994) applied arithmetic index to calculate the TFP of the agriculture sector. TFP was recorded at 2.1%. TFP of the agriculture sector was estimated by Mahmud et al. (2006) by applying a growth accounting approach. The TFP remained 0.37 percent per annum. Ali (2004) also obtain the TFP of the agriculture sector by utilizing the arithmetic index, and the TFP was recorded 2.17% annually.
Ahmad et al. (2010) explain the growing trends in the TFP of the agriculture sector, and took data from 1950-2004. He found that the TFP of the agriculture sector was 0.28% and contributes to the TFP of agriculture value addition is only 7%. He suggests that there is a need to increase agriculture inputs as well as extend services to increase the growth of agriculture TFP.
Evenson and Pray (1991) to estimate the average growth rate of TFP, used annual time series and cross-section so the result was 1.07%. It is marginally lower than the result of Wizarat (1981). Rosegrant and Evenson (1992) as well as find similar estimations as initiate by Evenson and Pray (1991) but there is only one difference in their estimates is the T-T index. In 1957-85, TFP is based on the T-T index. However, the estimation of sub-periods is significantly dissimilar from each other.
Rosegrant et al. (1993) describe the TFP of the agriculture crop sector of Pakistan, he discovered the variables of the research, and introduce the innovative brands, and as well as the literacy rate of the rural sector and the irrigation system has excessive importance in the agriculture TFP growth, the finding shows that the specific return of the investment in research was 58%, the return of overall research was 39%, the return on particular was 53% on HYVs. The result suggests that there is a need for research to improve agriculture growth.
Data Source
The economic analysis is depending upon the availability of suitable data. The measurement of total factor productivity growth is not an easy attempt in the developing countries, because in the best conditions we may not have been able to get the sample data with which to progress. In the present study in this regard, the same situation was faced to collect the data. It is not an easy task to get the data of the variable on a macro level, therefore no work has been done to measure, how the TFP of the farming sector effect the economic enhancement of the country. If we would like to decrease the problem like food security, high population growth, and to achieve sustainable agriculture growth by which we can increase the GDP growth of the country, so there is a need to take initiatives in research areas.
To estimation, the TFP of the agriculture sector, the time series data of labor, capital, and land are required. The study covered the sample from 1980-2018. In this study, the data of capital formation utilizing (perpetual Inventory method) were taken because in the national income accounts there is a lack of data on capital stock. Data of cultivated area, labor, and capital formation from 1980-2018 was collected from the Economic Survey of Pakistan and FBS, GOP, Islamabad. Data of fixed capital stock formation is calculated in millions of Rupees constant element, the labor force is calculated as a total labor force employed, and land input is measure by cultivated land (as a percentage of the cultivated area).
Descriptive Analysis
The agriculture TFP of Pakistan was calculated by Tornqvist-Theil (T-T) index method. In the growth accounting method, a change in TFP indicates there change in production, but this cannot account for the changeover in all inputs. The same as a result, the TFP reflects the combined effect of many things, i.e. institutional factor and weather factor. If we look at the other countries’ TFP growth experiences, the researcher found that there is a factor like human development, physical development (infrastructure improvement), credit resources. Technological advancement and trade openness (in terms of import and exports) had a substantial impact on agriculture TFP growth. The researcher similarly found that if a country like Pakistan wants sustainable growth, so they should emphases on these issues. Without resolving these issues the sustainable growth is not possible.
In Pakistan, it has been described that the research on the variable which affects the TFP of the agriculture sector has not been conducted separately. So, the main aim of the study is to identify variables that affect the TFP of the agriculture sector. In the current study, those variables were used, which has a direct or indirect influence on the TFP growth of the farming sector. Various methods are used to obtain TFP of the agriculture sector is given below.
Growth accounting approach
The growth accounting approach is used to obtain the shares of different elements in the economic growth and implicitly find out the technological growth rate, measure as a residual in the economy. The growth accounting is utilized to decomposes the economic growth rate into that which is due to an increase in the contribution of the factor used. If there is a rise in the capital and labor and it cannot be counted by the change in the factor utilization. The part of GDP growth that is not explained is taken to increase productivity.
The growth accounting technique is being used for every economy of the world. Moreover, the GDP growth is not only explained by the change in the growth of capital stock and labor force. There are several factors, which contribute to economic growth and as well as to the economy. The role of technological advancement is the key to growth, without the use of modern technology, the sustainable development is not possible.
Christensen (1975) explains that in the growth accounting approach, the technological progress is shift with the calculation of factor productivity indices, mostly the rate of adjustment of TFP indices. Griliches (1994) explains that in the early studies in the growth accounting tradition there is much effort to find an explanation for the residual, without any embarrassment, as well as the findings of our ignorance. With the technological change and change in the productivity of the input use, it was due to the efforts to identify the residual. The residual, therefore, is not just worthless that could be wanted away if one has better data but is seen as a useful way of taking organizational and technologically-induced efficiencies and it could be the core of the growth process, whether for part or a whole economy. Figure 2 shows that agriculture contribution to GDP and Total Factor Productivity have same trend.
Research framework
To explore the correlation among the variables and agriculture productivity, firstly the agriculture sector productivity has been estimated. So, the study analyzes two stages. The first stage estimates the methodology framework of growth that how the growth was calculated in the agriculture sector. The second stage explains the methodology framework, evaluate the effect of TFP of the agriculture region on the country’s economic growth from 1981 to 2018. This section also discusses the similar methodology concepts and model conditions that are applied for empirical analysis in that study.
Determination of total factor productivity of the agriculture sector
Different methods are used to estimate the agriculture sector productivity growth, but they are bound to yield different outcomes. So, to estimate the agriculture sector productivity growth, the study extends the Solow Swan (1956) growth model. In general structure, the Solow growth model depends on the factor of productions. Two models have been constructed in this study. The models are as follows.
Model 1
 (1)
(1)
Where;
K: Capital of the Agriculture sector; L: Labor Force in Agriculture sector; A: Solow Residual / Total Factor Productivity Parameter.
The accuracy of the estimation result depends clearly on the input and output of the data, which is every so often poor. Even when the data is perfect, so the Solow residual does not find necessarily produce unbiased results. The reason behind this is that agricultural productivity growth is low due to environmental losses. These costs should not count in the value of output and the elimination of this operation would be the reason for residual, to overestimate productivity growth.
Solow further explains the production function through the Cob-Douglas production function:
 (2)
(2)
Taking the log of equation 2:
 (3)
(3)
Where;
θ, 1- θ explain the portion of capital and labor in output growth of the agriculture sector. Differentiate equation 3 concerning time:
 (4)
(4)
Equation 4 explained output decomposed into total factor productivity (TFP) growth, the weighted sum of capital and labor growth. Solve the above equation for TFP growth
 (5)
(5)
 (6)
(6)
TFP growth is the weighted sum of capital and labor growth subtracting from output growth. For the calculation of the agriculture TFP, data of labor and output available in various published sources. While the study used the perpetual inventory approach to determine the capital stock series data.
The general structure of the capital stock equation:
 (7)
(7)
ẟ is the depreciation rate and Nehru and Dhar Eshwar (1993) the calculated capital stock series is given below
 (8)
(8)
The primary capital stock is denoted by K (0) and the time is shown by 0. Collins and Bosworth (1997) estimated capital stock series by using, with the rate of depreciation is constant, and that rate was 4 percent annually. But it is noticed that the depreciation rate is increasing and decreasing with time. To resolve the problem, utilize the following adjustment formula:
 (9)
(9)
Solved this formula for the ẟ (depreciation rate):
 (10)
(10)
From equation 10, calculate the time-varying depreciation rate.
Due to output data for environmental losses i.e. Total Sustainable Factor Productivity (TSFP). Unfortunately, the measurement of environmental losses is very difficult and there is no other or universally known proxy for it. The benchmark year can be avoided by estimating the chained index or the overall production of the year. So, in this case, it is possible to drip the assumption of fixed shares, by using translog production or corresponding Divisia index. None of these measures through the traditional method can distinguish between pure technical progress. As well as the efficiency of the production will also decrease if the proper method of measurement is not used. This difference is possible by using a different method of measurement, the Malmquist index, it does assume that the optimizing behavior by agents shifts from the conventional production function framework (Fare et al., 1998).
TFP of farming sector and GDP growth of Pakistan
In this section, the TFP of the agriculture sector and GDP growth of Pakistan were discussed in detail. The data obtained from the Economic Survey of Pakistan from 1980 to 2018. It provides information about the variable used in the study, as well as the current situation of the country’s economy. The current study gives a realistic overview of the TFP and the GDP growth of the country. The methodology section contains the model by which the estimation is determined.
The study determined variables are GDP growth and the impartial variables are capital stock, labor, arable land, and agriculture growth. The design of the model is as follow
Model 2
GDP growth= f (capital stock, labor force, arable land, agriculture growth, TFP)
The econometric form of the model is
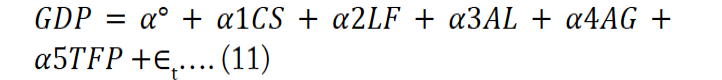
Where;
GDP: Economic Growth; CS: Capital Stock; LF: Labor Force; AL: Arable Land; AG: Agriculture Growth; TFP: Total Factor Productivity; α: Constant and ∈t is a constant error term.
To evaluate the time series data, different error modification approaches are used on the way to investigate the effect of TFP on the agriculture sector and GDP growth of the country. To obtain out the long run and short effect, the ARDL model has been utilized. It is important to analyze the stationarity of the time-series data. So, the unit root technique is applied to confirm stationarity in the time series. The investigator uses a classical regression study, when the data is in time-series form, so the classical regression study assumes that time series data are non-stationary and based on this theory the t-test, F test, and x2-tests. If the time series data is non-stationary, then the general statistical approach has not been recommended. It is very valuable for the reason that at the time of regression the most of the time series data change with time, might be incorrect, or it might generate a significant result but with the high R2 so it is not a reasonable implication (Granger and Newbold, 1974). To estimate time-series data, the first stage is testing the unit root. To check the unit root hypothesis different methods are used but the most common is Augmented Dickey-Fuller (ADF) analysis by (Dickey and Fuller, 1979;1981). In the time series econometric literature, the ADF is commonly used.
Pesaran and Shin (1999) confirmed that the ARDL model denoted single cointegration. And the benefit of the ARDL model remains that, it doesn’t need all variables to be I (1) as in the Johanson framework. If the variable has I (0) and I (1) so it will be suitable for the estimation. There is a different characteristic of the ARDL techniques, which are as follows.
- ARDL method is dissimilar from the other methods, it is the mixture of integration in a different order, in integration it concludes that it is suitable and irrespective of different orders, whether the integrated value is 1 or 0.
- In this model for different variables Diverse Lag Length is used.
- It is appropriate to compare with short model methods as well as relate to the other techniques.
- It is very easy as well as simple, to recognize in a specific equation, as well as it is simple to explain plus solvable.
- The main component is the Error Correction Model (ECM), and it finds out from ARDL with the simple linear conversion.
- Nkoro and Uko (2016), describe that its figure out short run as well as long-run coefficient collectively.
Results and Discussion
The result of the TFP of the agriculture sector and the economic growth of Pakistan has been described in this chapter from 1980 to 2018. Used the ARDL technique to find out the result of the whole study, as well as explained the TFP with the decade wise. To discuss the result of agriculture TFP growth and its contribution. The augmented dickey fuller test has been utilized to obtain the order of integration, Bound test is used to get whether the cointegration has existed or not. Cointegration has been tested by the Auto Regressive Distributed Lag method with help of the Error Correction Mechanism, the short-run factors are estimated. After the estimation, the bound test is employed to calculate the stability of the model.
It is necessary to realize which technique is used in the research, ARDL, OLS, or Cointegration. Augmented Dickey-Fuller (ADF) is utilized to determine the order of integration. And if the variables are stationary at the second difference then it cannot utilize the ARDL.
Table 1: Short Run Result of ARDL Model (GDP as dependent variable).
|
Variable |
Coefficient |
Std. Error |
t-Statistic |
Prob. |
|
C |
-0.096991 |
0.300678 |
-0.322572 |
0.7493 |
|
D (K (-1)) |
0.020192 |
0.007910 |
2.552718 |
0.0017* |
|
D (L (-1)) |
0.253073 |
0.119020 |
2.126306 |
0.0069* |
|
D (AL (-1)) |
0.259884 |
0.084966 |
3.058682 |
0.0000* |
|
D (AG (-1)) |
0.131818 |
0.060687 |
2.172105 |
0.0028* |
|
D (FPG (-1)) |
0.000323 |
0.000118 |
2.737288 |
0.0000* |
|
ECM (-1) |
-0.207790 |
0.102168 |
-2.033797 |
0.0036* |
Source: Author on the calculation, * p<0.01
Table 1 indicates the short-run result of the ARDL model. In this model, GDP is a dependent variable, and capital stock, labor force, arable land, agriculture growth, and TFP are the independent variables. When there is an increase in the capital than as a result the gross domestic product will increase. The labor force has also the same impact GDP. Pakistan is an agriculture-based country, so the arable land and agriculture growth have also an encouraging impact on the GDP. When the arable land and the agriculture growth increases then it will increase production, in the result the gross domestic product will increase. TFP has also a substantial impression on the economic development of the country.
ECM describes the speed of adjustment; it explains how much time is required to achieve the equilibrium. The tables show that the amount of ECM is negative, and its significance is necessary. The value of the coefficient has a negative sign, it shows that the convergence in the long run. Table 1 confirms that the ECM rate is 0.20, it suggests that, if the control variable moving in the consistent path, then every year 20 percent equilibrium is corrected.
The results in Table 2 indicates that there is a substantial effect of capital stock on the GDP growth of the country. It describes, if there is a one percent rise in the capital stock, then in the result there is a 0.024% rise in the economic growth. If there is a one percent rise in the labor force, then in the result there is a 0.09 percent rise in the GDP discussed by Azam (2011).
Table 2: Long-run result of ARDL Model (GDP as dependent variable).
|
Variable |
Coefficient |
Std. Error |
t-Statistic |
Prob. |
|
K |
0.024737 |
0.008256 |
2.996245 |
0.0000* |
|
L |
0.099613 |
0.042449 |
2.346635 |
0.0006* |
|
AL |
-0.043712 |
0.219460 |
-0.199179 |
0.8549 |
|
AG |
0.150005 |
0.052598 |
2.8519145 |
0.0000* |
|
FPG |
0.170726 |
0.083761 |
2.03824 |
0.00134 |
|
C |
0.893719 |
7.377801 |
0.121136 |
0.9112 |
Source: Author own calculation, * p<0.01
There is a depressing and unimportant impression of arable land on the economic development of the country. The outcome confirms that if there is a one percent rise in the arable land then in a result there is a 0.04 decrease in economic growth. There is a positive and considerable influence of agriculture growth on the economic growth of the country. Concerning a country like Pakistan if there is an increase in agriculture productivity. The agriculture growth outcome shows that if there is a one percent rise in the agriculture growth then as a result there is a 0.15 rise in the GDP or economic growth (Ruttan and Hayami, 1985). Furthermore, if there is a one percent increase in the TFP of the agriculture sector then as a result there is 0.17% increase in the GDP.
Conclusions and Recommendations
TFP is the most important source of development. But in a country like Pakistan, the researchers and policymakers didn’t give importance to TFP. In Pakistan, there are some studies on the TFP of the agriculture sector. From 1980-2018 the result of TFP shows that the growth rate of TFP is 0.17 percent annually. It is the lowest possible for the past ten years. The growth rate of TFP was 0.96 percent during the 70s. In the 80s to 90s the TFP growth was 2.24 to 2.26 percent. The study explains the TFP growth rate is low as compared to the past.
The result demonstrated that in the long run there is a substantial effect of capital stock on the economic progress of the country. Here is a considerable effect of labor on economic development. Arable land has an insignificant impression on the economic development of the country. Agriculture growth encouraged the economic growth of every country, especially Pakistan because it mainly depends on the production of this sector. The result shows that if there is a 01 percent progress in the agriculture growth then there is 0.15 percent expansion in the GDP growth.
TFP of the agriculture sector indicates that there is a fluctuating trend during 1980-2018. The arable land shows a negative trend, the study explained that there is a need to extend the cultivated area. Because with time the demand for food is increasing. So, there is a need to expand agriculture inputs to the increase in agriculture growth. The agriculture sector can respond positively. To increase the efficiency of labor there is a need for education for the labor worked in the agriculture sector. Education has a significant impact on the labor as well as the agriculture growth of Pakistan. The result shows that there is a significant impact of capital on the agricultural growth of Pakistan. For sustainable agriculture growth, there is a need for investment in the agriculture sector. The government should emphasize the improvement of agriculture infrastructure, which helps the agriculture products will reach the market on the time.
Novelty Statement
This study describes key factors for the agricultural TFP and economic growth of the Pakistan from 1980-2018. Further its highlighted major indicators to increase capital stock, skilled labour, and cultivated land to boost agriculture growth.
Author’s Contribution
Abdul Wadood Khan: Principal author, designed research, compiled data and composed draft of the manuscript.
Sabahat Subhan: Literature reviewed and data analysis.
Asif Ali Abro: Technical proofreading of the paper
Riaz Shahid: Helped in format setting.
Conflict of interest
The authors have declared no conflict of interest.
References
Ahmad, K., Chaudhary, M.A. and Ilyas, M. 2008. Trends in total factor productivity in Pakistan agriculture sector. Pak. Econ. Soc. Rev., 46(2):117-132.
Ahmad, H.K., Ilyas, M., Mahmood, T. and Afzal, M. 2010. Exploring the effect of total factor productivity growth on future output growth: Evidence from a panel of East Asian countries. Pak. Econ. Soc. Rev., 48(1): 105-122.
Ali, S. and Iqbal, M. 2004. Total factor productivity growth in Pakistan’s agriculture: 1960-1996. Pak. Dev. Rev., 43 (4): 493-513.
Ali, S. 2005. Total factor productivity growth and agricultural research and extension: An analysis of Pakistan’s agriculture. 1960-1996. Pak. Dev. Rev., 729-746.
Amjad, R. and Awais, N. 2016. Pakistan’s productivity performance and TFP trends 1980-2015: Cause for real concern. Lahore J. Econ., 21(Special 21): 33-63.
Anik, A.R., Rahman, S. and Sarker, J.R. 2017. Agricultural productivity growth and the role of capital in South Asia (1980–2013). Sustainability, 9(3): 470. https://doi.org/10.3390/su9030470
Asghar, A., Khalid, M., Muhammad, A. and Dawson, P.J. 2012. Macro determinants of total factor productivity growth of agriculture in Pakistan. Pak. J. Appl. Econ., 22(1-2): 1-18.
Azam, M. 2011. The impact of Indian job guarantee scheme on labor market outcomes: Evidence from a natural experiment. Available at SSRN 1941959.
Christensen. 1975. Comments on Simulation, proceedings of human factors and ergonomics society annual meeting, Vol. 19 No. 1
Collins and Bosworth. 1997. Economic Growth in East Asia: Accumulation versus Assimilation, No. 2
Dickey, D.A. and Fuller, W.A. 1979. Distribution of the Estimators for autoregressive time series with a unit root. J. Am. Stat. Assoc., 74(366a): 427-431.
Dickey, D.A. and Fuller, W.A. 1981. Likelihood ratio statistics for autoregressive time series with a unit root. Econometrica: J. Econ. Soc. pp.1057-1072.
Evenson, R.E. and C.E. Pray. 1991. Research and Productivity in Asian Agriculture. Ithaca: Cornell University Press, vi + 383 pp
Fare, Rolf, Carl A. and Pasurka, Jr. 1989. Multilateral productivity comarisons when some outputs are undesirable: A Non Parametric Approach. Rev. Econ. Stat., 71 (1): 90-98.
Granger and Newbold. 1974. Spurious regressions in econometrics. J. Econ., 111-120.
Griliches, Z. 1994. Productivity, R & D, and the Data Constraint. Am. Econ. Rev., 84 (1): 1-23.
Government of Pakistan. 2018-2019. Economic Survey of Pakistan, Finance Division, Islamabad.
Khan, S.U.K. 2005. Macro Determinants of Total Factor Productivity in Pakistan. Published in: SBP Res. Bul., 2(2): 383-401.
Khan, M.H., Chaudhry, M.G. and Mahmood, M., 1994. The Structural Adjustment Process and Agricultural Change in Pakistan in the 1980s and 1990s [with Comments]. Pak. Dev. Rev., 33(4): 533-591.
Mahmud, Muhammad and A. Rashid. 2006. Productivity and Economic Growth. J. Manage. Soc. Sci., 2 (1): 69-81.
Nadeem, N., Javed, M.S., Hassan, S. and Adil, S.A. 2010. Decadewise analysis of total factor productivity growth of agriculture sector in Punjab, Pakistan: 1970-2005. J. Agric. Res., 48(1): 93-104.
Nehru and D. Eshwar. 1993. A New Data base on Physical Capital Stock: Sources, Methodology and Results. Revista de Analysisis Economico, 8 (1): 37-59.
Nkoro and Uko. 2016. Autoregressive Distributed Lag (ARDL) cointegration technique: application and interpretation. J. Stat. Econ. Methods. 5(4): 3.
Pesaran, M.H. and Shin, Y. 1999. An Autoregressive Distributed Lag Modelling Approach to Cointegration Analysis. Econometrics and Economic Theory in the 20th Century: The Ragnar Frisch Centennial Symposium, Strom, S. (ed.) Cambridge University Press.
Raza, S.A., Ali, Y. and Mehboob, F. 2012. Role of agriculture in economic growth of Pakistan. Int. Res. J. Finance Econ., 83(1): 180-186.
Rosegrant and Evenson. 1992. Agriculture Productivity and Sources of Growth in South Asia. Am. J. Agric. Econ., 757-761.
Rosegrant, M.W., Evenson, R.E. and Mahmood, M., 1993. Agricultural Productivity Growth in Pakistan and India: A Comparative Analysis [with Comments]. Pak. Dev. Rev., 32(4): 433-451.
Ruttan and Hayami. 1985. Agricultural Development: An International Perspective, Baltimore, MD (USA) John Hopkins.
Saleem, H., Shahzad, M., Khan, M.B. and Khilji, B.A. 2019. Innovation, total factor productivity and economic growth in Pakistan: a policy perspective. J. Econ. Struct., 8(1): 1-18.
Solow, R. 1956. A contribution to the theory of economic growth. Q. J. Econ., 70(1): 65–94.
Shahida, W. 1981. Technical change in Pakistan’s agriculture: 195354 to 1978-79. Pak. Dev. Rev., 20(4): 427-445.
Wizarat S. 1981. Technical change in Pakistan’s agriculture: 195354 to 1978-79. Pak. Dev. Rev., 20(4): 427-445.
To share on other social networks, click on any share button. What are these?


