

Effect of Oleander Aphid (Aphis nerii Boyer de Fonscolombe) on the Mortality and Biological Parameters of Green Lacewing (Chrysoperla carnea Stephen)


Effect of Oleander Aphid (Aphis nerii Boyer de Fonscolombe) on the Mortality and Biological Parameters of Green Lacewing (Chrysoperla carnea Stephen)
Mubasshir Sohail1,2,*, Raza Muhammad1 and Qadeer Ahmed Soomro1

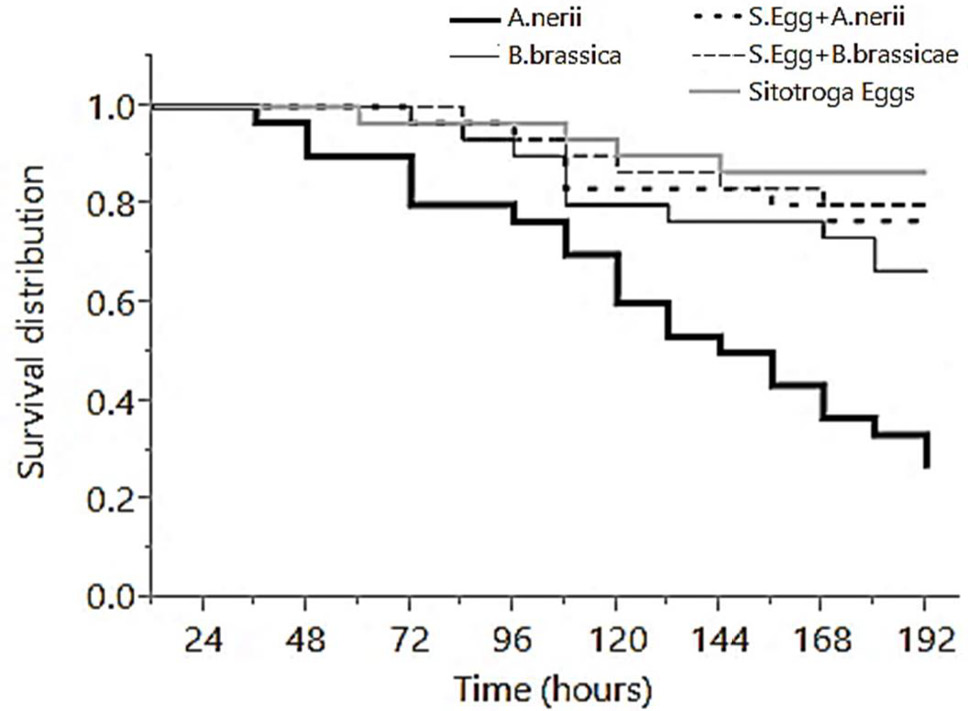
Survival plot of C. carnea larvae reared in vitro provided with different larval preys. Preys (A. nerri, B. brassicae, A. nerri + S. cerealella eggs, B. brassicae + S. cerealella eggs and S. cerealella eggs) were evaluated for the survival of C. carnea larvae. Legends identify different food sources by different line styles. Survival difference between larval preys was detected using a Log Rank and Wilcoxon test.

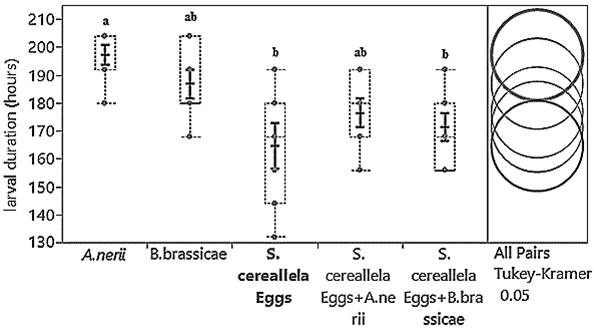
Larval duration of C. carnea is presented in this graph when provided with different larval preys. Black dots are denoting the values of larval duration in hours. The dotted line is presenting box plots and displaying means larval duration in response to various larval preys. All black solid vertical lines in box plots indicate ± SEM. Black circles at right, are presenting the treatment mean comparisons by using Tukey HSD.
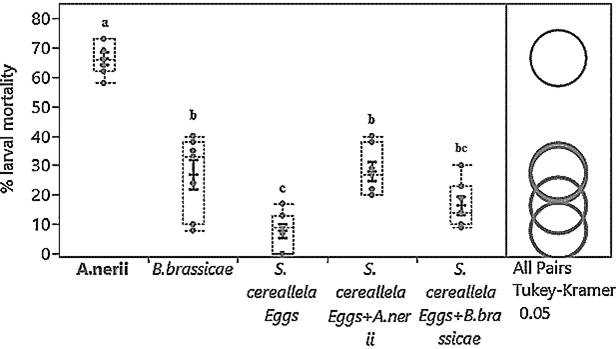
Percent larval mortality of C. carnea is presented in this graph when provided with different larval preys. Black dots are denoting the values of larval mortalities. The dotted line is presenting box plots and displaying means larval mortality in response to various larval preys. All black solid vertical lines in box plots indicate ± SEM. Black circles at right, are presenting the treatment mean comparisons by using Tukey HSD.

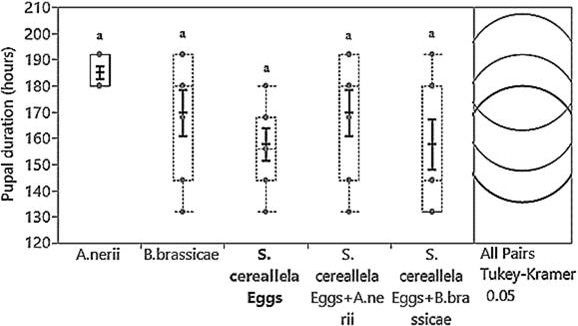
Pupal duration of C. carnea is presented in this graph when provided with different larval preys. Black dots are denoting the values of pupal duration in hours. The dotted line is presenting box plots and displaying means pupal duration in response to various larval preys. All black solid vertical lines in box plots indicate ± SEM. Black circles at right, are presenting the treatment mean comparisons by using Tukey HSD.

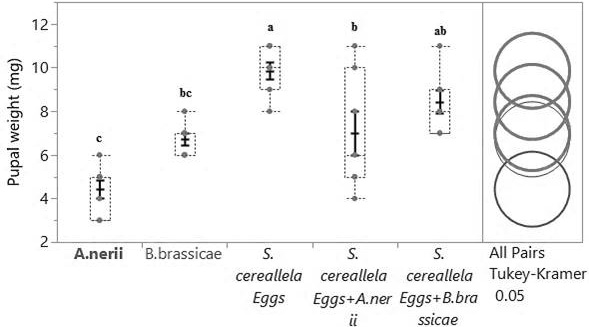
The pupal weight of C. carnea is presented in this graph when provided with different larval preys. Black dots are denoting the values of pupal weight in milligrams. The dotted line is presenting box plots and displaying means pupal weight in response to various larval preys. All black solid vertical lines in box plots indicate ± SEM. Black circles at right, are presenting the treatment mean comparisons by using Tukey HSD.

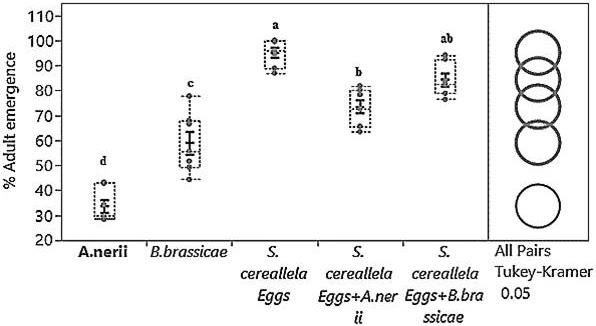
Percent adult emergence of C. carnea is presented in this graph when provided with different larval preys. Black dots are denoting the values of adult emergence. Dotted line is presenting box plots and displaying means adult emergence in response to various larval preys. All black solid vertical lines in box plots indicate ± SEM. Black circles at right, are presenting the treatment mean comparisons by using Tukey HSD.

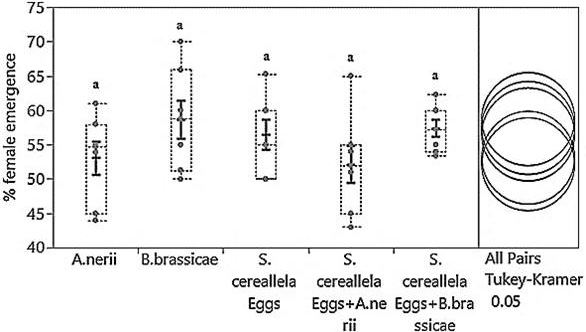
Percent female emergence of C. carnea is presented in this graph when provided with different larval preys. Black dots are denoting the values of female emergence. The dotted line is presenting box plots and displaying means female emergence in response to various larval preys. All black solid vertical lines in box plots indicate ± SEM. Black circles at right, are presenting the treatment mean comparisons by using Tukey HSD.


