
Effect of Different Fallow Tillage Systems Integrated with Glyphosate Herbicide on Soil Moisture Dynamics and Wheat Grain Yield


Effect of Different Fallow Tillage Systems Integrated with Glyphosate Herbicide on Soil Moisture Dynamics and Wheat Grain Yield
Safdar Ali1*, Ghulam Abbas Shah1, Muhammad Naveed Tahir1, Shahid Mehmood2, Asim Gulzar3 , Ijaz Ahmad4 and Bashir Ahmad Khan5

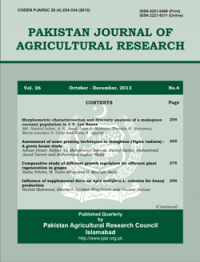
Monthly mean temperature of the ambient air (solid line) and cumulative rainfall (bars) during 2012-13 and 2013-14 (Ali et al., 2016b).

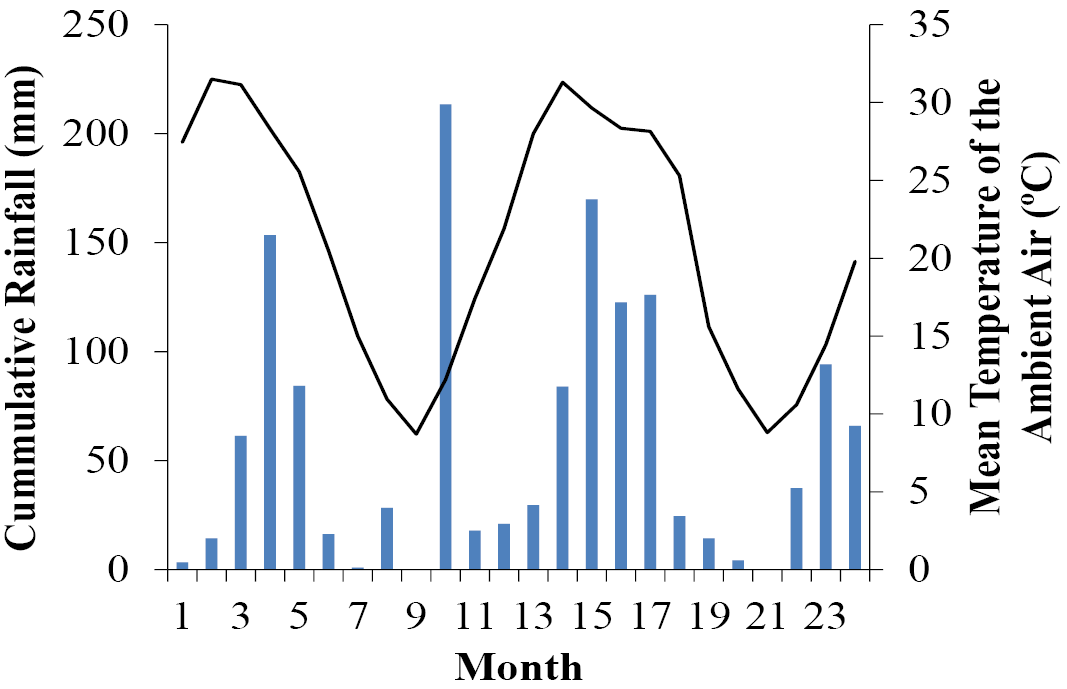
Relationship between soil bulk density and wheat grain yield of all treatments together (P < 0.05; y = 13.1-6.2525x; R2 = 0.47).

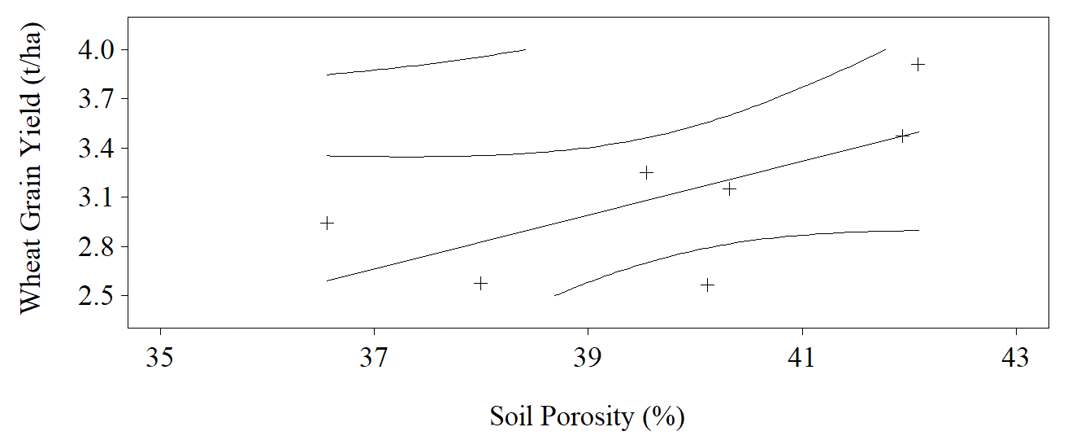
Relationship between soil porosity and wheat grain yield of all treatments together (P < 0.05; y = -3.3911 – 0.1637x; R2 = 0.46).
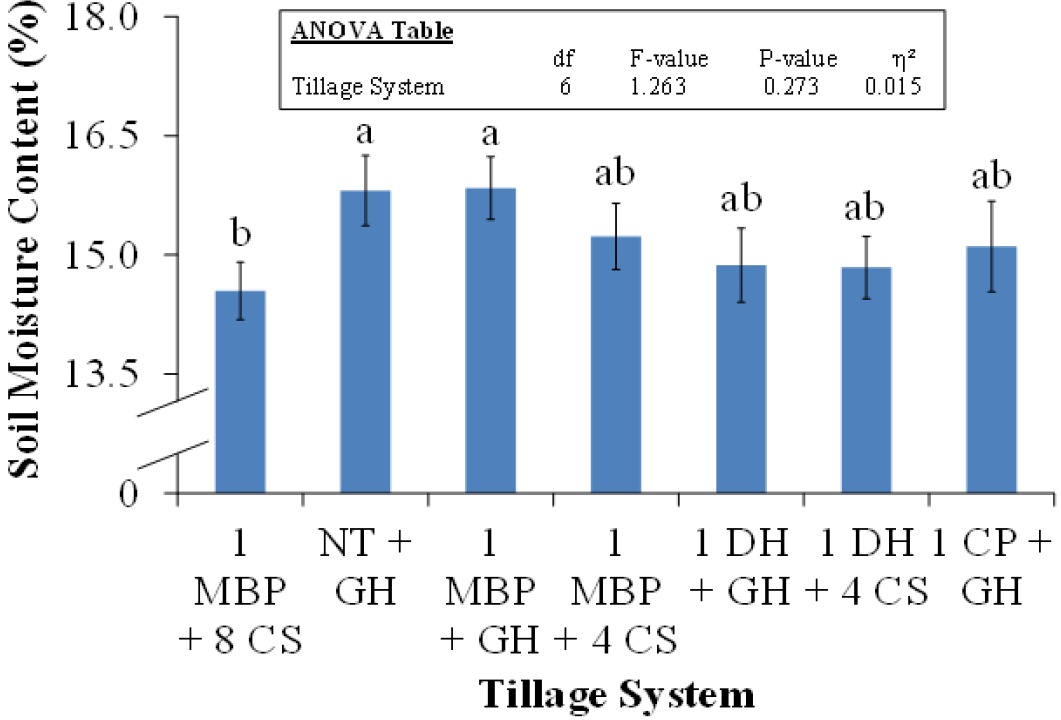
Effect of tillage system on soil moisture contents (Overall means of two years, three soil depths and three sampling stages). Small letters on bars indicate the difference among treatments at 5% probability level. Error bars shows standard error of the mean. Insets in figure represent outcomes of the analysis of variance (ANOVA).

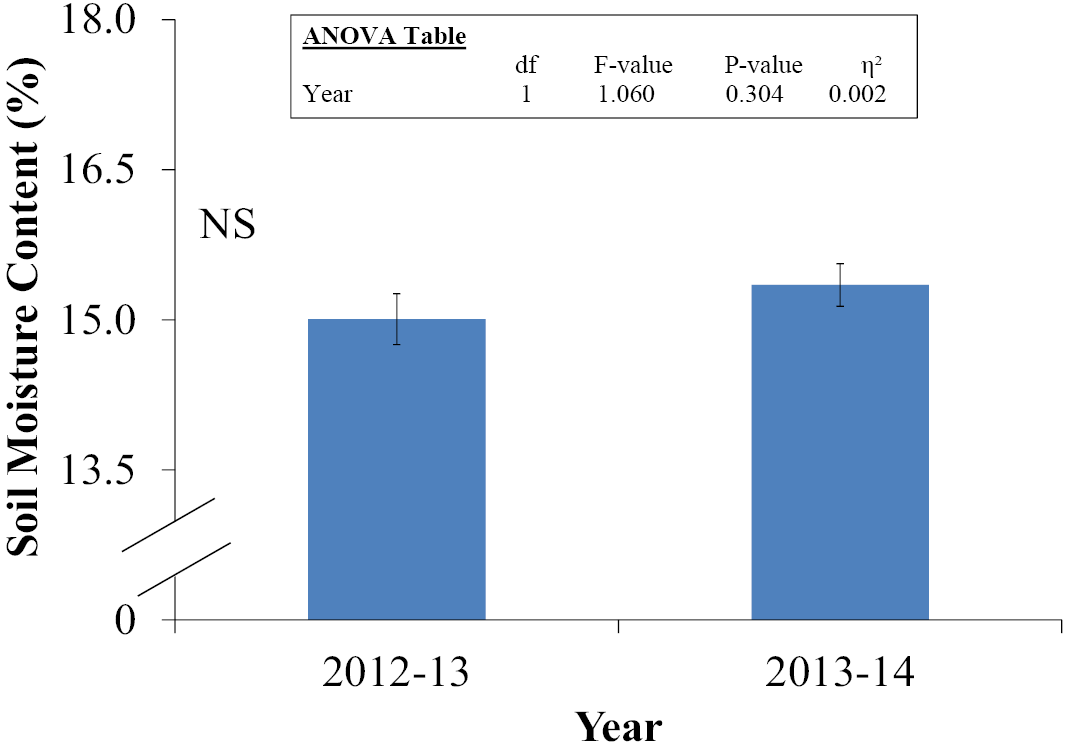
Effect of sowing year on soil moisture contents of all treatments together.Error bars shows standard error of the mean. Insets in figure represent outcomes of the analysis of variance (ANOVA); NS = non-significant.

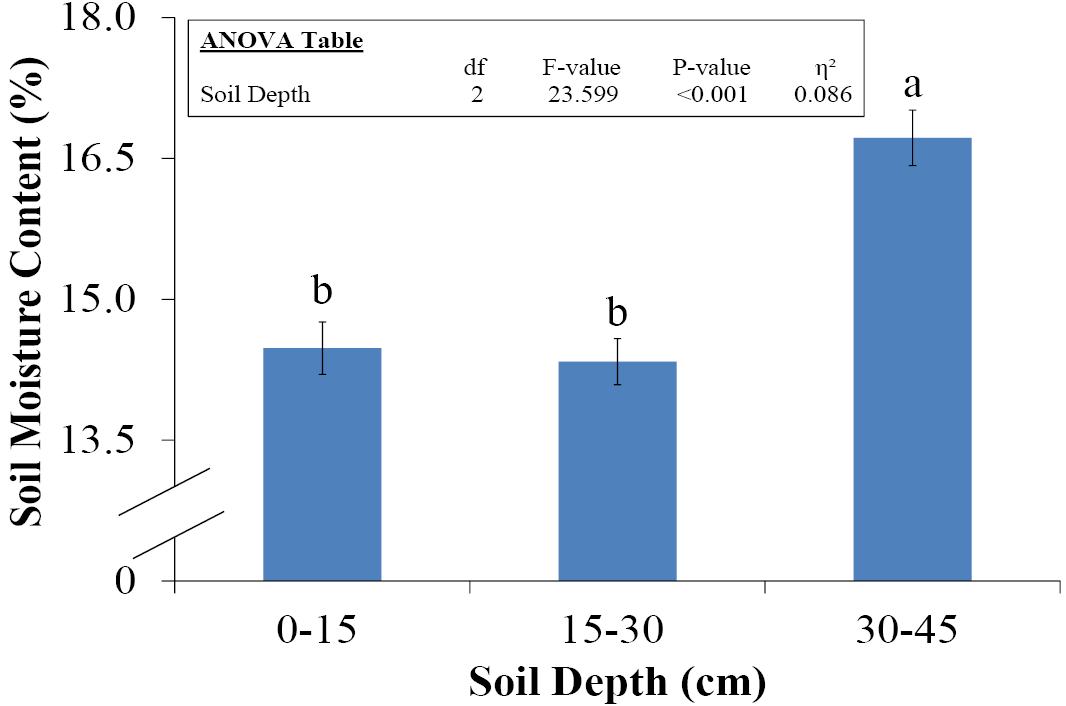
Effect of soil depth on soil moisture content of all treatments together.
Small letters on bars indicate the difference among treatments at 5% probability level. Error bars shows standard error of the mean. Insets in figure represent outcomes of the analysis of variance (ANOVA).
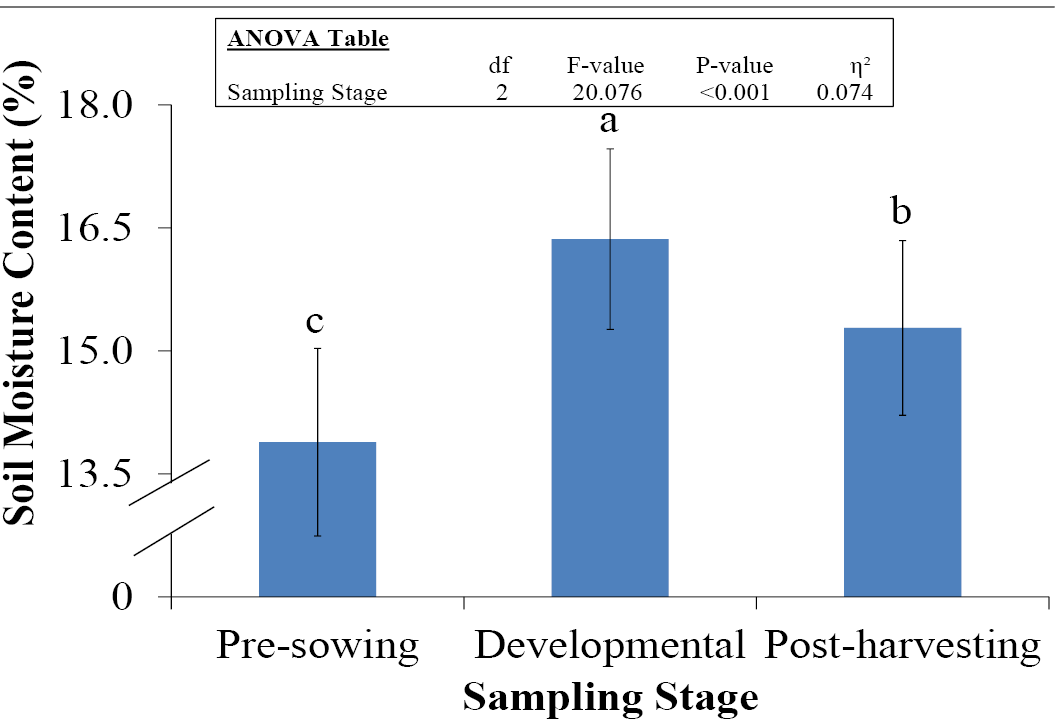
Effect of sampling stages on soil moisture content of all treatments together.
Small letters on bars indicate the difference among treatments at 5% probability level. Error bars shows standard error of the mean. Insets in figure represent outcomes of the analysis of variance (ANOVA).
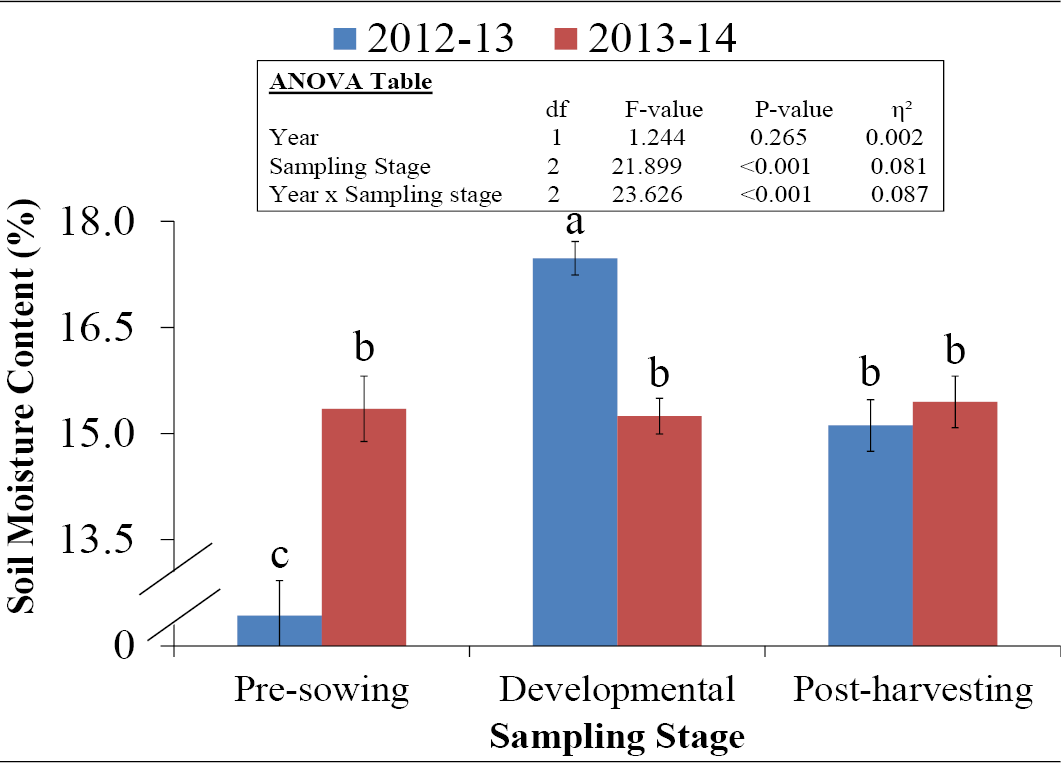
Effect of sampling stage on soil moisture content of all treatments together during 2012-13 and 2013-14.
Small letters on bars indicate the difference among treatments at 5% probability level. Error bars shows standard error of the mean. Insets in figure represent outcomes of the analysis of variance (ANOVA).

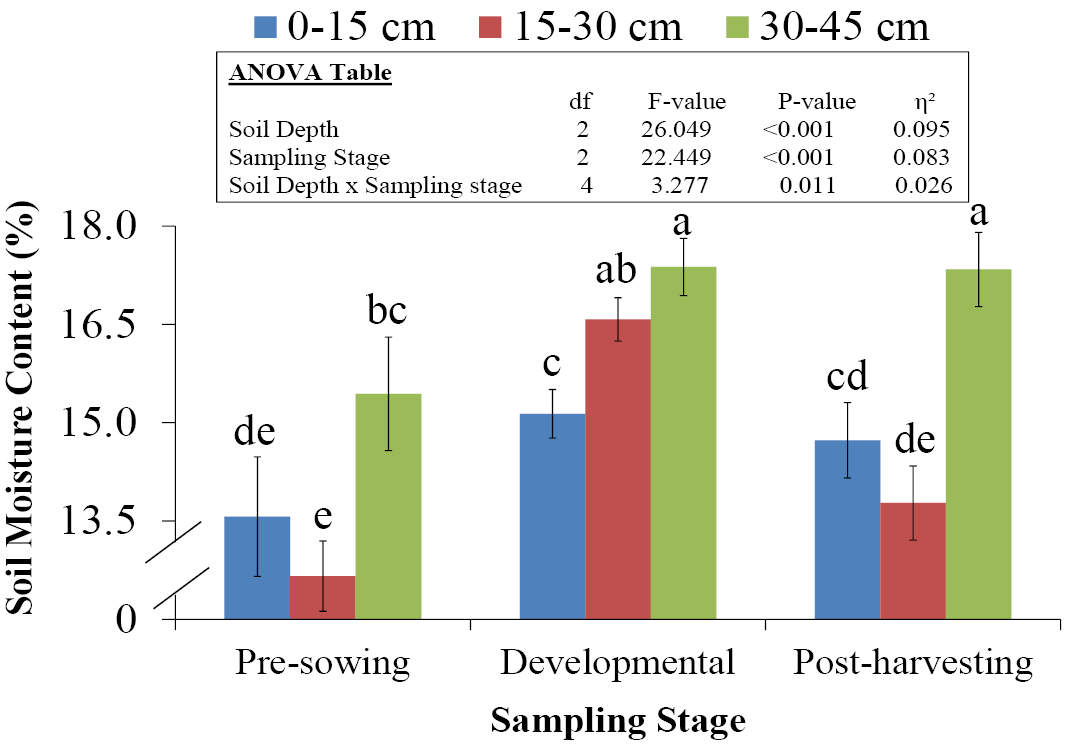
Effect of sampling stage and soil depth on soil moisture content of all treatments together.
Small letters on bars indicate the difference among treatments at 5% probability level. Error bars shows standard error of the mean. Insets in figure represent outcomes of the analysis of variance (ANOVA).
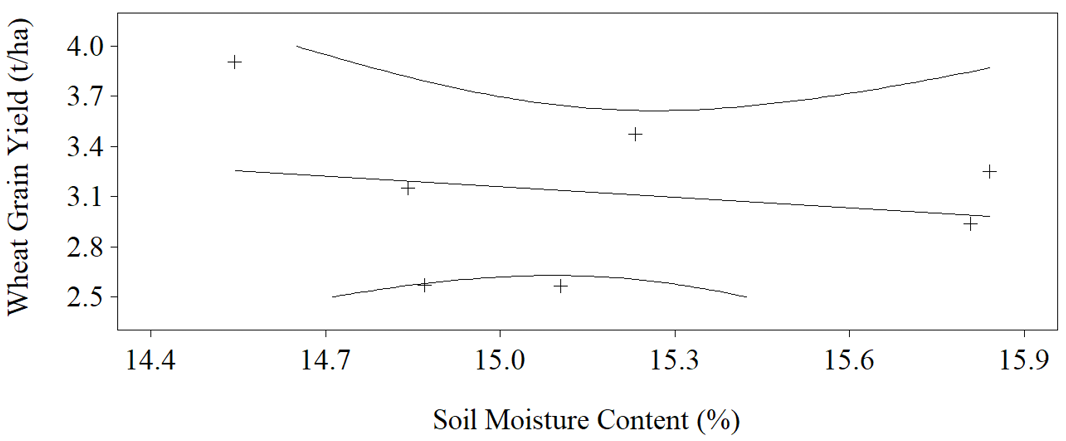
Relationship between soil moisture content and wheat grain yield of all treatments together (P > 0.05; y = 6.2949–0.2091x; R2 = 0.045).

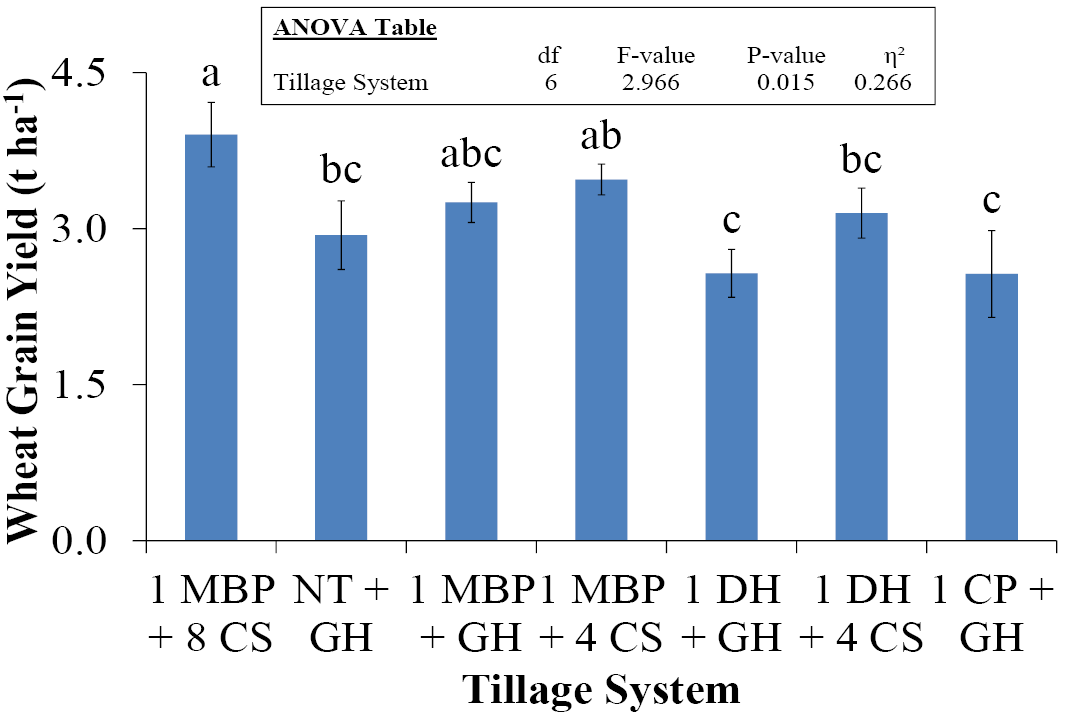
Effect of tillage system on wheat grain yield (Overall means of two years).Small letters on bars indicate the difference among treatments at 5% probability level. Error bars shows standard error of the mean. Insets in figure represent outcomes of the analysis of variance (ANOVA).
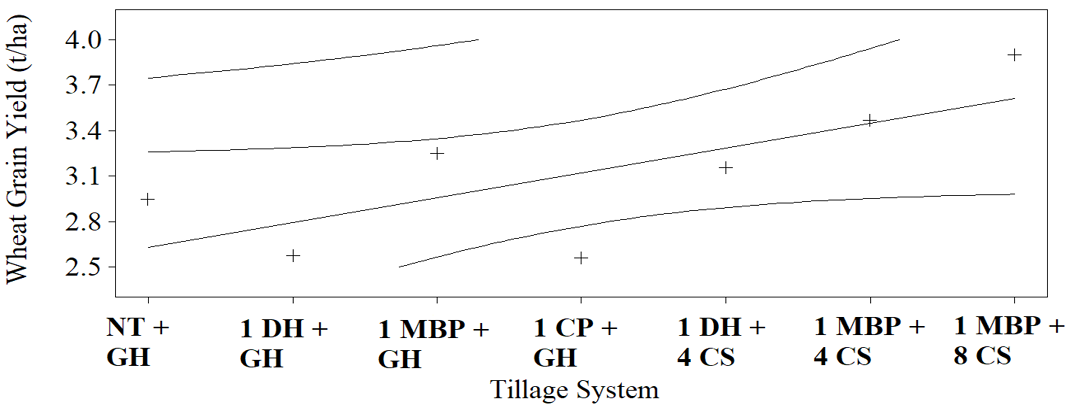
elationship between tillage system and wheat grain yield (P < 0.05; y = 2.4657 + 0.1636x; R2 = 0.54).
NT: No tillage; GH: Glyphosate herbicide; DH: Disc harrowing; MBP: Mouldboard ploughing; CP: Chisel ploughing; CS: Cultivations.

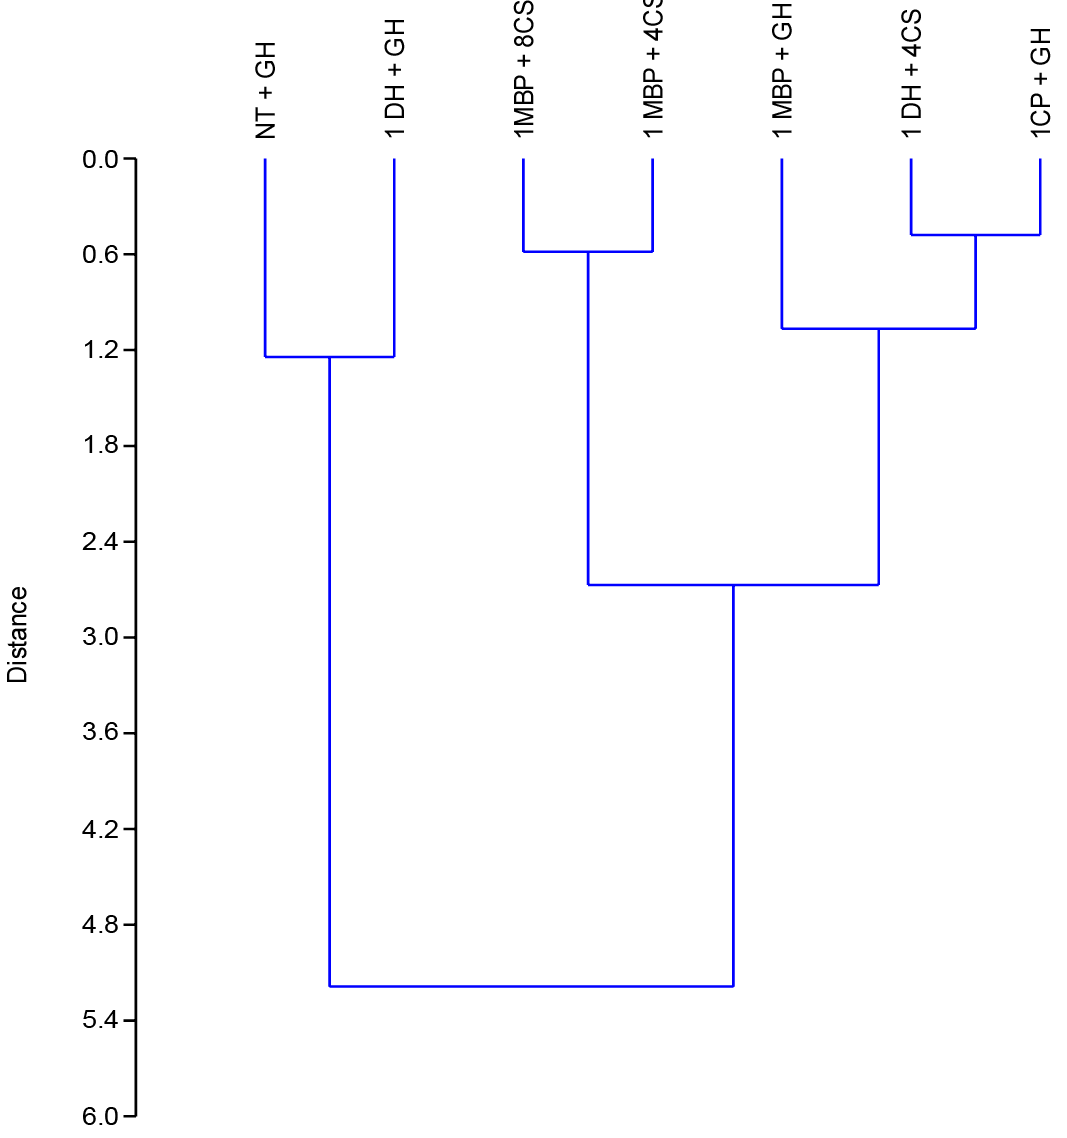
Dendrogram of cluster analysis showing Euclidean distances for various tillage systems based on studied parameters.
NT: No tillage; GH: Glyphosate herbicide; DH: Disc harrowing; MBP: Mouldboard ploughing; CP: Chisel ploughing; CS: Cultivations.


