

Diversity of Carabid Beetles (Coleoptera: Carabidae) under Three Grassland Management Regimes in Northwestern China


Diversity of Carabid Beetles (Coleoptera: Carabidae) under Three Grassland Management Regimes in Northwestern China
Hui Wang1,2, Yuchen Zhao1 and Xinpu Wang1,*
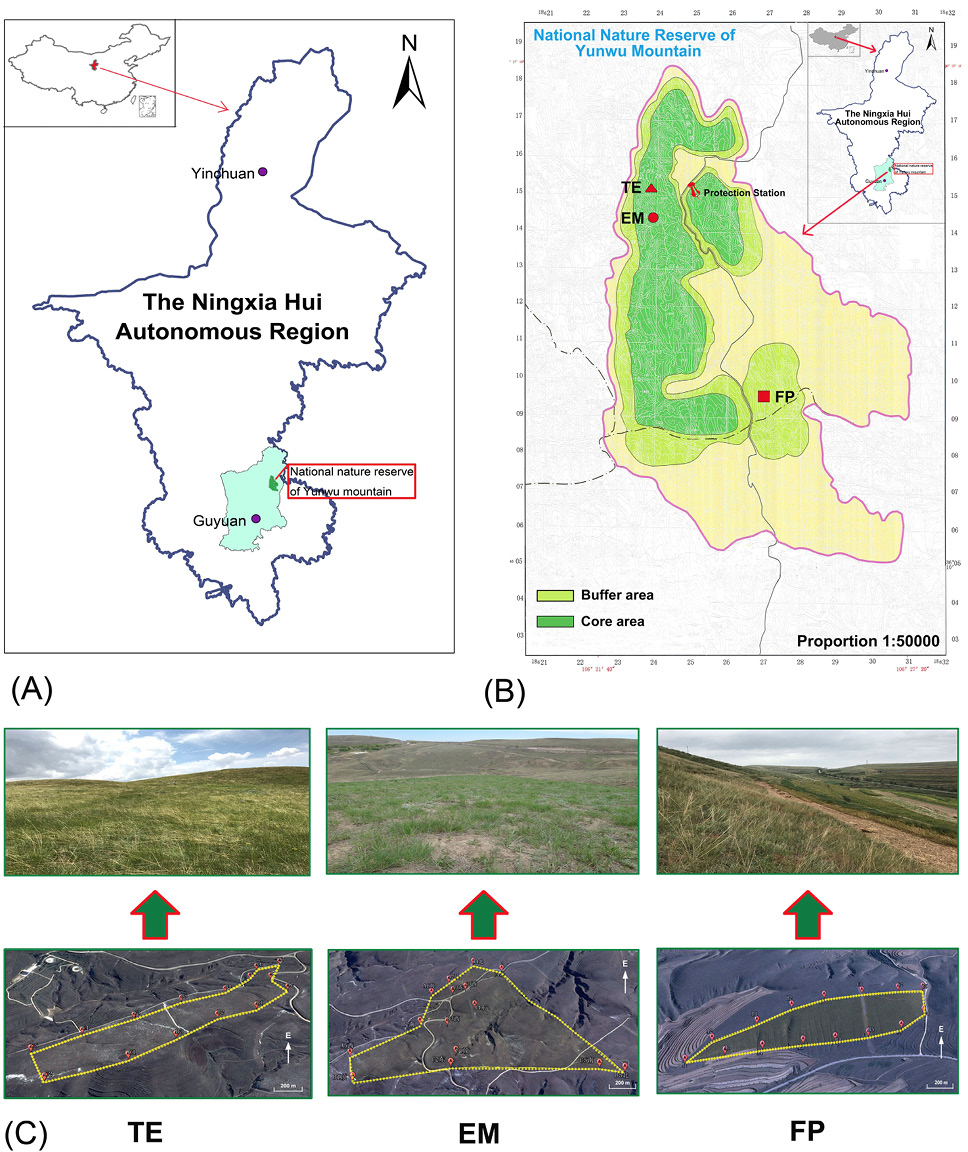
Study areas in southern Ningxia (A) where carabid beetles diversity was assessed (B) under three management regimes: TE, typical enclosure; EM, enclosed with mowing and FP, farmer grazing practice (C)

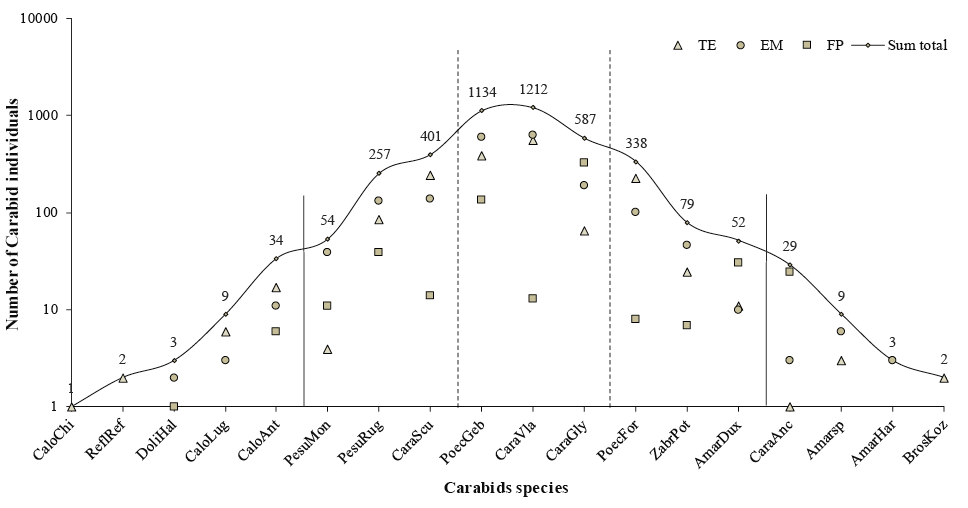
Carabidae species and individuals in the natural grassland of Yunwu Mountain. Vertical axes were log-transformed; CaloChi, Calosoma chinense; ReflRef, Reflexisphodrus reflexipennis; DoliHal, Dolichus halensis; CaloLug, Calosoma lugens; CaloAnt, Calosoma anthrax; PesuMon, Pseudotaphoxenus mongolicus; PesuRug, Pseudotaphoxenus rugipennis; CaraScu, Carabus sculptipennis; PoecGeb, Poecillus gebleri; CaraVla, Carabus vladimirskyi; CaraGly, Carabus glyptoterus; PoecFor, Poecillus fortipes; ZabrPot, Zabrus potanini; AmarDux, Amara dux; CaraAnc, Carabus anchocephalus; Amarsp, Amara sp; AmarHar, Amara harpaloides; BrosKoz, Broscus kozlovi.

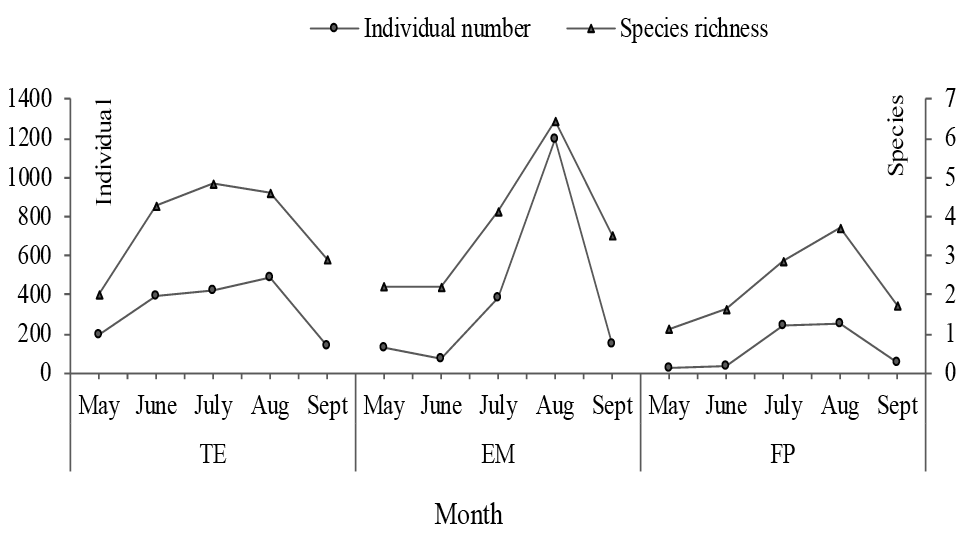
Temporal dynamics of carabid beetle individual and species richness in different management regimes.
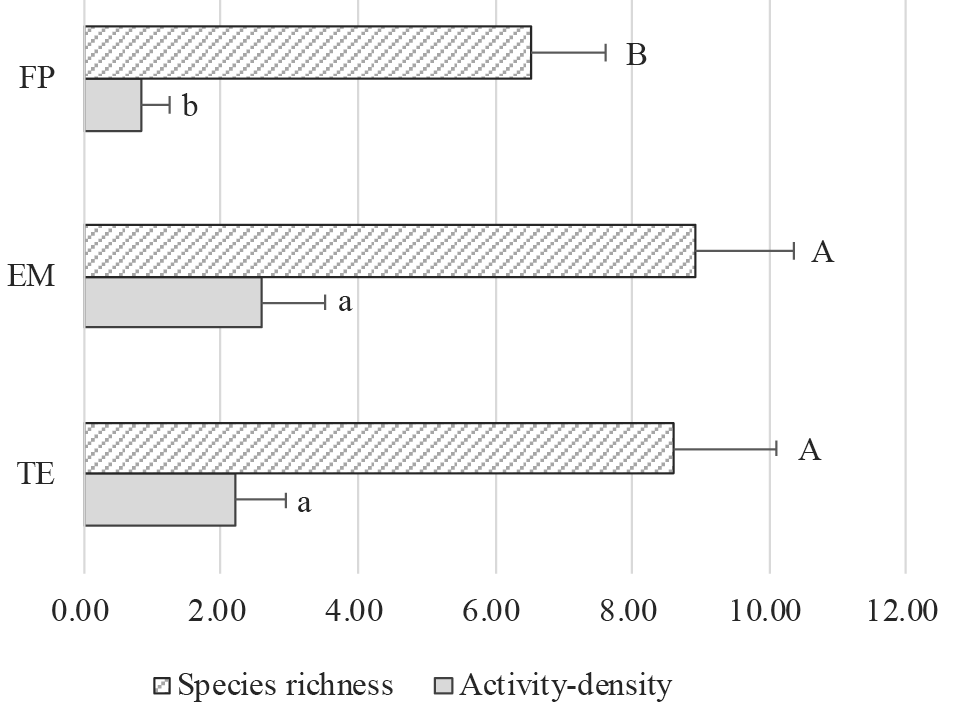
Spatial dynamics of carabid beetle activity density and species richness in different management regimes; ANOVA was used to compare differences among different interference levels. Different letters on the same type of bar indicate significant differences at the P < 0.05 level.

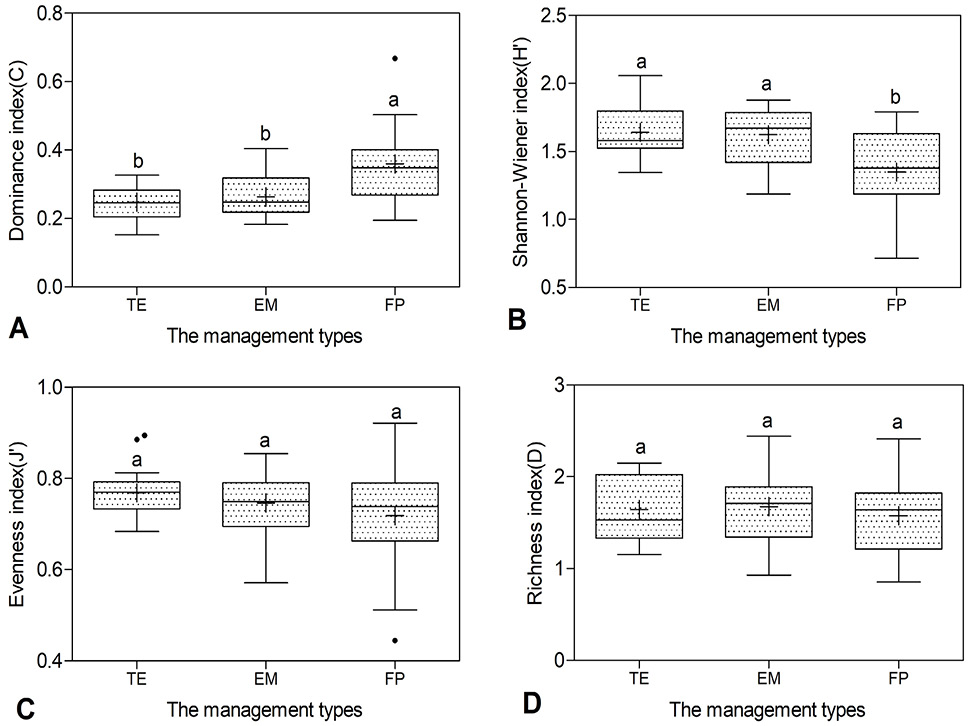
Boxplot of (A) Dominance index, (B) Shannon-Wiener index, (C) Evenness index, (D) Richness index; The differences of carabid community diversity indices among different types of interference were compared using the one-way ANOVA. Different letters above the boxes indicate significantly different means according to the Tukey test (P < 0.05).
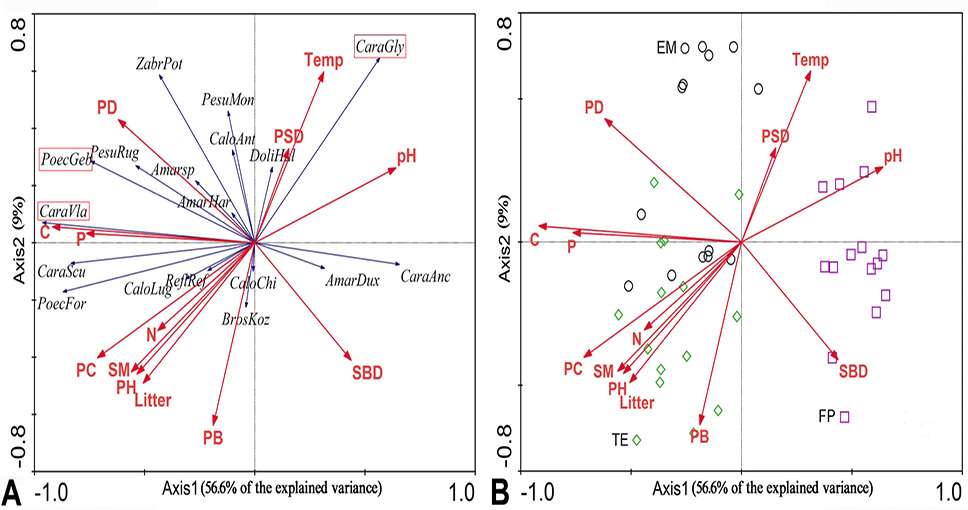
PCA ordination of (A) 18 species of beetle and 13 environmental factors, (B) 45 sample sites and 13 environmental factors; PB, Plant biomass; PC, Plant coverage; PD, Plant density; PH, Plant height; PSD, Plant species diversity; Litter, Aboveground litter; SBD, Bulk density; SM, Soil moisture; Temp, Soil temperature; C, Soil organic matter; P, Total phosphorus; N, Total nitrogen; pH, pH value. Environmental factors are represented by red arrows, carabid species are represented by blue arrows, dominant species are enclosed in red rectangular boxes.


