
Determinants of Poultry Technology Adoption: Evidence from District Lasbela, Balochistan, Pakistan


Research Article
Khalid Khan1*, Ahmed Farhan Saeed2, Sanam Wagma Khattak3 and Saima Liaqat4
1Department of Economics, Lasbela University of Agriculture, Water and Marine Sciences, Uthal, Balochistan; 2Area Study Center (Russia, China & Central Asia) University of Peshawar, KP, Pakistan; 3Department of Economics University of Peshawar, KP, Pakistan; 4Department of Economics, University of Queensland, Brisbane, Australia.
Abstract | Presently in Pakistan, Poultry meat consumption is the foremost source of protein and nutrients for the general masses. The prime impact of the poultry industry is to provide an inexpensive and economical source of meat with high nutrients value to the masses. Keeping in view, the significance and need of dietary protein and it is easy availability, the study has underlined the key determinants of adoption of improved poultry practices and technology in the poultry industry of district Lasbela, Balochistan; Pakistan. A multistage random sampling method was adopted to select the samples of 75 farmers from five tehsils of Lasbela namely Hub, Gadani, Uthal, Dureji, and Bela. Around 15 farmers were randomly selected and questioned in each of the tehsil. To achieve the objectives of study nonparametric correlation coefficient test and regression analysis are carried out. The study accentuated various factors which are responsible for the adaptation of poultry technologies and their standard practices. The study found that the lack of education, training, availability of credit and information, managerial skills, low income, and market accessibility are the key impediments to the adoption of advanced technologies and standard practices in the poultry business in the district. Nevertheless, it is noteworthy to mention that once the farmer applies improved practices and technologies, then these factors may no longer be crucial to the farmer’s decision of adaptability of improved poultry practice and technologies. This study also revealed that the availability of credit, information, proper training, and accessibility to market to non-adopted farmers turn as a great incentive to adopt improved practices and technology to augment their production and income.
Received | April 03, 2021; Accepted | February 14, 2022; Published | July 23, 2022
*Correspondence | Khalid Khan, Department of Economics, Lasbela University of Agriculture, Water and Marine Sciences, Uthal Balochistan; Email: khalidkk82@yahoo.com
Citation | Khan, K., A.F. Saeed, S.W. Khattak and S. Liaqat. 2022. Determinants of Poultry Technology Adoption: Evidence from District Lasbela, Balochistan, Pakistan. Sarhad Journal of Agriculture, 38(3): 960-967.
DOI | https://dx.doi.org/10.17582/journal.sja/2022/38.3.960.967
Keywords | Poultry production, Improved practices, Rural development, Lasbela, Balochistan
Copyright: 2022 by the authors. Licensee ResearchersLinks Ltd, England, UK.
This article is an open access article distributed under the terms and conditions of the Creative Commons Attribution (CC BY) license (https://creativecommons.org/licenses/by/4.0/).
Introduction
Every civilized country needs to provide its people with sustainable and healthy food at reasonable prices. In the contemporary world, the objective of food security is gradually becoming one of the momentous among all other socioeconomic objectives. Presently in the developing world, most people have no access to enough food to meet their nutritional needs for a healthy and productive life. A stable and balanced diet is indispensable for a good healthy life, whereas proteins are one of the important components of a balanced diet, which can be attained from two chief sources, i.e., animals and plant proteins. In Pakistan, human nutrition lacks animal protein, as nearly 66% of Pakistani has no animal protein in their everyday food (Maqbool et al., 2005). Nevertheless, the standard protein requirement in the diet is 102.7 gm per person per day and an average Pakistani consumes 69.61 gm protein per person per day only. This amount of protein consumption is very low from the standard requirements of the proteins. Therefore, such a scene depicts a big gap between the supply and demand of proteins in the country. Generally, in Pakistan, beef, milk, and poultry are the chief sources of animal proteins. However, as compared to others, there is immense potential in the poultry industry to bridge this gap between protein supply and demand with a relatively short payback period and most economical and effective ways besides the fact that poultry meat carries profusely proteins and low in calories thus safe for heart patients. At the moment in the country, the existing poultry infrastructure can reduce the gap between supply and demand of protein intake; if the government addresses some of the basic technical and economic problems of the poultry industry. In addition, to ensure the provision of new technology and training to the farmers with improved practices in poultry farming, which can flourish their businesses and thus the whole industry.
Since 1964, poultry production was started in Pakistan on a commercial basis, earlier poultry was considered just a cottage industry, and old conventional approaches were used to produce poultry production. In the first three decades, the growth of the poultry sector was pretty extraordinary and mushrooming. However, later, with the passage of time, the poultry production did not cope with the modern lines as new technologies were not adopted, and that severely affected its productivity to a great extent. Notwithstanding, the poultry sector has an important contribution to food security and economic growth in Pakistan, nevertheless, no systematized efforts have been taken by the government to put this industry in the modern line, especially in rural areas (Khan et al., 2018). Moreover, there is no systemic research on the factors that influence farmers’ decisions to invest and adopt improved poultry practices and technology.
The introduction of modern technology in the agricultural sector is inevitable as contemporary technology has the potential to improve performance and efficiency as well as reduce the risk of uncertainty, in agriculture. Furthermore, it may also improve and maintain the nutritional balanced diet and quality of food in combating food insecurity (Jack, 2013). The poorest population of the world is mainly associated with the agriculture sector, particularly in South Asia and Sub-Saharan Africa (Bunnika et al., 2019). At the same time, the agricultural sector is a potential source of income and employment in these regions. Besides other factors, the use of modern and advanced technologies in the agricultural sector will probably play an important role in the fight against poverty and to upsurge the per capita income of the people in these regions.
Naved (2006) and Chen et al. (2016), offered a qualitative debate on the intrinsic impact of the technological transfer of modern agriculture in Bangladesh. This study mainly compares the impact of agricultural programs aimed to improve the income of female households. The results of the study exhibited that the adoption of technology in fish production gives better results. Foster et al. (2010) analyzed the impact of the technical adaptation on Gross Domestic Production (GDP) per capita and wages among countries. The results suggested that the adoption and effective use of up-to-date technology contribute to economic growth and development. Similarly, Singh et al. (2013) highlighted the impact of socioeconomic standards in the adoption of technology in the agricultural sector in the state of Bihar, India. Macours (2014) examined the challenges and limitations associated with the adoption of modern technologies in the agricultural sector. He used the micro-level technique to understand agricultural practices and production challenges in Nicaraguan. The study provided arguments on the complexity of understanding the decision of adoption and non-adaptation and clarifies the fundamental decision-making processes.
To determine the momentous factors affecting the farmer’s decision about the use of potentially improved practices, this study is essential to provide a better understanding of the factors that affect the speed and adoption of new technologies in the poultry sector. Further, the study might assist the institutions involved in the development and transfer of technologies to the farmers. It will benefit the policymakers to develop and prioritize the allocation of investment and funds to advance technology. Also, the study examines the degree of adoption of the factors affecting the intake of poultry improved practices and technology in the district. The next section deals with methodology and data, whereas part three of the study describes the empirical results of the study. Finally, the last section offers the conclusion and recommendations of the study.
Objectives of the study
The objective of this study is to determine the momentous factors which affect the farmers’ decision about the use of potentially improved practices and appropriate technology in poultry production in district Lasbela, Balochistan.
Table 1: Disaggregation of sample size into five parts: Tehsil/ U.C.
|
n |
N |
Ni |
NI= n/N × Ni |
Approximation |
|||
|
75 |
150 |
20 |
0.5 × 20=10.0 |
10 |
|||
|
Bela (N2) |
75 |
150 |
25 |
0.5 × 25=12.5 |
13 |
||
|
Gadani (N3) |
75 |
150 |
40 |
0.5 × 40=20.0 |
20 |
||
|
Uthal (N4) |
75 |
150 |
45 |
0.5 × 45=22.5 |
22 |
||
|
Dureji (N5) |
75 |
150 |
20 |
0.5 × 20=10.0 |
10 |
||
|
Total |
--- |
--- |
150 |
---- |
75 |
||
|
Disaggregation of sample size into two parts: Adopted Respondents and Non-Adopted Farmers |
|||||||
|
Tehsil/ U.C |
Adopted Farmers |
Non-adopted Farmers |
|||||
|
Hub |
10 |
6 |
4 |
||||
|
Bela |
13 |
5 |
8 |
||||
|
Gadani |
20 |
11 |
9 |
||||
|
Uthal |
22 |
12 |
10 |
||||
|
Dureji |
10 |
4 |
6 |
||||
|
Total |
75 |
38 |
37 |
||||
Note: Tehsil is the subset of a district/county while is the same is Union Council (UC).
Source: Author’s Creation.
Materials and Methods
Data collection
This study has been conducted in district Lasbela, Balochistan. A multistage random sampling method was used to select a sample of 75 farmers from the areas i.e., Hub, Gadani, Uthal, Dureji, and Bela (Table 1). Around 15 farmers were randomly interviewed and questioned in each of the areas. For every Tehsil and Union Council of the district, samples were selected randomly based on the following equation:
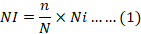
Where;
NI= potential number of the respondents in each tehsil/union council, i= takes the value of 1,2,3,4 and 5, N1= tehsil/union council, N=entire population of the farmers in the district, n = entire sample size i.e., 75, Ni= total number of the farmers in targeted tehsil/union council.
Variables of the Study
The dependent variable of the study is the binary variable which takes the value of 1 if the farmer uses standard technology and practices in poultry farming and 0 if otherwise. Moreover, a comprehensive description of all the explanatory variables in research can be found in Table 2. However, the explanatory variables are mixed with both continuous and binary variables.
Econometric model of the study
To achieve the objective of the study with more sophisticated and accurate means, a nonparametric correlation coefficient test has been applied to understand the degree of association between responsive and exploratory variables. This nonparametric test is the Spearman rank-order correlation coefficient. The formula of Spearman rank-order correlation is given below:
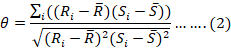
Where;
Ri is the rank of xi, Si is the rank of Yi, R̅ is the mean of the Ri values, and S̅ is the mean of the Si values. Equation (2) is applied to estimate the Spearman correlation coefficients by ranking the data and using the ranks in the Pearson product-moment correlation formula. If there is a tie, between the ranks, then the average ranks will be used. Moreover, the t-values for testing of the Spearman correlation coefficients are calculated with the given formula to test the significance of the correlation coefficients.
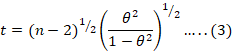
Where;
t =distribution of probability values, (n-1)=degrees of freedom, and θ = the sample Spearman correlation. Next, to quantify the specific impact on explanatory variables on the dependent variable, the study applied the following econometric framework, which elucidates the ascertain impact of the explanatory variables on the dependent variable.
Table 2: Description of the explanatory variables.
|
Variables |
Explanation |
ES |
|
Age |
Age of the farmer in years |
(-) |
|
Literacy |
1 = if the farmer is literate and 0 otherwise |
(+) |
|
Education level |
Education level of the farmer (ordered dummies if 0=illiterate; 1=primary; 2=middle; 3= matric; 4= F.A/F.Sc 5=B.A/B.Sc and above |
(+) |
|
Labor |
Measured in hours |
(+) |
|
Quantity of feeds |
1 = If the farmer is using standard feeds and 0 otherwise |
(+) |
|
Poultry management skills |
1 = if the farmer has managerial skills and 0 otherwise |
(+) |
|
Creditfacility |
1 = if the farmer has access to credit and 0 otherwise |
(+) |
|
Family size |
Total family size of the farmer |
(+) |
|
Mass media exposure |
1 = if the farmer is exposure to mass media and 0 otherwise |
(+) |
|
Vaccination |
1 = if the farmer uses vaccination and 0 otherwise |
(+) |
|
Income |
Per month income of the farmer in PKR |
|
|
Training |
1 = if farmer has received any relevant training and 0 otherwise |
(+) |
|
Other source of income |
1 = if the farmer has other source(s) of income and 0 otherwise |
(+) |
|
Marketability issues |
1 = if the farmer face poultry market problems and 0 otherwise |
|
|
Distance to market |
Distance from farm to market in kilometers |
(+) |
|
Market information |
1 = if the farmer has access to information about market and 0 otherwise |
(+) |
|
Experience |
Number of years since doing poultry |
(+) |
|
Primary occupation |
1 = if the farmer primary occupation is poultry farming and 0 otherwise |
(+) |
Note: (ES) Expected signs of the variables in the light of established literature. Moreover, gender is not considered anexploratory variable in the model as all of the farmers in the study area are male.
Table 3: Disaggregation of sample size into two parts: low adopters, limited adopters and high adopters subject to usage of improved practices and technology.
|
Adopted Farmers |
Non-adopted Farmers |
||||
|
Score range |
Frequency |
Percentage |
Frequency |
Percentage |
|
|
<22.34 |
11 |
29 |
09 |
24 |
|
|
PA |
22.34-39.51 |
19 |
50 |
15 |
41 |
|
HA |
>39.51 |
08 |
21 |
13 |
35 |
|
Total |
75 |
38 |
100 |
37 |
100 |
|
Mean |
29.70 |
21.13 |
|||
|
S. D |
6.51 |
7.31 |
|||
LA: Low adopters; PA: Partial adopters; HA: High adopters.
Y= α0+α1 x1i+α2 x2i+α3 x3i+α4 x4i+α5 x5i+α6 x6i+α7 x7i+α8 x8i+α9 x9i+α10 x10i+α11 x11i+α12 x12i+α13 x13i+α14 x14i+α15 x15i+α16 x16i+α17 x17i+μt ……(4)
Where;
Y = level of adoption of improved poultry farming practices and technology (dependent variable), x1i = age, x2i = literacy, x3i = education level, x4i =labor, x5i =quantity of feed, x6i =poultry management skills, x7i =credit facility, x8i = vaccination, x9i = mass media exposure, x10i = income, x11i =training, x12i = other sources of income, x13i = marketability issues, x14i = distance to market, x15i = market information, x16i = experience, x17i = primary occupation, α0= intercept of the estimated regression line or constant, αi= co-efficient of the estimated regression line.
Results and Discussion
Based on the usage of improved practices and technology in poultry production, the producers were classified as low adopters, partial adopters, and high adopters. This intensity of usage of improved practice, and technology were estimated by applying the following formula:

Table 3 shows that almost half of the farmers (51.54%) adopted improved poultry practices and technology in poultry farming. Whereas the degree of the farmers’ adoption of improved poultry practices and technology were classified as LA, PA, and HA. Hence, the results of Table 3 revealed that the percentage of LA, PA, and HA are 21%, 50%, and 21% respectively.
Table 4: Practice-wise extent of adoption of poultry farming practices by the farmers.
|
Adopted Farmers |
Non-adopted Farmers |
|||||||||
|
Improved Practices* |
LD |
PA |
HA |
ZU |
TA |
LD |
PA |
HA |
ZU |
TA |
|
Selection of healthy and quality breed |
06 |
12 |
20 |
0 |
38 |
16 |
05 |
04 |
12 |
37 |
|
Proper density of birds |
04 |
09 |
18 |
07 |
38 |
16 |
05 |
04 |
08 |
37 |
|
Housing Management |
||||||||||
|
Protection of birds from predators |
03 |
17 |
16 |
02 |
38 |
23 |
02 |
07 |
05 |
37 |
|
Provision of ventilations |
09 |
14 |
11 |
04 |
38 |
05 |
08 |
08 |
16 |
37 |
|
Heating and cooling system **(Preservation of temperature between 30-33°C) |
05 |
13 |
20 |
0 |
38 |
09 |
07 |
03 |
18 |
37 |
|
Preservation of humidity between 40-46% for 28 days |
09 |
13 |
12 |
04 |
00 |
06 |
10 |
07 |
14 |
37 |
|
Feeding and Nutrition |
||||||||||
|
Balanced diet |
03 |
08 |
25 |
2 |
38 |
15 |
02 |
03 |
17 |
37 |
|
Clean water |
04 |
17 |
12 |
05 |
38 |
07 |
08 |
05 |
17 |
37 |
|
Selection of feed which has been approved from the respective authority of quality control |
04 |
15 |
17 |
02 |
38 |
18 |
09 |
02 |
08 |
37 |
|
Health Care and Culling |
||||||||||
|
Removal of weak and ill birds |
11 |
20 |
07 |
0 |
38 |
03 |
18 |
9 |
07 |
37 |
|
Record keeping of mortality rate |
09 |
22 |
06 |
1 |
38 |
03 |
10 |
18 |
07 |
37 |
|
Vaccination (preferably at 3 weeks of age) |
08 |
10 |
20 |
0 |
38 |
16 |
06 |
03 |
12 |
37 |
|
Dust floor management and coving with fodder |
05 |
07 |
23 |
03 |
38 |
16 |
09 |
05 |
07 |
37 |
LA: Low adopters; PA: Partial adopters; HA: High adopters; ZU: Zero Use; TA: Total adoption; TS: total score; *: shows the usage of improved practices and technology in poultry production by the framers in the district; **: Subject to the weather condition in the district.
Even though, the other counterparts do not accept the improved poultry practices and technology due to some unforeseen factors their percentage of LA, PAA, and HA are 24%, 41%, and 35% respectively. The average value of 28.80 shows that farmers who adopted the improved poultry practices and technology in poultry farming are generally in a much better position. While in the case of non-adopter farmers, the corresponding average value is 22.58, which shows that they are suffered in terms of revenue and profit, due to the inadaptability of improved poultry practices and technology. The discrepancy in the average score of 6.22 evidently shows that there was a substantial difference between the two categories of respondents. This underlines that technical interventions are very crucial in the sector to improve the revenue, productivity, and profit of the farmers by arranging practical training programs for the farmers, especially for those who are not willing to adopt improved practices and technology in poultry farming.
The level of adaptation of improved poultry breeding practices is reported in Table 4. The data in Table 4 illustrates the recommended and up-to-date practices in poultry production which are: the selection of healthy and quality breed, the proper density of birds, protection of birds from predators, heating and cooling system (preservation of temperature between 30-33°C), balanced diet, clean water, feed selection which has been approved from the respective authority of quality control, removal of weak and ill birds record-keeping of mortality rate, vaccination (preferably at 3 weeks of age) and dust floor management and coving with fodder. Moreover, the inference of Table 4 is also endorsed by the results Table 2 which shows that the extent of up-to-date practices applied by the adopted as equated to non-adopted farmers.
Likewise, to study the nature of the relationship between individuals’ socioeconomic characteristics and the degree of adoption of improved poultry practices and technology, the rank order correlation coefficients were estimated. The results are reported in Table 5 which suggests that the coefficients of all explanatory variables of the model, i.e., age, literacy, education level, labor, the quantity of feed, poultry management skills, credit facility, vaccination, income, training, other sources of income, marketability issues, distance to market, market information, experience, primary occupation, and mass media exposure are within the specified range i.e., -1≤ rs ≤ 1. All the variables have a positive and significant association with the adoption of improved poultry breeding practices except for age, labor, marketability issues, distance to market, market information, and experience. Moreover, the results of Kumar et al. (2007), are also supporting our finding where the household’s occupation, played an important role in the decision-making process of the adoption of innovations. Our results are endorsed by Rahman (2007) and found that the adoption of better livestock farming technologies is linked to education, agricultural experience, and training. Similarly, Teklewold et al. (2006) also testified similar results for extended services and contacts to adopt poultry technology.
Table 5: Relationship and contribution of independent variables towards dependent variable.
|
AR |
NAR |
|
|
Exploratory Variables |
θ value |
θ value |
|
x1 |
0.0812 |
0.0821 |
|
x2 |
0.1032 |
0.1102 |
|
x3 |
0.1201 |
0.1300 |
|
x4 |
0.1430 |
0.1451 |
|
x5 |
0.0230 |
0.0201 |
|
x6 |
0.0541 |
0.0423 |
|
x7 |
0.0921 |
0.0911 |
|
x8 |
0.1010 |
0.0981 |
|
x9 |
0.0281 |
0.1245 |
|
x10 |
0.4310 |
0.9120 |
|
x11 |
0.1123 |
0.8120 |
|
x12 |
0.1620 |
0.1621 |
|
x13 |
0.4310 |
0.4310 |
|
x14 |
0.0210 |
0.0200 |
|
x15 |
0.1012 |
0.1017 |
|
x16 |
0.1320 |
0.1320 |
|
x17 |
0.1033 |
0.1031 |
Y = level of adoption of improved poultry farming practices and technology (dependent variable), x1i= age, x2i = literacy, x3i = education level, x4i =labor, x5i =quantity of feed, x6i =poultry management skills, x7i =credit facility, x8i = vaccination, x9i = mass media exposure, x10i = income, x11i=training, x12i = other sources of income, x13i = marketability issues, x14i = distance to market, x15i = market information, x16i = experience, x17i = primary occupation, θ= correlation coefficient.
To quantify the impact of explanatory variables on the dependent variable, regression analysis was used. Moreover, to see the goodness of fit of the regression line, coefficient of determination (R2) is estimated, whereas the t-test was applied to verify the statistical significance of the regression coefficients. The empirical results are reported in Table 6 elucidated that all independent variables are statistically significant as per ‘t’ values except labor, distance to market, mass media exposure, and market information. It indicates that the majority of explanatory variables have contributed considerably to the adoption of improved poultry practices and technology in poultry farming.
|
AR |
NAR |
|||
|
Exploratory Variables |
αi |
‘’t-Statistic |
αi |
‘t’ Statistic |
|
x1 |
.164 |
2.070 |
-.170 |
2.220 |
|
x2 |
.057 |
2.660 |
-.044 |
3.410 |
|
x3 |
.331 |
3.362 |
-.101 |
3.150 |
|
x4 |
-.024 |
2.010 |
-.071 |
2.070 |
|
x5 |
-.063 |
2.140 |
.259 |
2.660 |
|
x6 |
-.088 |
2.070 |
.142 |
3.362 |
|
x7 |
.344 |
4.115 |
.014 |
2.010 |
|
x8 |
-.113 |
2.183* |
.087 |
2.140 |
|
x9 |
-.095 |
2.662 |
-.150 |
3.420 |
|
x10 |
-.033 |
1.874 |
.236 |
2.290 |
|
x11 |
.003 |
4.115 |
.012 |
4.115 |
|
x12 |
.027 |
2.183 |
.392 |
2.183* |
|
x13 |
.331 |
2.973 |
-.063 |
2.662 |
|
x14 |
-.024 |
3.233 |
-.088 |
1.874 |
|
x15 |
-.063 |
3.662 |
.344 |
3.811 |
|
x16 |
.087 |
3.845 |
-.113 |
2.276 |
|
x17 |
-.150 |
2.419 |
-.233 |
5.071 |
|
R2 |
0.532 |
0.678 |
||
AR: adopted Respondents; NAR: Non-Adopted Respondents; αi: Co-efficient of the estimated regression line.
The results reported in Table 6 also exhibited that the variables: age, literacy, education level, labor, the quantity of feed, poultry management skills, credit facility, vaccination, income, training, other sources of income, marketability issues, distance to market, market information, experience, primary occupation, and mass media exposure were positively linked to the adoption of improved poultry practices. This suggests that these variables have an increasing contribution to the adoption of improved practices for poultry in the area under study. The values of R2 are 0.532 and 0.678, which indicated that the independent variables almost explained the dependent variable by 53.20% and 67.80% respectively.
Conclusions and Recommendations
This study offers an investigation of the key factors responsible for the adoption of improved poultry practices and technology. In this context, socioeconomic determinants are investigated with the regression model, which was applied to the data collected through well-constructed questionnaires in the district. The model not only allows the existence of a category of adopters but also permits to classify the characteristics of the farmers which are helpful in the adoption of improved poultry practices and technology. However, all the explanatory variables are stimulating factors that make clear differences in the adaptation of improved poultry practices and technology in the poultry apart from the age, labor, marketability issues, distance to market, market information, and experience. Moreover, expansion and development in financial institutions, such as the introduction of rural banking will be an appropriate measure to promote not only access to livestock technologies at reasonable terms but also to the rural economy and livelihood of the people.
Novelty Statement
The study has underlined first time the crucial determinants of adoption of improved poultry practices and technology in the poultry industry of district Lasbela, Balochistan
Acknowledgments
Authors acknowledge the support from Professor Dr. Guo Xiangyu, College of Economics and Management, Northeast Agricultural University, Harbin, Heilongjiang 150030, China.
Author’s Contribution
Khalid Khan: Organized the 1st draft.
Ahmed Farhan Saeed: Planned, supervised, supported the research and collected data.
Sanam Wagma Khattak: Guided and reviewed the manuscript.
Saima Liaqat: Helped in data collection, estimation and generation of the tables.
Conflict of interest
The authors have declared no conflict of interest.
References
Chen, L., Jiang, T. and Li, X. 2016. Immunomodulatory activity of β-glucan and mannan-oligosaccharides from Saccharomyces cerevisiae on broiler chickens challenged with feedborne Aspergillus fumigatus. Pak. Vet. J., 36: 297-301.
Foster, A.D. and Rosenzweig, M.R. 2010. Microeconomics of technology adoption. economics growth centre. Discussion paper series, Yale University. https://doi.org/10.1146/annurev.economics.102308.124433
Jack, B. Kelsey. 2013. Constraints on the adoption of agricultural technologies in developing countries.” Literature review, agricultural technology adoption initiative, J-PAL (MIT) and CEGA (UC Berkeley).
Khan, K., Kamal, M.A., Ramazan, S., Khan, G., Ali, G. and Ahmed, S. 2018. Impact of agricultural credit on livestock income: A case study of district Lasbela, Balochistan. Sarhad J. Agric., 34(2): 246-250. https://doi.org/10.17582/journal.sja/2018/34.2.246.250
Bunnika, P., Khan, K. and Xiangyu, G. 2019. An empirical analysis of battambang agricultural cooperatives efficiency in Cambodia. Sarhad J. Agric., 35(4): 1094-1098. https://doi.org/10.17582/journal.sja/2019/35.4.1094.1098
Kumar, A., Steven, S. Elumalai, K. and Singh, D.K. 2007. Livestock Sector in North- Eastern Region of India: An Appraisal of Performance. Agric. Econ. Res. Rev., 20: 255-272.
Macours, K., 2014. Adoption and adaptation in developing country agriculture. Rev. Agric. Environ. Stud., 95: 13-24.
Maqbool, A. 2002. Marketing of commercial poultry, poultry meat and eggs in Faisalabad City. MSc Thesis Univ. Agri. Faisalabad, Pakistan.
Maqbool, A., K. Bakhsh, I. Hassan, M.W.A. Chattha and S.A. Ahmad, 2005. Marketing of commercial poultry in Faisalabad City Pakistan. J. Agric. Soc. Sci., 1: 327-331.
Naved. R.T. 2006. Intrahousehold impact of transfer of modern agricultural technology: A gender perspective. International Food Policy Research Institute (IFPRI), Discussion paper 85.
Rahman, S. 2007. Adoption of improved technologies by the pig farmers of Aizawl district of Mizoram, India. Livestock Res. Rural Dev., 19(1): 1-5.
Singh. K.M., Sindgh. R.P. and Kumar. A., 2013. A socio-economic study on adoption of modern agriculture technologies in Bihar, India. Munich Personal RePEc Archive. Paper No. 52032. http://mpra.ub.uni-muenchen.de/52032/
Teklewold, H., Dadi, L., Yami, A. and Dana, N. 2006. Determinants of adoption of poultry technology: a double-hurdle approach. Livestock Res. Rural Dev., 18(3): 1-14.
To share on other social networks, click on any share button. What are these?


