

A Comparative Study for Egg Production in Layers by Decision Tree Analysis


A Comparative Study for Egg Production in Layers by Decision Tree Analysis
Yakut Gevrekçi* and Çiğdem Takma
Department of Animal Science, Faculty of Agriculture, Ege University, 35100 Bornova, İzmir, Turkey
ABSTRACT
Decision tree analysis is one of the data mining approaches which generate model asses the response variable based on the predictor variables. The present study deals with evaluating relationship between egg production (EP) and some related traits by decision tree analysis with Classification and Regression Tree (CART) and Chi-squared Automatic Interaction Detection (CHAID) algorithms. A total of 1912 EP records of layers which hatched at four different periods were collected from a commercial flock in west of Turkey. The analysis performed with cathegorical (cage and line) and continuous (hatch, age at sexual maturity and body weight of sexual maturity) predictors and a continuous response variable (EP). The Spearman’s rho correlation coefficients among all predictor variables were significantly changed from 0.88 to -0.65. Age of sexual maturity was found the most predictor variable that affecting EP and it was followed by hatching period. Lower values for goodness of fit criteria were obtained by CHAID algorithm, indicating that this algorithm fits better. Regression tree analysis displayed visual information about the relations among predictor variables. As a result, decision tree analysis is necessary to provide preliminary information in breeding programs to be performed.
Article Information
Received 19 June 2017
Revised 13 August 2017
Accepted 03 October 2017
Available online 25 January 2018
Authors’ Contribution
YG and ÇT planned and conducted the study, analyzed and interpreted the data and wrote the article.
Key words
CART, CHAID, Regression tree, Data Mining, Egg production.
DOI: http://dx.doi.org/10.17582/journal.pjz/2018.50.2.437.444
* Corresponding author: yakut.gevrekci@ege.edu.tr
0030-9923/2018/0002-0437 $ 9.00/0
Copyright 2018 Zoological Society of Pakistan
Introduction
In poultry breeding, lower body weight and earlier sexaul maturity age was targeted for improvement in flock productivity by selection programs (Liu et al., 1994, 1995; Romero et al., 2009). Breeders are trying to obtain the optimum yielding animals by improving the genetic selections on layers. The age at sexual maturity of layers (ASM) can be taken earlier with application of the various lighting programs and selection methods. However, it is not desirable that this period is being too early or too late. Because early period leads to very small eggs, lately period causes to increasing unnecessary expenditures (Savas et al., 1997). There is a high correlation between the amount of eggs obtained in the first weeks on laying and the age of sexual maturity. When the breeders prefer getting more eggs from layers at the beginning of the laying period, they have also indirectly selected individuals who reach early sexual maturity (Tijen, 1982). On the other hand, egg production is directly affected by factors such as age, temperature, lighting, nutrition, disease and genetic structure (Unver, 2000). Various selection methods are used to increase the egg production. However, determination of the environmental factors, affecting egg production and the modeling of their impact levels by data mining techniques is quite new and there is not enough research.
Data mining used to find the links among measurements by examining the related relationships within a very large amount of data. Moreover, it allows extracting information that hidden in database systems (Kalikov, 2006). In data mining, decision tree method has widespread use in many scientific areas, such as agriculture, engineering and industry. This technique can be divided into CHAID (Chi-Squared Automatic Interaction Detection), CART (Classification and Regression Trees), QUEST (Quick Unbiased Efficient Statistical Tree) and Exhaustive CHAID algorithms. Such algorithms vary according to the categorical or continuous nature of the response (dependent) / predictor (independent) variables and the approach they use in classifying these variables.
There are several researches (Mendes and Akkartal, 2009; Uckardes et al., 2014; Orhan et al., 2016; Celik et al., 2016; Duru et al., 2017) applied decision tree method on poultry experiments. Uckardes et al. (2014) determined the cage stocking density, genotype and season effects on fertility in Japanese quail by CART method. They found significant difference depends on genotype and stocking density in two seasons. Heat stress with high temperatures in summer caused negative effects on fertility. Orhan et al. (2016) predicted egg weight based on shell weight, albumen weight, and yolk weight by ridge regression, multiple linear regression, and decision tree analysis with CHAID algorithm. Decision tree analysis, which had very great accuracy for the prediction of egg weight, advised in comparison with the ridge regression and multiple linear regression analysis techniques. Celik et al. (2016) evaluated the egg quality characteristics effects on fertility of Japanese quail eggs with different colored feathers (white, yellow, normal and grizzled). The CART results showed that fertility ratio was the highest 90.9%, obtained for white, grizzled and normal feather colors with 24.565 mm ≥ egg width, 10.425 g ≥ egg weight or the fertility ratio was 88.2%, observed with 25.605 mm ≥ egg width and 10.425 g ≤ egg weight. Duru et al. (2017), handled a research to determine the effect of dried carrot leaf powder at different amounts on some external and internal egg characteristics of Hy-line white laying hens and to predict each of egg internal characteristics from egg external characteristics through regression tree analysis by CHAID algoritm. This analysis gave better relationship between egg quality characteristics, which has the great importance for higher price and more income of fertile and table eggs. Mendes and Akkartal (2009) reported effective variables of slaughter weight of the Ross 308 broilers by CART analysis. The analysis illustrated that the birds in the second week body weight >295.95 g, breast circumference >14.18 cm, breast bone length >55.82 mm or that of body weight ≤295.95 g, shank width >8.32 mm and breast bone length >60.26 mm would have higher slaughter weights.
In this study, decision tree analysis has examined for the existence of relationships among cage, line, ASM, body weight at sexual maturity (BWSM) on egg production. This method was investigated using CHAID and CART algorithms and both algorithms compared based on their accuracy.
Materials and methods
Data
In the present study, egg production data obtained from commercial breeding company in Turkey. Layers were kept individually in two-sided battery cages with three tiers in an environmentally controlled chicken house and they were artificially inseminated. After mating, dams which have less than 2 chicks were omitted. Finally, in total 1912 layers were used from 43 sires and 8 dams per sire over 6 generations. Records were collected daily and individually at four different hatching period. The data were collected at the 22nd–40th week of age known early part of record. The egg production was used in the analysis as a response variable and cage, line, hatch, ASM and BWSM that affected by management factors, such as humidity, lighting, temparature and ventilation were taken as predictor variables.
Methods
Data Mining is the computing process of extracting useful and important information from large data sets (Ramesh and Vardhan, 2013). Clustering, classification, summarization, prediction, data reduction and sequential analysis can be used to determine such information (Biggs et al., 1991; Uckardes et al., 2014). Decision trees are machine learning methods that are used to generate prediction models on data. This modeling is a nonparametric approach, which can explain the response variable among continuous or categorical predictor variables. Therefore it does not require normality, homogeneity and linearity assumptions (Breiman et al., 1984; Eyduran et al., 2013, 2016). The objective of decision tree analysis is to derive a structure, according to independent variable, which produces homogenous nodes (groups) (Larsen and Speckman, 2004). The data in each subgroup has a slightly more homogeneous structure than data from the previous one. The method presents these homogeneous subgroups as lower branches of a tree in the same tree node. Response variable splits into left and right child nodes derived from the root (initial) node. The root node is the most heterogeneous one and following nodes are known as parent nodes. Then these nodes split to child nodes. When the split is terminated, child nodes are named as terminal nodes (Topal et al., 2010). The child nodes are more homogenous than the root node and the most homogenous one is the terminal node (Çamdeviren et al., 2007).
In the decision tree method, the homogenization procedure at each node is solved as follows:
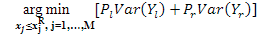
Where, Pl and Pr are probabilities of left and right nodes. M is variable number in training set. xj and xjR are variables and the the best distinctive value. Var(Yl),Var(Yr) are vectors of responsible for reciprocal right and left nodes are optimal discrimination inquiry. Decision tree algorithms are applied for response and predictor variables in order to obtain homogenous subgroups depending upon sample size, nonlinear and the interaction effects of the predictor variables (Ali et al., 2015). CART algorithm constructs a binary decision tree by partitioning a node into two new child nodes, whereas CHAID algorithms have merging, splitting, and stopping stages to form a decision tree consisting of multiple splits (Celik and Yilmaz, 2017). Bonferroni adjustment was used to merge subgroups by estimated adjusted P values with 0.05 error rates (Chan et al., 2006).
CHAID analysis was developed as a method which determines the combinations or interactions among the variables. This algorithm only needs categorical predictors. The predictors which have continuous structure are transformed into categorical scale by CHAID algorithm. Also, if predictor variables have more than two categories, it will create multiple splits. CHAID algorithm uses chi-square test for the categorical response variables (Agresti, 1990), while it uses F test for continuous one (Orhan et al., 2016).
CART is a method, known as binary recursive partitioning was firstly proposed by Breiman et al. (1984). The predictor variables were split along coordinate axes; the split is selected that maximally differences the response variable in the left and the right branches. If the response variable is categorical, the tree is called a “classification tree”; if it is continuous, called a “regression tree”. In the CART algorithm, variables can be both categorical and continuous (Jarošík, 2011). For categorical response variables, Gini, Twoing or Ordinal Twoing can be used. For continuous response variable, either Least-Squared Deviation (LSD) or Least Absolute Deviation (LAD) can be chosen (Alkhasawneh et al., 2014).
On the contrary to CHAID, the CART uses pruning to remove the unreliable branches to improve the accuracy (Yadav et al., 2011).
In this study, egg production, cage, hatch, line, ASM and BWSM were utilized to develop the decision tree models via CHAID and CART algorithms. Ten-fold cross validation was used and the maximum tree value was obtained after the tree reached a maximum dimension. Also risk value (Rk), as model fitness criterion, and explains the variance in the nodes was computed as below:
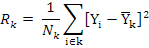
Where, Nk is the number of observation in node k, Yi is the value of the response variable, and Yk is the mean of node k.
The unexplained variation of egg production (S2e) and explained variances (S2y) can be calculated as (Yakubu, 2012):
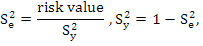
Predictive ability for models was compared by Coefficient of Variation (CV), Relative Approximation Error (RAE), Mean Absolute Deviation (MAD) and Root Mean Square Error (RMSE) given as according to the following equations (Grzesiak and Zaborski, 2012):
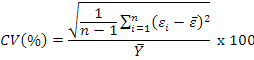
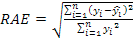
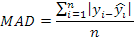
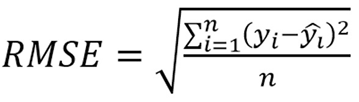
In the formulas n is the number of production, p is independent variables, yi is observation, Ŷi is predicted values; Ῡ is mean of the actual EP values, εi is the residual of ith layer associated with EP and ε̅ is mean of the mean of the residual values associated with EP.
The best algorithm should give the lowest goodness of fit value for CV, RAE, MAD and RMSE. All statistical analysis was performed using IBM SPSS version 20 (SPSS, 2011).
Results and discussion
Descriptive statistics for the predictor and response variables were presented in Table I.
Table I.- Descriptive statistics for the response and predictor variables (n=1912).
|
Categorical variable |
Frequency |
Percent |
|
| Line |
|
|
|
| 1 |
149 |
9.1 |
|
| 2 |
143 |
8.8 |
|
| 3 |
143 |
8.8 |
|
| 4 |
147 |
9.0 |
|
| 5 |
154 |
9.4 |
|
| 6 |
150 |
9.2 |
|
| 7 |
153 |
9.4 |
|
| 8 |
138 |
8.5 |
|
| 9 |
134 |
8.2 |
|
| 10 |
142 |
8.7 |
|
| 11 |
66 |
4.0 |
|
| 12 |
100 |
6.1 |
|
| 13 |
11 |
0.7 |
|
| Hatch |
|
|
|
| 1 |
888 |
54.5 |
|
| 2 |
633 |
38.8 |
|
| 3 |
99 |
6.1 |
|
| 4 |
10 |
0.6 |
|
|
Continuous variable |
Mean ± Std. Error |
Std. Deviation |
C.V (%) |
| EP |
107.73±0.22 |
8.96 |
8.32 |
| Cage |
1996.71±14.05 |
567.23 |
28.41 |
| ASM |
147.28±0.29 |
11.67 |
7.92 |
| BWSM |
1636.71±4.35 |
175.43 |
10.72 |
EP, egg production; ASM, age of sexual maturity; BWSM, body weight of sexual maturity.
Table II.- Phenotypic Spearman’s rho correlation coefficients*.
|
Hatch |
ASM |
BWSM |
EP |
|
| Line |
0.88 |
-0.43 |
0.26 |
-0.24 |
| Hatch |
|
-0.51 |
0.30 |
-0.27 |
| ASM |
|
|
-0.65 |
-0.13 |
| BWSM |
|
|
|
0.12 |
*Significant at P<0.01 for all correlation coefficients. EP, egg production; ASM, age of sexual maturity; BWSM, body weight of sexual maturity.
The Phenotypic Spearman’s rho correlation coefficients were calculated to determine the relationships between egg production and related traits (Table II). The predictor variables were significantly correlated from 0.88 to -0.65; P<0.01. Furthermore, line-hatch was higly positive (0.88) and ASM-BWSM was higly negative correlated (-0.65). The correlation coefficients between EP with line, hatch, ASM and BWSM were found to be -0.24, -0.27, -0.13 and 0.12, respectively. The positive relationship between EP and BWSM means that heavier laying and more eggs. Similar negative values of correlation coefficients between ASM and EP were obtained by Aly et al. (2010) and Shalan et al. (2012), whereas, Ayorinde (1994) reported positive correlation between them.
Table III.- The importance scores of predictor variables.
| Predictor variables |
Importance |
Normalized importance |
| Hatch |
11.03 |
100.0% |
| Line |
11.03 |
99.9% |
| ASM |
7.34 |
66.5% |
| BWSM |
2.01 |
18.2% |
ASM, age of sexual maturity; BWSM, body weight of sexual maturity.
However, these coefficients were not sufficient to explain the relationships and the order of significance between the related traits. The contribution of each predictor variable in the classification of the response variable were determined with importance scores that received by CART analysis. The scores of predictor variables are scaled (range, 0–100) relative to the response variable (Brieman et al., 1984; Steinberg and Colla, 1997). The importance scores of each predictor variable in this present study were evaluated in Table III. The hatching period was found as the most important predictor variable (100%) affecting EP, followed by line (99.9%), ASM (66.5%) and BWSM (18.2%). Finally, among these traits hatching, line and ASM were included into the regression tree model to predict EP (Table III).
The optimal tree diagrams that show classification and prediction of egg production, obtained from CART and CHAID algorithms were illustrated in Figures 1 and 2, respectively. The tree diagrams consisted of boxes and each box represents a segment that is significantly different than the other segments in each row. Number and percentage of layers, mean and standard deviation of egg production were given within each box.
Egg production as a root node (Node 0) was at the top of the Figure 1. The other nodes (Nodes 1-6) were called as child nodes. As previously given in Table II, the mean and standard deviation of root node for EP was found 107.73±8.96. In the root node, layers were divided into two nodes based on ASM: Node 1 (≤158.5 day, n=1331) and Node 2 (>158.5 day, n=299). The average EP in Node 1 and Node 2 were predicted as 108.88±9.06 and 102.61±6.40, respectively. Node 1 was split again into hatch variable Node 3 (hatch 1, n=610) and Node 4 (hatch 2, 3 and 4, n=721). The mean and standard deviation of EP for Node 3 was 112.88±7.27 and Node 4 was 105.50±9.04. On the other hand, Node 2 was split again into ASM as Node 5 (≤166.5 d ay, n=229) and Node 6 (>166.5 day, n=70) with 103.63±6.43 and 99.
26±4.98, respectively. Nodes 3-6 were not divided into child nodes, they could be said to be homogenous and called as terminal nodes. Moreover, the terminal Node 3 has the highest average EP among the other terminal nodes (Fig. 1). The average EP of ≤158.5 day old layer was nearly similar with >158.5 day old layer. But it was decreased at >166.5 day. The highest average EP was acquired at ≤158.5 day in the first hatching period.
In our study, the first partition of all the data in the tree was based on the root node as ASM via CART analysis. There hasn’t any research that investigates the ASM effect on EP and not compatible with those found by this study. Likewise, the variance of the root node was estimated as 80.28 (8.962) for CART algoritm. Also, the risk value (Rk) of EP was found 62.74. The unexplained variation of EP was obtained as 78% and the explained variance in the EP was determined as 22%. The higher risk value and higher unexplained variation contrary to lower explained variation mean that more predictive variables should be found for the explanation of the variance of EP. The CART scheme also supports these results. Since the CART scheme reflects that only the ASM and hatching periods statistically significant on estimation of EP.
There is no former study similar with our study, there are some other studies with different predictor and response variables in layers (Narushin and Romanov, 2002; Türkyılmaz et al., 2005; Eyduran et al., 2008; Castilla et al., 2009; Karabag et al. 2010; Orhan et al., 2016).
Figure 2 shows the predictor variables affecting EP in layers by CHAID algorithm. It is evident that primarily affecting predictor variable was ASM. The ASM was split into subgroups: Node 1 (≤136 day, n=314), Node 2 (136-144 day, n=317), Node 3 (144-147 day, n=175), Node 4 (147-157 day, n=494), Node 5 (157-163 day, n=172) and Node 6 (>163 day, n=158). From within these subgroups there was significant difference in cluster membership between layers that at different hatching periods. Therefore hatching was the secondly important variable in this hierarchy. Additionally, Node 1 was further subdivided into two child nodes (Node 7 and Node 8). Node 7 consists of the second, the third and the fourth hatching periods likewise, Node 8 includes the first one. Node 2 was subdivided into the three groups (Node 9-11). The Node 3 and 4 were split into two same hatching periods. The highest average EP was acquired from the 136-144 day old layer hatching at the first and the fourth period (Fig. 2).
As can be seen in Figures 1 and 2, ASM was the most predictor variable that affecting EP and it was followed by hatching period in both algorithms. Moreover, average EP at the first hatching period was found the highest in Figure 1 same as in Figure 2. Taking into consideration previous studies (Mendeş and Akkartal, 2009; Uckardes et al., 2014) concerning regression tree based on CHAID algorithm can be an admirable tool in the classification of eggs, existing in egg quality criteria instead of traditional and alternative regression methods (Orhan et al., 2016; Koc et al., 2017). In this study it was determined that EP yields of layers with younger than 158.5 day old and in the first and fourth hatching periods were found higher than average EP. Therefore early selection can be successful in layers which members of these subgroups.
Table IV.- Performance quality criteria results for CART and CHAID.
| Model | CV (%) | RAE | MAD | RMSE |
| CART | 10.57 | 0.0024 | 8.85 | 11.25 |
| CHAID | 9.32 | 0.0021 | 7.56 | 9.93 |
CV, coefficient of variation; RAE, relative approximation error; MAD, mean absolute deviation; RMSE, root mean square error.
Comparison of algorithms based on CV, RAE, MAD and RMSE criteria were illustrated in Table IV. The results indicated that the CHAID have lower criteria solutions, means that CHAID more accurate than CART algoritm. Similiar results for performance of CHAID and CART were reported by Khan et al. (2014) and Ali et al. (2015).
Conclusion
Regression tree is a technique that repeatedly partitioning the population into different subgroups where the variation of response variable is minimum within and maximum between the subgroups. The aim of regression tree algorithm is to balance predictive accuracy and complexity with interpretion of model. It has also an advantage of easy interpretation for both response and predictor varibles with visual diagrams. Due to nonparametric properties of regression tree, it does not require any parametric assumptions. Furthermore, regression tree models provide the most accurate estimates for relationships among traits. When compared with traditional methods, it also considers the importance ranks of traits. Therefore, it becomes preferred method instead of other commercial approaches.
Besides its advantages mentioned above, this method is important for animal breeding too. Recently, regression tree algorithm has been using in animal science, but it is rare in poultry science. Even though, there is not any regression tree study on predicting EP. In this study, the regression tree algorithm was used for predicting EP by several related traits in layers, because of its priority on poultry industry.This research will lead to further projects in the future, also it will be useful to get early information in selection programs.. It is suggested that the regression tree analysis should be used in poultry studies..
Statement of conflict of interest
Authors have declared no conflict of interest.
References
Agresti, A., 1990. Categorical data analysis. John Wiley & Sons, New York.
Ali, M., Eyduran, E., Tariq, M. M., Tirink, C., Abbas, F., Bajwa, M.A., Baloch, M.H., Nizamani, A.H., Waheed, A., Awan, M.A., Shah, S.H., Ahmad, Z. and Jan, S., 2015. Comparison of artificial neural network and decision tree algorithms used for predicting live weight at post weaning period from some biometrical characteristics in Harnai sheep. Pakistan J. Zool., 47: 1 Fig. 2. The decision tree diagram obtained by CHAID. 579-1585.
Alkhasawneh, M.S., Ngah, U.K., Tay, L.T. Isa, N.A.M. and Al-Batah, M.S., 2014. Modeling and testing landslide hazard using decision tree. J. appl. Meth., 2: 1-9.
Aly, O.M., Hanan, H.G., Yousria, K.A., Nazla, Y.A. and Magda, M.B., 2010. Selection for improving egg production in Mandarah chickens. 4- Direct and correlated response for some economic traits for four generations of selection. Egypt. Poult. Sci., 30: 137-156.
Ayorinde, K.L., 1994. Evaluation of the growth and carcass characteristics of the Japanese quail. Nig. J. Anim. Prod., 21: 119-126.
Biggs, D., de Ville, B. and Suen, E., 1991. A method of choosing multiway partitions for classification and decision trees. J. appl. Stat., 18: 49-62. https://doi.org/10.1080/02664769100000005
Breiman, L., Friedman J., Olshen R. and Stone C.J., 1984. Classification and regression trees. Chapman and Hall, Wadsworth Inc., New York, NY, USA.
Camdeviren, H., Yazici, A.C., Akkus, Z., Bugdayci, I. and Sungur, M.A., 2007. Comparison of logistic regression model and classification tree: An application to postpartum depression data. Expert Syst. Applic., 32: 987-994. https://doi.org/10.1016/j.eswa.2006.02.022
Castilla, A.M., de Aragon, J.M., Herrel, A. and Moller, S., 2009. Eggshell thickness variation in red-legged partridge (Alectoris rufa) from Spain. Wilson J. Ornit., 121: 167-170. https://doi.org/10.1676/08-024.1
Celik, S., Sogut, B., Sengul, T., Eyduran, E. and Sengul, A.Y., 2016. Usability of CART algorithm for determining egg quality characteristics influencing fertility in the eggs of Japanese quail. R. Bras. Zootec, 45: 645-649. https://doi.org/10.1590/s1806-92902016001100001
Celik, S. and Yilmaz, O., 2017. Comparison of different data mining algorithms for prediction of body weight from several morphological measurements in dogs. J. Anim. Pl. Sci., 27: 57-64.
Chan, F., Cheing, G., Chung Chan, J.Y., Rosenthal, D.A. amd Chronister, J., 2006. Predicting employment outcomes of rehabilitation clients with orthopedic disabilities: A CHAID analysis. Disabil. Rehabil., 28: 257-270. https://doi.org/10.1080/09638280500158307
Duru, M., Duru, A.A., Karadaş, K., Eyduran E., Cinli, H. and Tariq M.M., 2017. Effect of carrot (Daucus carota) leaf powder on external and internal egg characteristics of Hy-Line White Llying Hhns. Pakistan J. Zool., 49: 125-132. https://doi.org/10.17582/journal.pjz/2017.49.1.125.132
Eyduran, E., Karakus, K., Keskin, K. and Cengiz, F., 2008. Determination of factors influencing birth weight using regression tree (RT) method. J. appl. Anim. Res., 34: 109-112. https://doi.org/10.1080/09712119.2008.9706952
Eyduran, E., Yilmaz, I., Tariq, M.M. and Kaygisiz, A., 2013. Estimation of 305-d milk yield using regression tree method in Brown Swiss cattle. J. Anim. Pl. Sci., 23:731-735.
Eyduran, E., Keskin, İ., Erturk, Y.E., Dag, B., Tatliyer, A., Tirink, C., Aksahan, R. and Tariq, M.M., 2016. Prediction of fleece weight from wool characteristics of sheep using regression tree method (CHAID algorithm). Pakistan J. Zool., 48: 957-960.
IBM SPSS, 2011. Statistics for windows, Version 20.0. IBM Corp., Armonk, NY.
Grzesiak, W. and Zaborski, D., 2012. Examples of the use of data mining methods in animal breeding. (Book) ISBN 978-953-51-0720-0. https://doi.org/10.5772/50893
Jarošík, V., 2011. CART and related methods. In: Encyclopaedia of biological invasions (eds. D. Simberloff and M. Rejmánek). University of California Press, Berkeley and Los Angeles, pp. 104-108.
Kalikov, A., 2006. Veri madenciligi ve bir e-ticaret uygulaması. Yuksek Lisans Tezi, Gazi Universitesi, Fen Bilimleri Enstitüsü.
Karabag, K., Alkan, S. and Mendes, M., 2010. Classification tree method for determining factors that affecting hatchability in Chukar partridge (Alectoris chukar) eggs. Kafkas Univ. J. Vet. Facul., 16: 723-727.
Khan, M.A., Tariq, M.M., Eyduran, E., Tatliyer, A., Rafeeq, M., Abbas, F., Rashid, N., Awan, M. A. and Javed, K., 2014. Estimating body weight from several body measurements in Harnai sheep without multicollinearity problem. J. Anim. Pl. Sci., 24: 120-126.
Koc, Y., Eyduran, E. and Akbulut, O., 2017. Application of regression tree method for different data from animal science. Pakistan J. Zool., 49: 599-607. https://doi.org/10.17582/journal.pjz/2017.49.2.599.607
Larsen, D.R. and Speckman, P.L., 2004. Multivariate regression trees for analysis of abundance data. Biometrics, 60: 543-549. https://doi.org/10.1111/j.0006-341X.2004.00202.x
Liu, G., Dunnington, E.A. and Siegel, P.B., 1994. Responses to long-term selection for eight-week body weight in chickens. Poult. Sci., 73: 1642-1650. https://doi.org/10.3382/ps.0731345
Liu, G., Dunnington, E.A. and Siegel, P.B., 1995. Correlated responses to longterm divergent selections for eight-week body weight in chickens. Growth, sexual maturity and egg production. Poult. Sci., 74: 1259-1268. https://doi.org/10.3382/ps.0741259
Mendes, M. and Akkartal, E., 2009. Regression tree analysis for predicting slaughter weight in broilers. Ital. J. Anim. Sci., 8: 615-624. https://doi.org/10.4081/ijas.2009.615
Narushin, V.G. and Romanov, M.N., 2002. Egg physical characteristics and hatchability. World’s Poult. Sci. J., 58: 297-303. https://doi.org/10.1079/WPS20020023
Orhan, H., Eyduran, E., Tatliyer, A. and Saygici, H., 2016. Prediction of egg weight from egg quality characteristics via ridge regression and regression tree methods. Rev. Brasil. Zootec., 45: 380-385. https://doi.org/10.1590/S1806-92902016000700004
Ramesh, D. and Vardhan, B.V., 2013. Data mining techniques and applications to agricultural yield data. Int. J. Adv. Res. Comput. Commun. Engin., 2: 3477-3480.
Romero, L.F., Zuidhof, M. J., Renema, R.A., Naeima, A. and Robinson, F., 2009. Effect of reducing body weight variability on the sexual maturation and reproductive performance of broiler breeder females. Poult. Sci., 88: 445-452. https://doi.org/10.3382/ps.2008-00165
Savas, T., Preisinger, R., Röhe, R. and Kalm, E., 1997. Possibilities of utilizing partial yields in improving egg production continuity. YUTAV, International Poultry Fair and Conference, May,1997, İstanbul.
Shalan, M.H., Zweil, H.S, El-Wekeel, H. and Abdella, M.M., 2012. Selection and correlated response for age at sexual maturity in Baheij strain. Egypt. Poult. Sci., 32: 339- 350.
Steinberg, D. and Colla, P., 1997. CART–classification and regression trees. Salford Systems, San Diego, California.
Tijen, W.F., 1982. Applied poultry breeding in the egg sector. International Scientific Poultry Congress, Ankara, pp. 53-71.
Topal, M., Aksakal, V., Bayram, B. and Yaganoglu, A.M., 2010. An analysis of factors affecting birth weight and actual milk yield in Swedish red cattle using regression tree analysis. J. Anim. Pl. Sci., 20: 63-69.
Turkyılmaz, M.K. Dereli, E. and Sahin, T., 2005. Effects of shell thickness, shell porosity, shape index and egg weight loss on hatchability in Japanese quail (Coturnix coturnix japonica). Kafkas Univ. Vet. Fak. Derg., 11: 147-150.
Uckardes, F., Narinc, D., Kuçukonder, H. and Rathert, H.C., 2014. Application of classification tree method to determine factors affecting fertility in Japanese quail eggs. J. Anim. Sci. Adv., 4: 1017-1023. https://doi.org/10.5455/jasa.20140827111606
Unver, Y., 2000. Parameter estımations of partial egg production records in layers. Ege Univ. Graduate School of Natural and App. Sci., Master of Thesis.
Yadav, S.K., Bharadwaj, B.K. and Pal, S., 2011. Data Mining Applications: A comparative study for predecting students’ performance, Int. J. Inn. Tech. Creat. Engg., 1: 13-19.
Yakubu, A., 2012. Aplication of regresyon tree methodology in predicting the body weight of uda sheep. Scientific papers. Anim. Sci. Biotech., 45: 484-490.
To share on other social networks, click on any share button. What are these?


