

Comparative Analysis of Hematological Parameters of some Farmed and Wild Fish Species


Comparative Analysis of Hematological Parameters of some Farmed and Wild Fish Species
Syed Sikandar Habib1*, Saira Naz2, Sadia Nawaz1, Iqra Ameer1, Ameer Khatoon1, Hameed Ur Rehman3, Sahibzada Muhammad Jawad4 and Haider Ali5
1Department of Zoology, University of Sargodha, Sargodha
2Institute of Molecular Biology and Biotechnology, University of Lahore, Sargodha Campus
3Department of Zoology, Kohat University of Science and Technology, Kohat-26000 4Department of Zoology, Islamia College University, Peshawar
5Department of Chemical and Life Sciences, Qurtuba University of Science and Technology, Peshawar
ABSTRACT
The complete blood count is powerful tool for the aquaculturist to monitor quality of water, related soil and to ensure the health status in response to feed, disease therapy and confirming the maturity. So the present study was designed to determine the hematological parameters of farm and river Chenab (wild) selected fish species including (Labeo rohita, Cirrhinus mrigala, Cyprinus carpio, Hypophthalmichthys molitrix, Ctenopharyngodon idella). Fish species selected for the current study is generally widely cultured in Pakistan and worldwide. Fish sampling was done by using different nets (river and farm) and blood sampling was immediately drawn from caudal peduncle by syringe and added in EDTA containing vial and shake well for proper mixing. Vials stored in ice containing boxes and carried to laboratory for total complete blood count. The water parameter was analyzed in laboratory by taking the sample of water and some (Temperature, DO) was measured in situ. Results of hematological analysis revealed that there is no significant (P > 0.05) difference in packed cell volume, mean cell volume and mean cell hemoglobin of different selected species adapted to similar environmental conditions. However, all other parameters like red blood cells, hemoglobin, mean cell hemoglobin concentration, white blood cells, lymphocytes, mid-range cells, granulocytes and other less important parameters including platelets, red cell distribution width-standard deviation, red cell distribution width-coefficient of variation, platelet distribution width, mean platelet volume, Plateletcrit and Platelet-Large cell ratio are differed significantly (P<0.05). Similar trend was observed in fishes of both selected sites “Farm” and “River. It was concluded that hematological variance can occur between animals of different species and same species of different habitat, but as the water parameter remains the same across the studies so current studies don’t show any significant difference.
Article Information
Received 24 January 2020
Revised 23 May 2020
Accepted 23 June 2020
Available online 21 April 2021
(early access)
Published 07 January 2022
Authors’ Contribution
SSH and SN planned the research work and wrote the manuscript. SN and IA conducted the research work. AK and HUR collected the samples. SMJ and HA analyzed the data.
Key words
Wild fish, Farm fish, Hematological parameter, Aquaculture, Health status
DOI: https://dx.doi.org/10.17582/journal.pjz/20200124050118
* Corresponding author: Sikandarzoo00@yahoo.com
0030-9923/2022/0002-0591 $ 9.00/0
Copyright 2022 Zoological Society of Pakistan
INTRODUCTION
The hematological parameters can be utilized to monitor the health status of fish as a result of changes associated to diet, water quality, and disease in response to treatment. Since blood is sensitive connective tissue which can be easily affected by the environmental factors, that’s why fishes from different habitat have different blood profile (Fazio et al., 2020; Al-Asgah et al., 2015). Fish lives and totally depend on water, and unfortunately water can be largely contaminated with a wide range of pollutants such as bacterial contamination, oil pollution, contaminants organic and inorganic (Sahiti et al., 2018). Major source of pollution is using the pesticide which have many pathophysiological effects in numerous ways. Many of these pesticides are responsible for serious diseases like atherosclerosis, metabolic syndrome, pathogen invasion and vulnerability to infectious diseases. For example, fipronil the broad spectrum insecticide, seriously effects kidney, gills and even causes death (Lushchak et al., 2018; Fredianelli et al., 2019). The hematology profile of fishes is not only influenced by the pollution alone but may also due to change in feeding behavior and feed type (Parrino et al., 2018; Fazio et al., 2013). At the very beginning fish farmer cultured only native species of Pakistan such as catla (Catla catla), rohu (Labeo rohita), mrigal (Cirrhinus mrigala) and common carp (Cyprinus carpio). These fish species were mostly cultured due to market demand and inexpensive culturing procedure but after a certain time, two fast growing species, the grass carp (Ctenopharyngodon idellus) and silver carp (Hypophthalmichthys molitrix), have been introduced for culture under modern polyculture systems to upsurge the fish yield per unit area. These two species have good commercial values and gained popularity amongst the producers as well as consumers. Besides this two species of trout namely brown trout (Salmo trutta) and rainbow trout (Oncorhynchus mykiss) are also cultured in NWFP, AJK and NA (Laghari, 2018). The main objective of the current study was to determine and compare the hematological parameters of selected species of farm and river (wild).
MATERIALS AND METHODS
Study area specification
River Chenab (320 20’ 16 North, 0730 42’ 36 East) is one of the five major rivers in Punjab Pakistan. It has agri-forest land located adjacent to district Chiniot with diverse flora and fauna. It has moderate climate of having all four seasons with prolonged summer and the maximum temperature varies up to 45 °C (Altaf et al., 2011). Rajpoot fish farm are the public fish farm (Alaph 8 Chak Kotmomin in district Sargodha Punjab, Pakistan) which cover 200 Acers of area. They have semi-intensive aquaculture system. Rice powder and poultry feed was used as fish feed in farm and provided twice a day in morning and evening. Farm was fertilized with diammonium phosphate (DAP) and locally available, Kisan or Babar Sher fertilizer on weekly basis in order to enhance the phytoplankton’s production. Oxygen level was maintained by continues water flow through farm with the help of tube wells.
Fish and water sampling
Five species of fish Labeo rohita (rohu), Cirrhinus mrigala (mori), Cyprinus carpio (gulfam), Hypophthalmichthys molitrix (silver carp) and Ctenopharyngodon idella (grass carp) were selected. Water and fish samples were collected at 11:00 am PST in the month of September to December 2018. Thirty five fish from River Chenab and thirty five fish from a farm were collected with the help of local trained fishermen by using different type of nets including gill net, mesh nets etc. The fish were identified by using identification key (Mirza and Sandhu, 2007). To reduce the stress, fish was handled gently. All specimens were weighed with electric balance and total length was measured by using centimeter scale. Blood (2 ml) was collected from the caudal peduncle vein and transferred in EDTA (anticoagulant) containing vials for analysis of hematology (Shah et al., 2017).
Water samples were collected in sterile bottles for temperature measured with the help of mercury thermometer, dissolve oxygen measured through DO meter (Model: DO-5510), pH measured with the help of pH meter (Jenway model number 3510) and electrical conductivity (uS cm-1) was measured with the help of Conductivity meter (Taiwan, Model # PLC by MBC) (Envi R by 009). All samples were were further analysed in Pakistan Council of Research in Water Resources Water Quality Laboratory, Sargodha and Agriculture Department, Government of Punjab.
Water quality parameters
Hardness (mg/l), alkalinity (mg/l) and chloride (meq L-1) was measured by titrations done with EDTA, H2SO4 and AgNO3 respectively. Nitrate and nitrite (mg/l) was calculated by UV Spectrophotometer (Hitachi 19913-010) (Akbar et al., 2015). Calcium and magnesium (meq L-1) estimation was carried out by complexometric titration (EDTA). Sodium (meq L-1) was determined by flame photometer. Carbonates and bicarbonates (meq L-1) were estimated by titrimetric method. Titration was done with standardized HCl phenolphthalein and methyl orange used as indicator, respectively. Phosphate (mg/l) was determined by spectrophotometer. Chlorine (mg/l) was evaluated by low level amperometric titration method. Sodium adsorption ratio was determined by following equation (Khattak et al., 2012).

Residual sodium carbonate (meq L-1) was determined by following equation;
RSC=(CO3+HCO3)–(Ca+Mg).
Hematological parameters
Total erythrocyte and leukocyte count was done after diluting the blood samples with dilution solution which contains; sodium citrate 31.3 g, 10 ml volume of 37% formaline, Cresyl brilliant blue 1 g and 1000 ml purified water then analyzed the samples on Neubauer Hemo cytometer. Differential WBCs count was done by Giemsa staining technique (Baghizadeh and Khara, 2015). The amount of hemoglobin was evaluated by cyanmethemoglobin technique by using Drabkins reagent and packed cell volume was calculated by the method of capillary tube micro hematocrit (Mallesh et al., 2015). Erythrocyte indices were calculated by given formulas;
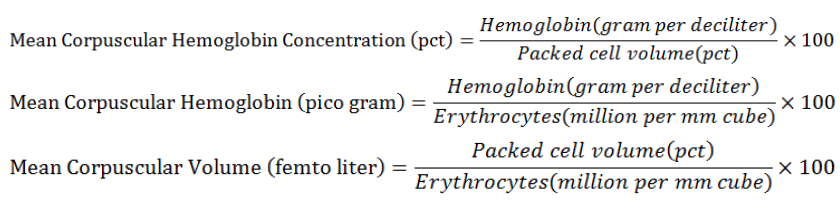
Few others essential blood parameters like Plt, Rdw-sd, Rdw-cv, PDW, MPV, Pct, and Plc-r were also determined (Ashraf et al., 2011).
Statistical analysis
The data obtained for the hematological analysis of wild/farmed fish species and water parameter for both sites were analyzed statistically by using R studio software (version 3.5.3) and applied ANOVA and LSD to determine the differences among the selected parameters of selected species. For water quality parameters the Standard deviation and Mean was determined of both sites.
RESULTS
Table I shows the weight and length of fishes used in this study. Table II shows water quality parameters of farm and river Chenab. The hematological parameters analysis of selected fish species from the farm and wild are given in the Table III and Figures 1 and 2.
Table I. Weight (g) and length (cm) of wild and farm fish used in this study.
|
Name of fish |
Wild fish |
Farm fish |
|
Weight |
||
|
Hypophthalmichthys molitrix |
1059.67± 122.54 |
1080.96± 335.46 |
|
Labeo rohita |
822.1± 100.59 |
662.04± 132.53 |
|
Cyprinus carpio |
1024.51± 115.16 |
881.43± 42.15 |
|
Cirrhinus mrigala |
861.13 ± 119.50 |
752.83± 105.94 |
|
Ctenopharyngodon idella |
552.33± 174 |
730.5± 32.08 |
|
Length |
||
|
Hypophthalmichthys molitrix |
42.9± 4.98 |
41.42± 7.63 |
|
Labeo rohita |
34.36± 4.23 |
26.92± 5.13 |
|
Cyprinus carpio |
39.83± 4.51 |
39.28± 1.95 |
|
Cirrhinus mrigala |
46.07± 6.61 |
40.87± 5.73 |
|
Ctenopharyngodon idella |
30.81± 8.93 |
34.00± 9.27 |
In the present study statistical analysis ANOVA and LSD results reveals that Highest RBC’s was observed in silver and lowest in grass carp. Highest MCHC was observed in silver carp and lowest in rohu and grass carp.
Higher value of WBC’s observed in rohu and lowest value observed in silver carp. Higher Lymphocytes, Granulocytes and MID was observed in rohu and lowest in silver. Higher Platelets and RDW-SD was observed in silver and lowest in mori. Higher RDW-CV was observed in rohu and lowest in grass carp. Highest MPV, PCT and P-LCR were observed in mori and lowest in grass carp however PDW was highest in silver carp and lowest in grass carp. While on the other hands statistical analysis ANOVA and LSD results for farm fish reveals that Highest RBC’s observed in mori and rohu and lowest in gulfam and grass carp. Highest Hemoglobin observed in silver carp and lowest in gulfam, grass and mori. MCHC and PDW shown highest values in silver and lowest in gulfam fish while white blood cells, lymphocytes and MID shown highest trends in gulfam and lowest in silver carp. Graulocytes shown highest values in gulfam and lowest values in rohu fish. Highest platelets observed in gulfam and lowest in mori. RDW-SD and PDW shown highest values in silver fish while lowest values in mori and gulfam respectively. RDW-CV was highest in gulfam and least value was observed in silver and grass carp. MPV, PCT and P-LCR were observed highest in mori while lowest was observed in gulfam and silver respectively (Table IV).
Table II. Comparative water quality parameters (Mean± S.D) of Farm and River Chenab.
|
Parameters |
Farm water |
River water |
|
Temperature (°C) |
22.67± 0.58 |
20.00± 1.00 |
|
pH (-log(H)) |
8.67± 0.21 |
7.80± 0.006 |
|
Dissolved oxygen (mg/l) |
6.61± 0.19 |
6.72± 0.17 |
|
Hardness (mg/l) |
282.67± 2.52 |
132.33± 2.52 |
|
Alkalinity (mg/l) |
222.67± 2.52 |
121.33± 1.53 |
|
Nitrate (mg/l) |
13.17± 0.06 |
5.7± 0.1 |
|
Nitrite (mg/l) |
3.3± 0.1 |
1.2± 0.1 |
|
Phosphate (mg/l) |
0.25± 0.01 |
0.147± 0.03 |
|
Ca and Mg (meq L-1) |
5.5± 0.1 |
2.67± 0.12 |
|
Sodium (meq L-1) |
2.33± 0.06 |
0.8± 0.1 |
|
Carbonate (meq L-1) |
0± 0 |
0± 0 |
|
Bicarbonate (meq L-1 ) |
3.8± 0.1 |
2.57± 0.15 |
|
Chloride (meq L-1) |
3.5± 0.1 |
1.13± 0.15 |
|
Chlorine (meq L-1) |
0± 0 |
0± 0 |
|
SAR |
1.41± 0.05 |
0.72± 0.06 |
|
RSC (meq L-1) |
0± 0 |
0.033± 0.06 |
|
EC (uS cm-1) |
780.33± 0.58 |
363.67± 3.51 |
Abbreviations: SAR, sodium adsorption ratio; EC, electrical conductivity; RSC, residual sodium carbonate; Ca, Calcium; Mg, Magnesium.
DISCUSSION
Present study was conducted to determine the hematological differences among the similar species of River Chenab (wild) and local fish farm of Sargodha. Significant differences were observed among water quality parameters of farm and River Chenab. Oxygen was recorded in higher ratio in the river Chenab as compared to farm water, which may be due to continuous flow of water in river. All other parameters shown higher trend in farm water while chlorine and carbonate were below detection limit in both habitats. However, the water of both localities was suitable for fish growth. All these parameters have great influence on the quality of the blood parameter like it may change RBCs count, leukocyte count and immune response etc. but dissolve oxygen and temperature are the chief parameter that effect the most. Numerous studies were performed to conclude if major difference from standard value of these constraints subsists that might be attributed to any sort of internal or external issue (Sahoo et al., 2008; Blanksma et al., 2009; Gorjipour, 2014; Gandotra et al., 2017; Küçükgül et al., 2019).
Zhou et al. (2009) investigated the hematology of wild and cultivated Dojo loach, according to his results cultured Dojo have higher RBC’s count as compared to its wild counterpart, while wild Dojo have higher WBC’s count as compared to cultivated. Similar findings were obtained in present study in terms of RBC’s. Cultured silver, rohu, mori, gulfam and grass carp show higher values of RBC’s as compared to wild silver, rohu, mori, gulfam and grass carp, However, WBC’s results are contrary to present study in some species. Wild rohu and mori have higher WBC’s count, as compared to farmed rohu and mori. No significant difference was observed in WBC’s of wild and farmed silver and grass carp while farmed gulfam shown higher WBC’s as compared to wild counterpart. Higher WBCs count indicate a strong immune system because WBCs are key gears of innate immune-system and leukocytes are the chief component that involved in regulation of immunological function of the organism (Ballarin et al., 2004).
Kumar et al. (2017) reported higher MCV, MCHC, and MCH in mori and highest PLT in rohu and lowest in silver carp, apart from this lowest RBC’s was reported in gulfam. Similar findings were obtained in present research work except MCH and MCV, while highest RDW was reported in rohu. Kumar et al. (2017) reported lowest neutrophil value in gulfam which is contrary to the current study findings. Besides this hemoglobin level showed following trend; rohu˃ silver carp˃ grass carp˃ mori˃ common carp in their study, while our results are little bit contrary to those of Kumar et al. (2017) which show the following trans: silver˃ rohu˃ mori˃ grass carp˃ common carp. These changes may result because of environmental conditions, physical dysfunction, water quality and different types of stresses during handling.
Table III. Hematological parameters of selected fish species (farm and wild).
|
Para meters |
Hypophth almichthys molitrix |
Labeo rohita |
Cyprinus carpio |
Cirrhinus mrigala |
Ctenopha ryngodon idella |
||||||
|
Farm |
Wild |
Farm |
Wild |
Farm |
Wild |
Farm |
Wild |
Farm |
Wild |
||
|
RBC (µl ×10^6) |
2.36± 0.33 |
2.16± 0.34 |
2.30± 0.40 |
2.14± 0.31 |
2.07± 0.38 |
1.87± 0.14 |
1.81± 0.39 |
2.16± 0.49 |
1.76± 0.20 |
1.48± 1.29 |
|
|
HB (g/dl) |
10.89± 1.35 |
8.63± 1.48 |
9.75± 1.61 |
6.19± 0.81 |
8.58± 1.00 |
7.25± 0.71 |
9.50± 1.26 |
7.80± 1.31 |
9.29± 0.91 |
6.78± 0.81 |
|
|
Hct (%) |
32.65± 4.16 |
27.07± 1.98 |
32.54± 2.13 |
28.7± 2.11 |
36.71± 4.38 |
29.89± 3.34 |
33.54± 4.52 |
26.96± 2.97 |
35.53± 4.07 |
29.54± 3.18 |
|
|
MCV (Fl) |
139.34± 14 |
176.47± 36.21 |
146.45± 36.9 |
170.99± 26.83 |
164.41± 26.7 |
173.69± 23.7 |
147.33± 32.1 |
166.76± 53.25 |
177.52± 30.69 |
218.19± 37 |
|
|
MCH (Pg) |
46.32± 2.18 |
57.32± 17.85 |
43.61± 11.99 |
36.78± 5.96 |
37.27± 7.00 |
42.05± 4.02 |
42.30± 11.91 |
49.11± 20.06 |
46.00± 4.63 |
50.18± 8.92 |
|
|
MCHC (g/dl) |
33.42± 1.87 |
31.83± 4.71 |
30.95± 5.94 |
21.64± 2.89 |
22.69± 2.21 |
24.56± 3.88 |
28.50± 3.34 |
29.08± 5.07 |
26.18± 5.63 |
23.23± 3.92 |
|
|
WBC (µl×10^3) |
29.97± 4.97 |
33.06± 1.80 |
41.95± 4.65 |
63.67± 5.47 |
79.67± 14.26 |
53.41± 8.02 |
38.66± 8.48 |
48.52± 5.70 |
53.61± 14.75 |
50.87± 7.24 |
|
|
Lym (µl ×10^3) |
27.79± 3.56 |
24.61± 1.31 |
29.55± 2.90 |
41.86± 4.61 |
31.58± 13.16 |
36.49± 6.15 |
29.05± 6.67 |
24.41± 4.35 |
30.88± 13.67 |
35.96± 4.69 |
|
|
Lym (%) |
69.56± 0.56 |
74.48± 2.21 |
70.52± 1.63 |
65.64± 2.26 |
74.27± 3.45 |
68.23± 2.78 |
70.32± 1.37 |
69.98± 1.44 |
71.61± 4.04 |
70.77± 1.03 |
|
|
Gra (µl ×10^3) |
3.95± 0.84 |
3.97± 0.48 |
3.47± 0.61 |
8.05± 0.97 |
6.16± 0.97 |
5.91± 0.60 |
3.59± 1.26 |
3.04± 0.60 |
4.56± 0.72 |
5.07± 1.49 |
|
|
Gra (%) |
9.1± 0.76 |
11.98± 1.03 |
8.23± 0.68 |
12.68± 1.52 |
13.78± 0.80 |
11.17± 1.12 |
8.23± 1.24 |
8.69± 0.92 |
8.98± 2.24 |
9.78± 1.56 |
|
|
Mid-Range (µl×10^3) |
5.23± 0.61 |
4.48± 0.54 |
8.93± 1.35 |
13.76± 0.90 |
13.90± 0.49 |
11.00± 2.11 |
8.74± 1.57 |
10.80± 1.35 |
10.16± 1.45 |
9.83± 1.11 |
|
|
Mid-Range (%) |
17.57± 1.05 |
13.54± 1.24 |
21.25± 1.34 |
21.67± 1.33 |
17.89± 2.92 |
20.6± 2.21 |
20.56± 1.54 |
23.87± 3.35 |
20.69± 4.47 |
19.41± 0.87 |
|
|
Plt (µl ×10^3) |
60.88± 6.64 |
63.40± 3.46 |
38.59± 3.65 |
44.62± 3.48 |
86.83± 44.94 |
46.59± 12.26 |
32.97± 6.08 |
32.13± 6.52 |
50.25± 5.18 |
43.67± 4.61 |
|
|
Rdw- sd (Fl) |
75.84± 27.8 |
66.08± 1.75 |
10.81± 1.47 |
14.09± 1.40 |
67.24± 11.43 |
13.79± 1.28 |
14.05± 1.49 |
10.57± 1.74 |
58.94± 15.04 |
43.05± 4.94 |
|
|
Rdw-cv (%) |
12.05± 3.26 |
10.40± 1.08 |
19.36± 1.22 |
22.14± 2.74 |
38.16± 3.82 |
8.12± 1.84 |
22.03± 1.80 |
16.36± 4.68 |
10.91± 2.05 |
10.37± 1.55 |
|
|
MPV (Fl) |
11.49± 2.05 |
11.44± 0.56 |
10.19± 1.61 |
10.65± 1.51 |
6.83± 0.60 |
11.96± 1.70 |
26.82± 5.11 |
29.38± 3.89 |
8.89± 1.87 |
8.90± 1.71 |
|
|
PDW (%) |
14.10± 0.34 |
13.35± 0.71 |
10.95± 1.81 |
11.42± 1.82 |
8.21± 1.03 |
14.17± 1.87 |
10.32± 1.44 |
10.55± 2.02 |
11.89± 1.99 |
11.30± 1.75 |
|
|
Pct (%) |
0.05± 0.01 |
0.05± 0.01 |
0.02± 0.01 |
0.04± 0.01 |
0.08± 0.04 |
0.07± 0.08 |
1.14± 0.13 |
0.21± 0.14 |
0.04± 0.01 |
0.04± 0.01 |
|
|
P-lcr (%) |
33.19± 9.19 |
35.21± 1.65 |
27.02± 2.05 |
30.43± 2.15 |
31.32± 2.73 |
32.98± 5.77 |
56.32± 12.50 |
51.37± 6.49 |
26.01± 7.72 |
26.02± 3.86 |
|
|
Plt (µl ×103) |
60.88± 6.64 |
63.40± 3.46 |
38.59± 3.65 |
44.62± 3.48 |
86.83± 44.94 |
46.59± 12.26 |
32.97± 6.08 |
32.13± 6.52 |
50.25± 5.18 |
43.67± 4.61 |
|
|
Rdw- sd (fl) |
75.84± 27.83 |
66.08± 1.75 |
10.81± 1.47 |
14.09± 1.40 |
67.24± 11.43 |
13.79± 1.28 |
14.05± 1.49 |
10.57± 1.74 |
58.94± 15.04 |
43.05± 4.94 |
|
|
Rdw-cv (%) |
12.05± 3.26 |
10.40± 1.08 |
19.36± 1.22 |
22.14± 2.74 |
38.16± 3.82 |
8.12± 1.84 |
22.03± 1.80 |
16.36± 4.68 |
10.91± 2.05 |
10.37± 1.55 |
|
|
MPV (fl) |
11.49± 2.05 |
11.44± 0.56 |
10.19± 1.61 |
10.65± 1.51 |
6.83± 0.60 |
11.96± 1.70 |
26.82± 5.11 |
29.38± 3.89 |
8.89± 1.87 |
8.90± 1.71 |
|
|
PDW (%) |
14.10± 0.34 |
13.35± 0.71 |
10.95± 1.81 |
11.42± 1.82 |
8.21± 1.03 |
14.17± 1.87 |
10.32± 1.44 |
10.55± 2.02 |
11.89± 1.99 |
11.30± 1.75 |
|
|
Pct (%) |
0.05± 0.01 |
0.05± 0.01 |
0.02± 0.01 |
0.04± 0.01 |
0.08± 0.04 |
0.07± 0.08 |
1.14± 0.13 |
0.21± 0.14 |
0.04± 0.01 |
0.04± 0.01 |
|
|
P-lcr (%) |
33.19± 9.19 |
35.21± 1.65 |
27.02± 2.05 |
30.43± 2.15 |
31.32± 2.73 |
32.98± 5.77 |
56.32± 12.50 |
51.37± 6.49 |
26.01± 7.72 |
26.02± 3.86 |
|
Abbreviations: RBCs, red blood cells; Hb, hemoglobin; HCT, hematocrit; MCH, mean cell hemoglobin; MCV, mean cell hemoglobin; MCHC, mean cell hemoglobin concentration; WBCs, white blood cells; Lym, lymphocytes), Gra, granulocytes; Mid, Mid-range cells; Plt, platelets; Rdw-sd, red cell distribution width-standard deviation; Rdw-cv, red cell distribution width- coefficient of variation; MPV, mean platelet volume; PDW, platelet distribution width; Pct, plateletcrit; P-lcr, platelet- large cell ratio.
Table IV. ANOVA and LSD results of hematology of farm and wild fish species.
|
Par-am eters |
Hypophtha lmichthys molitrix |
Cirrhinus mrigala |
Labeo rohita |
Cyprinus carpio |
Ctenopha ryngodon idella |
P-values |
||||||
|
Farm |
Wild |
Farm |
Wild |
Farm |
Wild |
Farm |
Wild |
Farm |
Wild |
Farm |
Wild |
|
|
RBC |
2.16± 0.34a |
2.07± 0.33ab |
2.16± 0.49a |
2.33± 0.39a |
2.14± 0.31a |
2.30± 0.40a |
1.87± 0.14a |
1.76± 0.38b |
1.48± 1.29b |
1.81± 0.20b |
** |
* |
|
Hb |
8.63± 1.48a |
10.89± 1.35a |
7.80± 1.31ab |
9.50± 1.26b |
6.19± 0.81c |
9.75± 1.61ab |
7.25± 0.71bc |
8.58± 1.00b |
6.78± 0.81bc |
9.29± 0.91b |
** |
* |
|
Hct |
27.07 ±1.98a |
32.6 ±4.16a |
26.96 ±2.97a |
33.54 ±4.52a |
28.7 ± 2.11a |
32.54 ±2.13a |
29.89 ±3.34a |
36.7 ± 4.38a |
29.54 ±3.18a |
35. ±4.07a |
0.18 |
0.21 |
|
MCV |
176.47 ±36.2b |
139.34 ±14b |
166.76 ±53.3b |
147.33 ±32ab |
170.9 ±26.9b |
146.45 ±37ab |
173.6 ±23.7b |
164.4± 27ab |
218.1 ± 37a |
177.5 ± 31a |
0.08 |
0.11 |
|
MCH |
57.32± 17.85a |
46.32± 2.18a |
49.11± 20.1ab |
42.30± 12a |
36.78± 5.96b |
43.61± 12a |
42.05± 4.02b |
37.27± 7.00a |
50.18± 8.92ab |
46.0 ±4.6a |
0.05 |
0.29 |
|
MCHC |
31.83± 4.71a |
33.42± 1.87a |
29.08± 5.07ab |
28.50± 3.3bc |
21.64± 2.89c |
30.95± 5.94ab |
24.56± 3.88bc |
22.69± 2.21d |
23.23± 3.92c |
26.1± 5.6cd |
*** |
*** |
|
WBC |
33.06± 1.80c |
29.97± 4.97d |
48.52± 5.70b |
38.66± 8.5cd |
63.67± 5.47a |
41.95± 4.65c |
53.41± 8.02b |
79.67± 14.5a |
50.87± 7.24b |
53.6± 14.8b |
*** |
*** |
|
Lym |
24.61± 1.31c |
20.79± 3.56c |
24.41± 4.35c |
30.05± 6.7bc |
41.86± 4.61a |
29.55± 2.90bc |
36.49± 6.15b |
59.58± 13a |
35.96± 4.69b |
38.8± 13.7b |
*** |
*** |
|
Lym% |
74.48± 2.21a |
69.56± 0.56b |
69.98± 1.44bc |
70.32± 1.37b |
65.64± 2.26d |
70.52± 1.63b |
68.23± 2.78c |
74.27± 3.45a |
70.77± 1.03b |
71.6± 4ab |
*** |
* |
|
Gra |
3.97± 0.48c |
3.95± 0.84bc |
3.04± 0.60c |
3.59± 1.26bc |
8.05± 0.97a |
3.47± 0.61c |
5.91± 0.60b |
6.16± 0.97a |
5.07± 1.49b |
4.56± 0.72b |
*** |
*** |
|
Gra% |
11.98± 1.03ab |
13.1± 0.76a |
8.69± 0.92c |
8.23± 1.24b |
12.68± 1.52a |
8.23± 0.68b |
11.17± 1.12b |
7.78± 0.80b |
9.78± 1.56c |
8.9 ± 2.24b |
*** |
*** |
|
Mid |
4.48± 0.54c |
5.23± 0.61d |
10.80± 1.35b |
8.74± 1.57c |
13.76± 0.90a |
8.93± 1.35bc |
11.00± 2.11b |
13.90± 0.49a |
9.83± 1.11b |
10.1± 1.4b |
*** |
*** |
|
Mid% |
13.54± 1.24d |
17.57± 1.05c |
23.87± 3.35a |
20.56± 1.5ab |
21.67± 1.33b |
21.25± 1.34a |
20.6± 2.21bc |
17.89± 2.9bc |
19.41± 0.87c |
20.6± 4.47ab |
*** |
* |
|
Plt |
63.40± 3.46a |
60.88± 6.64b |
32.13± 6.52c |
32.97± 6.08c |
44.62± 3.48b |
38.59± 3.65bc |
46.59± 12.2b |
86.83± 44.9a |
43.67± 4.61b |
50.5± 5.18bc |
*** |
*** |
|
Rdw-sd |
66.08± 1.75a |
75.84± 27.8a |
10.57± 1.74d |
14.05± 1.49c |
14.09± 1.40c |
10.81± 1.47c |
13.79± 1.28c |
67.24± 11ab |
43.05± 4.94b |
58.9± 15.0b |
*** |
*** |
|
Rdw-cv |
10.40± 1.08c |
12.05± 3.26c |
16.36± 4.68b |
22.03± 1.80b |
22.14± 2.74a |
19.36± 1.22b |
8.12± 1.84c |
38.16± 3.82a |
10.3± 1.55c |
10.9± 2.05c |
*** |
*** |
|
MPV |
11.44± 0.56b |
11.49± 2.05b |
29.38± 3.89a |
26.82± 5.11a |
10.65± 1.51bc |
10.19± 1.61b |
11.96± 1.70b |
6.83± 0.60c |
8.90± 1.71c |
8.8 ± 1.87bc |
*** |
*** |
|
PDW |
13.35± 0.71a |
14.10± 0.34a |
10.55± 2.02b |
10.32± 1.44b |
11.42± 1.82b |
10.95± 1.81b |
14.17± 1.87a |
8.21± 1.03c |
11.3± 1.75b |
11.8± 1.99b |
** |
*** |
|
Pct |
0.05± 0.01b |
0.05± 0.01b |
0.21± 0.14a |
1.14± 0.13a |
0.04± 0.01b |
0.02± 0.01b |
0.07± 0.08b |
0.08± 0.04ab |
0.04± 0.01b |
0.04± 0.0b |
*** |
** |
|
P-lcr |
35.21± 1.65b |
33.19± 9.19b |
51.37± 6.49a |
56.32± 12.5a |
30.43± 2.15bc |
27.02± 2.05b |
32.98± 5.77b |
31.32± 2.73b |
26.02± 3.86c |
26.0 ± 7.72b |
*** |
*** |
Signif. codes: 0 ‘***’ 0.001 ‘**’ 0.01 ‘*’ 0.05 ‘.’ 0.1 ‘ ’ 1. Values in a row with different superscripts are significantly different from each other.
For abbreviations, see Table III.
Afkhami et al. (2011) reported that C. idella and H. molitrix have higher blood parameters, Hb, PCV, RBC’s, WBC’s as compared to grass carp, Hb, PCV, RBC’s, WBC’s. Similar findings for RBC’s and Hb were obtained in present research silver carp shows higher Hb and RBC’s as compared to grass carp. However, PCV and WBC’s results are contrary to our findings because of various environmental factors. Kandeepan (2014) reported that rohu has higher RBC’s, WBC’s and PCV as compared to C. carpio RBC’s, WBC’s and PCV. According to present research result rohu shown higher value of RBC’s as compared to gulfam which is similar to the above mention study. However, in other three parameters the present research results are contrary to the Kandeepan (2014) study. This difference may arise due to different environmental and living conditions. Feed composition, feed quantity and feeding habits also affect the energy, metabolic pathways and in turn the physical health and hematological parameter of fish. Several studies had been carried out to evaluate the effects of the different feed on the blood parameter of fish like Kondera et al. (2017)erythroblast frequency, result in low frequency of neutrophilic lineage, low oxygen consumption rate. But they did not find any effect on immune response but record reduced haematopoietic activity, which was directly related to the metabolic rate. Another study by Iqbal et al. (2017) in which they used selenium fortified feed in different doses and conclude that different dose of selenium in feed can effects the counts of WBC’s, neutrophils, RBC’s and hemoglobin. In the current study feed availability was different in composition and even quantity in both of the habitat. So this may result in difference in blood parameter values.
CONCLUSION
It is concluded that hematological parameters of farm fish were influenced by some water quality parameters such as water temperature, dissolved oxygen, pH, calcium, magnesium and nitrate values or may be due to feed composition as compared to the wild. However, it is necessary to consider the age and size of the fish, breeding periods, gender, seasons, physiology of the fish, habitat and environmental conditions.
Statement of conflict of interest
The authors have declared no conflict of interest.
REFERENCES
Afkhami, M., Mokhlesi, A., Bastami, K.D., Khoshnood, R., Eshaghi, N. and Ehsanpour, M., 2011. Survey of some chemical compositions and fatty acids in cultured common carp (Cyprinus carpio) and grass carp (Ctenopharyngodon idella), Noshahr, Iran. World J. Fish mar. Sci., 3: 533-538.
Akbar, U.N., Raza, K.M., Hussain, H. and Mumtaz, M., 2015. Physicochemical parameters of water collected from river Panjkora, Khyber Pakhtunkhwa, Pakistan, World J. Fish mar. Sci., 7: 462-471.
Al-Asgah, N.A., Abdel-Warith, A.W., Younis, el-S.M. and Allam, H.Y., 2015. Haematological and biochemical parameters and tissue accumulations of cadmium in Oreochromis niloticus exposed to various concentrations of cadmium chloride. Saudi J. biol. Sci., 22: 543-550. https://doi.org/10.1016/j.sjbs.2015.01.002
Altaf, M., Khan, A.M., Umair, M. and Chattha, S.A., 2011. Diversity of carps in river Chenab, Pakistan. J. Zool., 26: 107-114.
Ashraf, M., Zafar, A., Rauf, A., Mehboob, S. and Qureshi, N.A., 2011. Nutritional values of wild and cultivated silver carp (Hypophthalmichthys molitrix) and grass carp (Ctenopharyngodon idella). Int. J. Agric. Biol., 13: 210-214.
Baghizadeh, E. and Khara, H., 2015. Variability in hematology and plasma indices of common carp Cyprinus carpio, associated with age, sex and hormonal treatment. Iran. J. Fish. Sci., 14: 99-111.
Ballarin, L., Dall’Oro, M., Bertotto, D., Libertini, A., Francescon, A. and Barbaro, A., 2004. Haematological parameters in Umbrina cirrosa (Teleostei, Sciaenidae): A comparison between diploid and triploid specimens. Comp. Biochem. Physiol., 138: 45-51. https://doi.org/10.1016/j.cbpb.2004.02.019
Blanksma, C., Eguia, B., Lott, K., Lazorchaka, J.M., Smith, M.E., Wratchko M., Dawson, T.D., Elonen, C., Kahl, M. and Schoenfuss, H.L., 2009. Effects of water hardness on skeletal development and growth in juvenile fathead minnows. Aquaculture, 286: 226-232. https://doi.org/10.1016/j.aquaculture.2008.09.026
Fazio, F., Marafioti, S., Arfuso, S., Piccione G. and Faggio, C., 2013. Comparative study of the biochemical and hematological parameters of four wild Tyrrhenian fish species Vet. Med., 58: 576–581. https://doi.org/10.17221/7139-VETMED
Fazio, F., Saoca, C., Acar, Ü., Tezel, R., Çelik, M., Yilmaz, S., Kesbiç, O., Yalgin, F. and Yiğit, M., 2020. A comparative evaluation of hematological and biochemical parameters between the Italian mullet Mugil cephalus (Linnaeus, 1758) and the Turkish mullet Chelon auratus (Risso,1810). Turk. J. Zool., 44: 22-30. https://doi.org/10.3906/zoo-1907-37
Fredianelli, A.C., Pierin, V.H., Uhlig, S.C., Galeb, L.D.A.G., Rocha, D.C.C., Ribeiro, D.R., Anater, A. and Pimpao, T.C., 2019. Hematologic, biochemical, genetic, and histological biomarkers for the evaluation of the toxic effects of fipronil for Rhamdia quelen. Turk. J. Vet. Anim. Sci., 43: 54-59. https://doi.org/10.3906/vet-1806-71
Gandotra, R., Kumari, R., Sharma, M. and Singh, D., 2017. Growth response of juveniles of rohu, Labeo rohita to different levels of lipids in the diet. Fish. aquat. J., 8: 345-353. https://doi.org/10.4172/2150-3508.1000210
Gorjipour, E., 2014. Effects of water type (river and well) on hematological parameters in juvenile Siberian Sturgeon (Acipenser baeri). J. Fish. aquat. Sci., 9: 213-220. https://doi.org/10.3923/jfas.2014.213.220
Iqbal, S., Atique, U., Mughal, M.S., Khan, N., Haider, M.S., Iqbal, J.K. and Akmal, M., 2017. Effect of selenium incorporated in feed on the hematological profile of tilapia (Oreochromis niloticus). J. aquat. Res. Dev., 8: 513. https://doi.org/10.4172/2155-9546.1000513
Kandeepan, C., 2014. Heamatological and biochemical parameters on few fresh water South Indian teleosts. Int. J. Curr. Microbiol. appl. Sci., 3: 1015-1022.
Khattak, A.M., Ahmed, N., Akram, M.Q., Izhar, I., Ilyas, S., Chaudhary, N.M., Khan, A.S.M., Iqbal, N. and Waheed, T., 2012. Evaluation of ground water quality for irrigation and drinking purposes of the areas adjacent to Hudiara Industrial Drain, Lahore, Pakistan. Pak. J. agric. Sci., 49: 549-556.
, M., 2017. Hematological and hematopoietic effects of feeding different diets and starvation in common carp Cyprinus carpio L. J. appl. Anim. Res., 45: 623-628. https://doi.org/10.1080/09712119.2016.1251926
Küçükgül, A., Yüngül, M., Kahraman, Z. and Dörücü, M., 2019. The effect of water parameters and dissolved minerals on the hematological parameters of during breeding period catfish (Silurus glanis). Braz. Arch. Biol. Technol., 62: e19180400. https://doi.org/10.1590/1678-4324-2019180400
Kumar, G.P., Reddy, G.V.S., Dhanapal, K., Babu, P.H. and Rani, T.S., 2017. Quality changes of mrigal (Cirrhinus mrigala) during different stages of rigor mortis. Int. J. Curr. Microbiol. appl. Sci., 6: 3242-3252. https://doi.org/10.20546/ijcmas.2017.612.377
Laghari, Y.M., 2018. Aquaculture in Pakistan: Challenges and opportunities. Int. J. Fish., 6: 56-59.
Lushchak, V.I., Matviishyn, T.M., Husak, V.V., Storey, J.M., and Storey, K.B., 2018. Pesticide toxicity: A mechanistic approach. EXCLI J., 17: 1101-1136. (This is how journal’s names is shown in NCBI)
Mallesh, B., Pandey, P.K., Kumar, K., Vennila, A. and Kumar, S., 2015. Bioconcentration of hexavalent chromium in Cirrhinus mrigala (Ham 1822): Effect on haematological parameters. J. Biol. Earth. Sci., 5: 59-67.
Mirza, M.R. and Sandhu, A.A., 2007. Fishes of the Punjab Pakistan. Polymer Publications, Lahore, Pakistan.
Parrino, V., Cappello, T., Costa, G., Cannavà, C., Sanfilippo, M., Fazio, F. and Fasulo, F., 2018. Comparative study of hematology of two teleost fish (Mugil cephalus and Carassius auratus) from different environments and feeding habits. Eur. Zool., 85: 193-199. https://doi.org/10.1080/24750263.2018.1460694
Sahiti, H., Bislimi, K., Dalo, E. and Murati, K., 2018. Effect of water quality in hematological and biochemical parameters in blood of common carp (Cyprinus carpio) in two lakes of Kosovo, N. E. Sci., 3: 323-332. https://doi.org/10.28978/nesciences.468987
Sahoo, S.K., Giri, S.S. and Chandra, S., 2008. Rearing performance of Clarias batrachus larvae: Effect of age at stocking on growth and survival during fingerling production. Aquaculture, 280: 158-160. https://doi.org/10.1016/j.aquaculture.2008.05.020
Shah, S.Q.A., Hussain, M.Z., Ali, M. and Salam, A., 2017. Effect of stress conditions on body composition parameters of farmed Rohu (Labeo rohita). Turk. J. Fish. aquat. Sci., 17: 471-476.
Zhou, X., Li, M., Abbas, K. and Wang, W., 2009. Comparison of haematology and serum biochemistry of cultured and wild Dojo loach Misgurnus anguillicaudatus. Fish Physiol. Biochem., 35: 435–441. https://doi.org/10.1007/s10695-008-9268-4
To share on other social networks, click on any share button. What are these?


