

Cloning, Expression, Purification, and Characterization of Soluble Bioactive Recombinant Human Anterior Gradient Homolog 2 - DsRed Monomer Protein in Escherichia coli


Cloning, Expression, Purification, and Characterization of Soluble Bioactive Recombinant Human Anterior Gradient Homolog 2 - DsRed Monomer Protein in Escherichia coli
Bingjie Zhou1, Hitesh Bhagavanbhai Mangukiya1, Siva Bharath Merugu1, Fakhar-un-Nisa Yunus1, Yuchen Fan1, Zhenghua Wu1,* and Dawei Li1,2,*

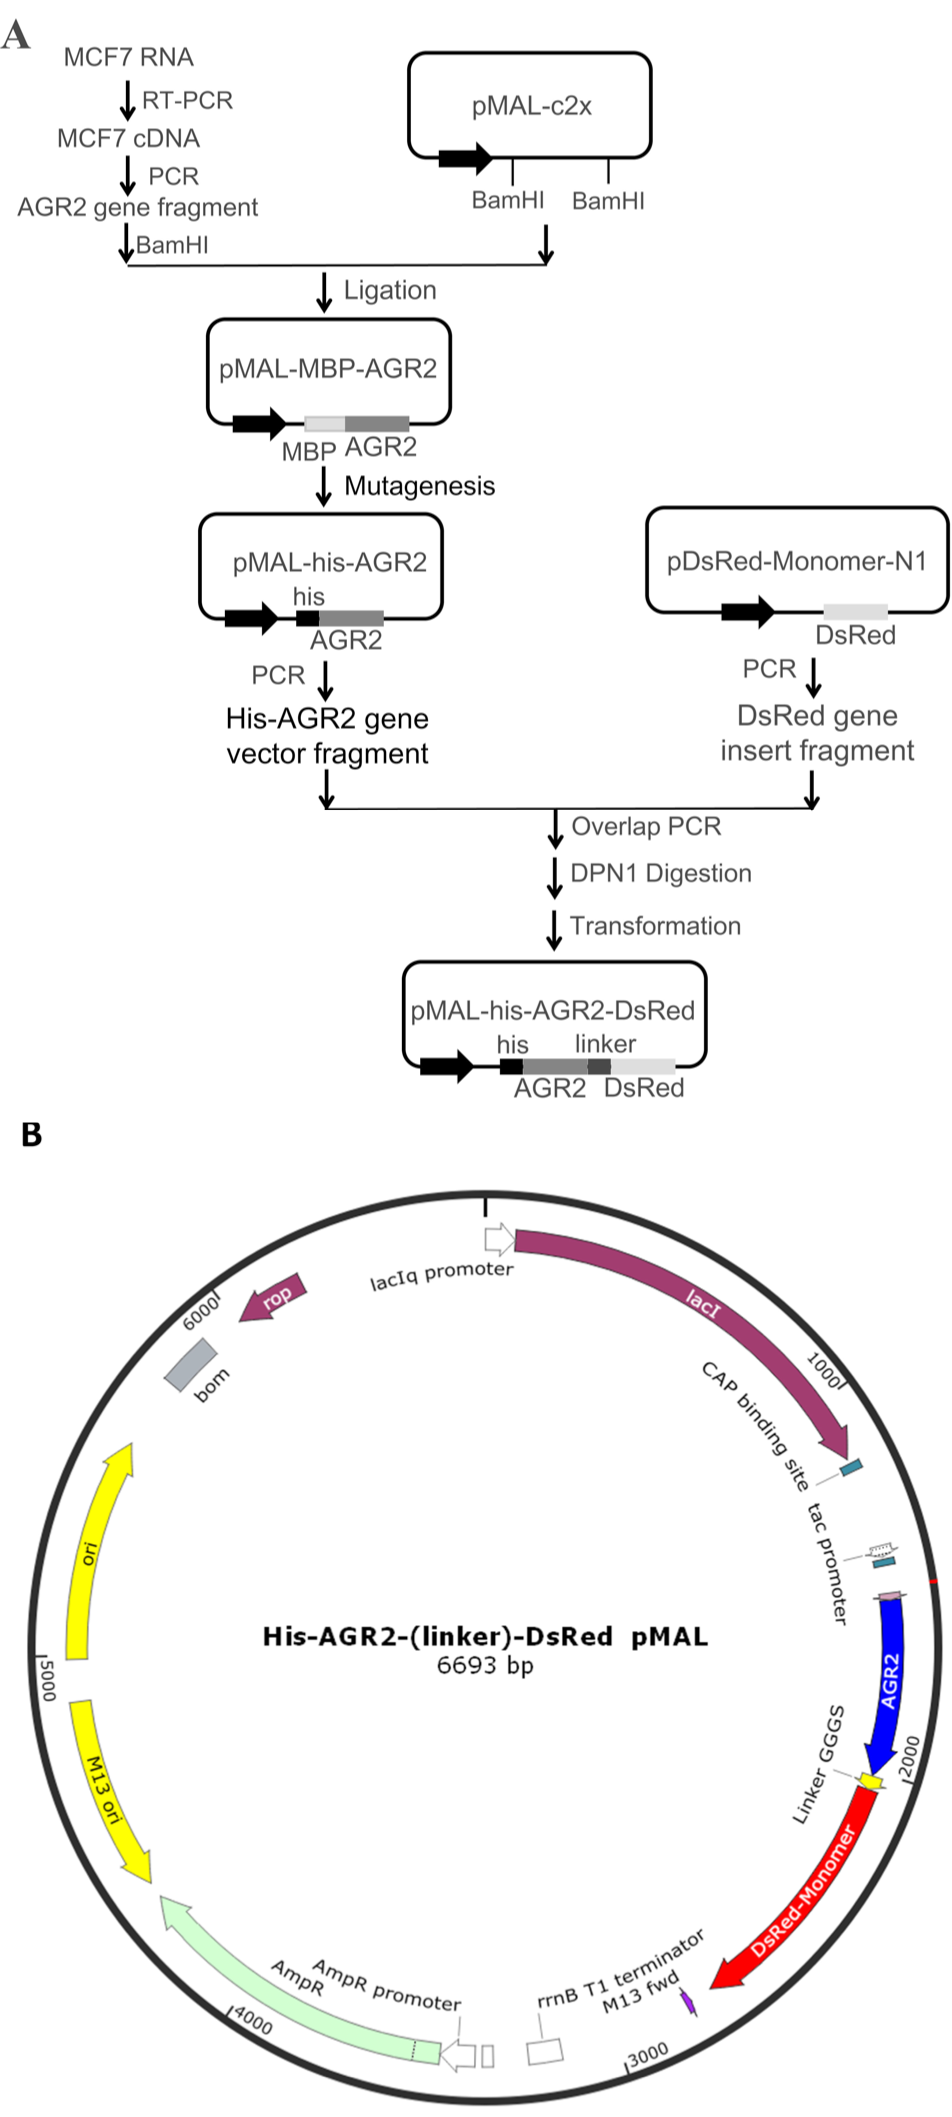
Construction and cloning of his-AGR2-DsRed plasmid. (A) Flowchart for the construction of his-AGR2-DsRed plasmid. (B) A schematic representation of his-AGR2-DsRed plasmid map. Essential elements include a poly-histidine tag, human AGR2 gene without signal peptide, a (GGGS)3 flexible linker, DsRed monomer gene as well as genes encoding the LacI repressor (lacR), ampicillin resistance (AmpR) and origins of replication.
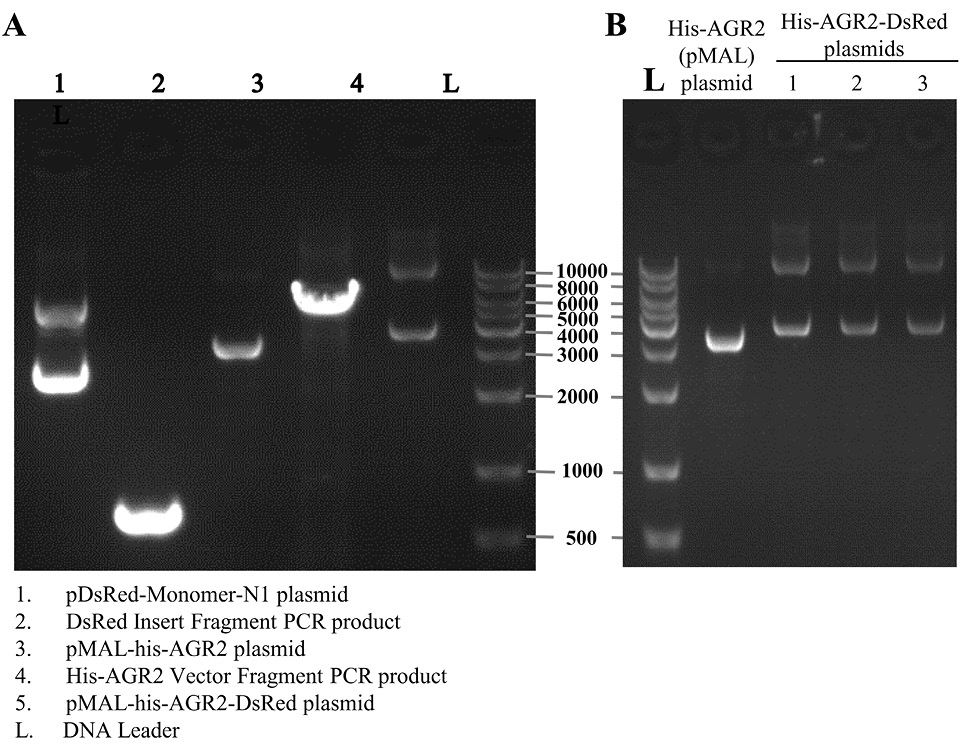
Agarose gel electrophoresis results of (A) Purified vector and insert fragments and their templates (B) the sequenced right his-AGR2-DsRed plasmids extracted from transformed E.coli. Line 1 to 4 were respectively pDsRed-Monomer-N1 plasmid, DsRed insert fragment PCR product, pMAL-his-AGR2 plasmid, his-AGR2 vector fragment PCR product, pMAL-his-AGR2-DsRed plasmid. L represented DNA Leader.
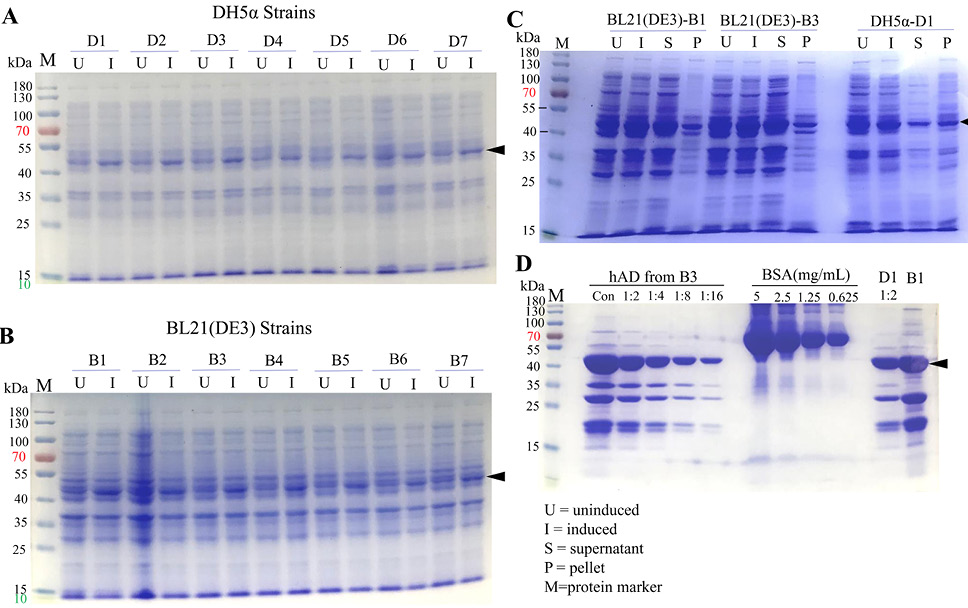
SDS-PAGE analysis of hAD expression in the BL21 (DE3) and DH5α E.coli strains. (A) Expression of hAD tested in DH5α E.coli, samples labeled as U were uninduced culture while I represented 1mM IPTG 4-hours induced culture. (B) Expression of hAD tested in BL21 (DE3) E. coli. (C) SDS-PAGE result of hAD recombinant protein expression bacteria strains B3 and D1 uninduced-induced samples and expression formats. Recombinant hAD expressed well, with considerable amount of protein being retained in the soluble fractions. (D) Purification results of hAD yielded from 250mL culture under the same conditions and compared with BSA protein standard.

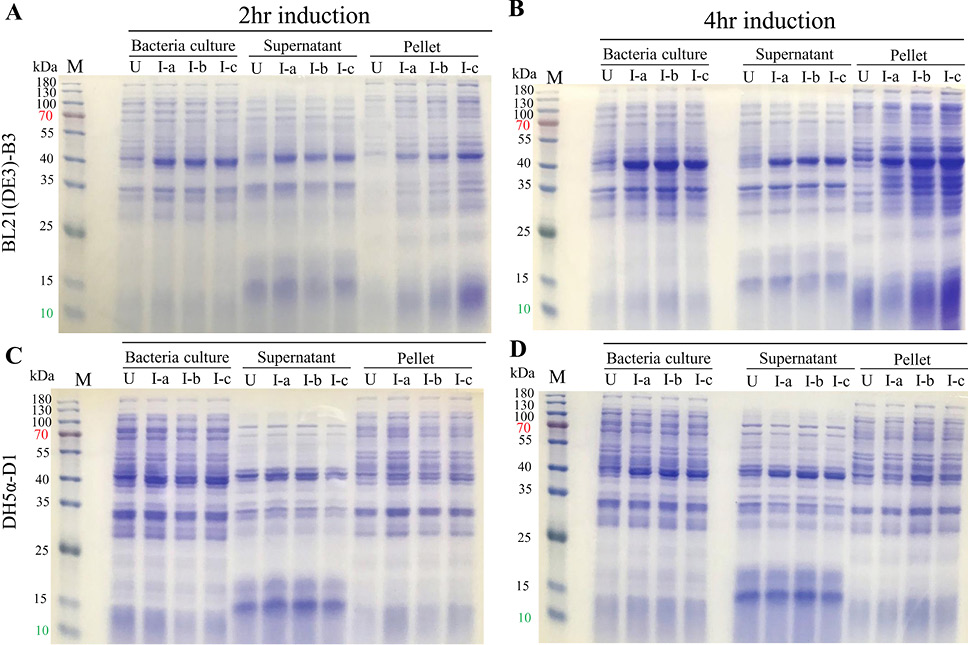
Optimization of expression condition compared by SDS-PAGE. Samples collected and prepared directly using bacteria culture as well as the expression formats were analyzed by SDS-PAGE. B3 hAD expression strain was cultured and induced under induction of 3 concentrations of IPTG, for 2 hours (A) or 4 hours (B), as well as D1 strain cultured and induced for 2 hours (C) and 4 hours (D). U, uninduced; I, induced; S, supernatant; P, pellet; I-a, 0.1mM IPTG induced; I-b, 0.5mM IPTG induced; I-c, 0.5mM IPTG induced; M, protein marker.
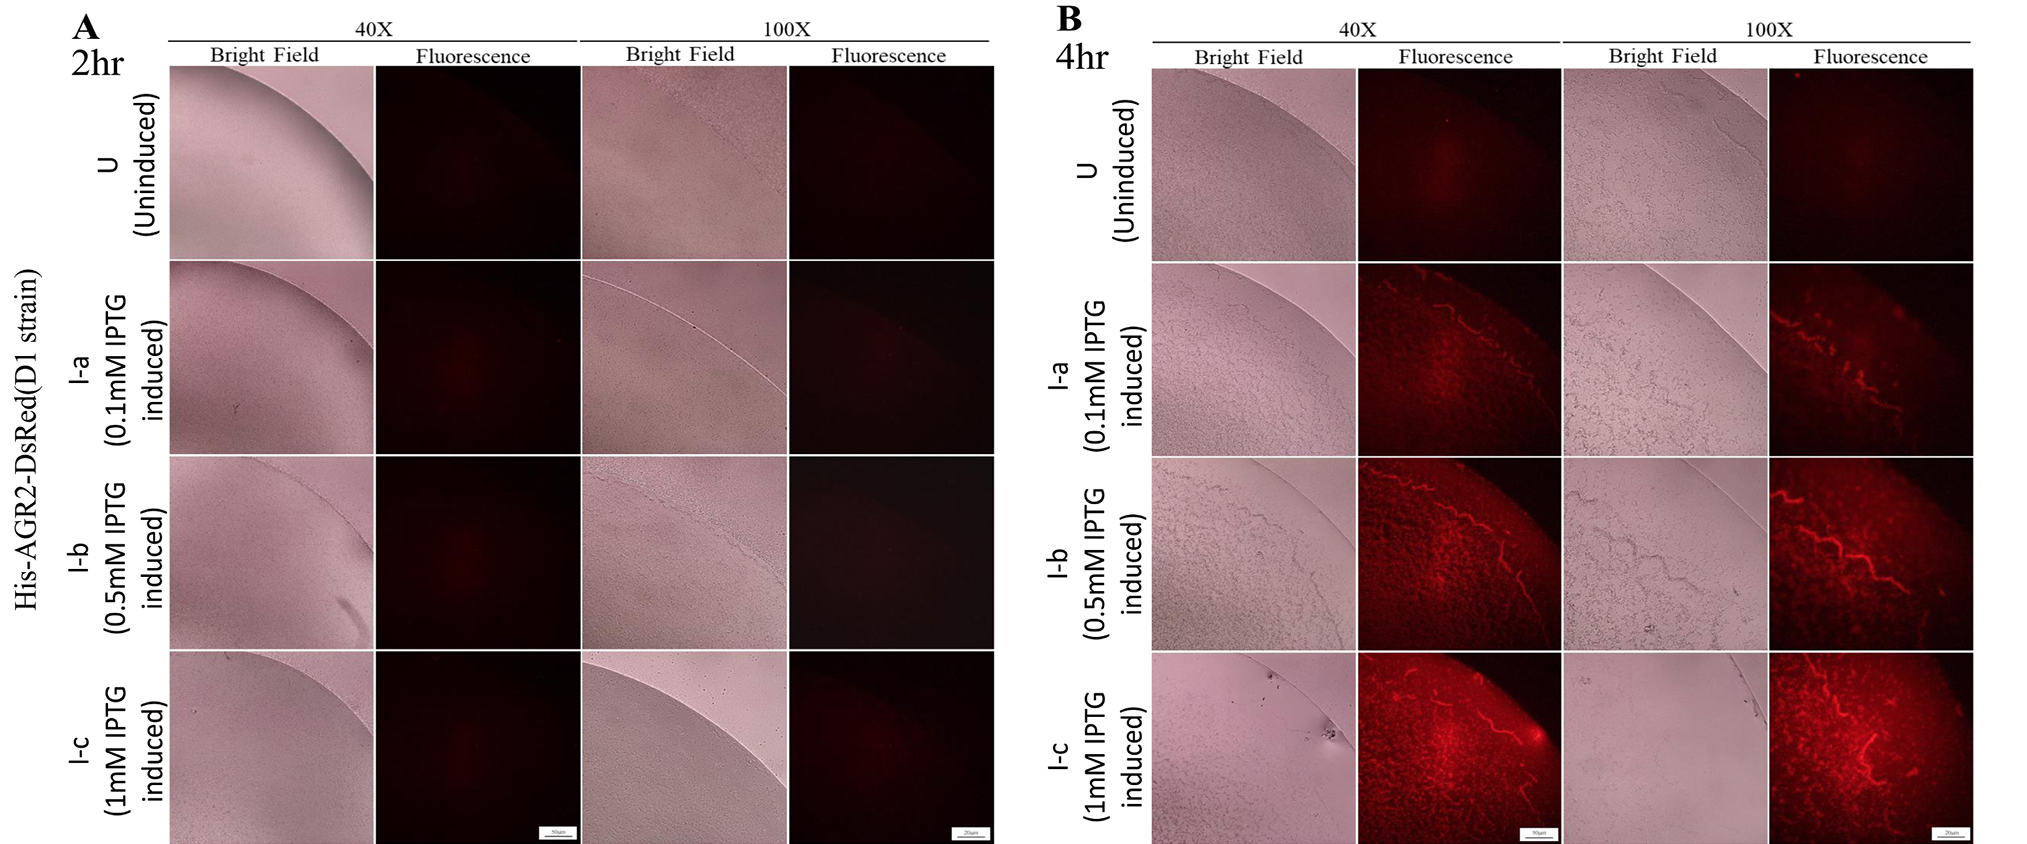
Optimization of expression condition of hAD in D1 strain compared by fluorescence microscopy. (A&B) D1 hAD expression strain was cultured and induced with 3 different concentrations of IPTG, for 2 hours or 4 hours. The bacterial culture of hAD expression D1 strain were induced for 2 hours or 4 hours aliquoted, observed and recorded under bright field and red fluorescence in 40×magnification. Scale bar, 50μm for 40×magnification and 50μm for 100×magnification. I-a, 0.1mM IPTG induced; I-b, 0.5mM IPTG induced; I-c, 0.5mM IPTG induced.
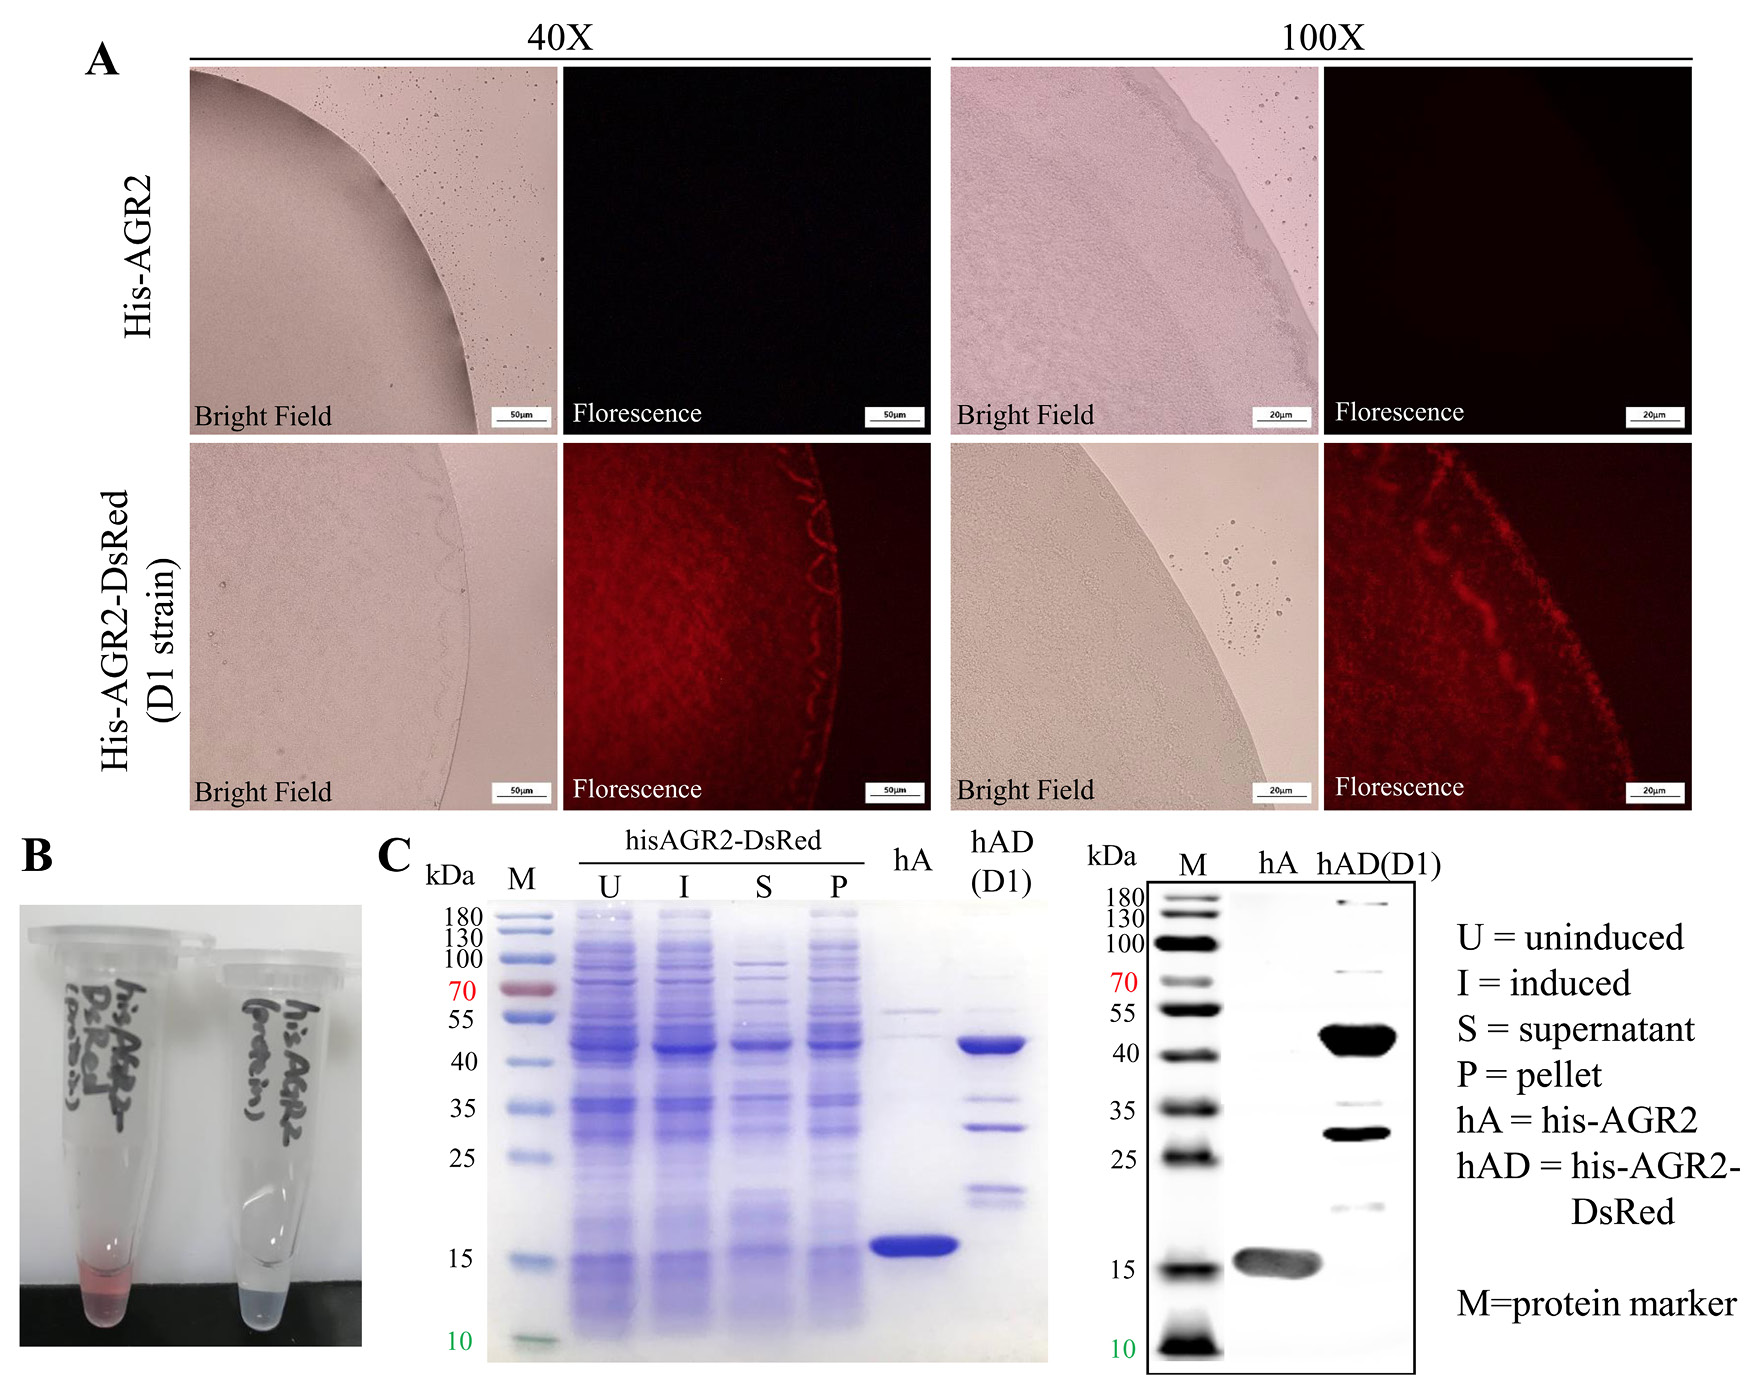
Recombinant hAD characterized by fluorescence microscopy and Western blot. (A) Bright field and red fluorescence of bacteria culture of his-AGR2 expression strain and hAD expression D1 strain in both 40× and 100× magnifications. Scale bar, 50μm for 40×magnification and 50μm for 100×magnification. (B) Purified his-AGR2 (up) and hAD (down) protein solution, representing different colors. (C) SDS-PAGE and Western blot result of purified hAD, compared with his-AGR2, along with its original expression in bacteria samples. U, uninduced; I, induced; S, supernatant; P, pellet; hA, his-AGR2; hAD, his-AGR2-DsRed; M, protein marker.

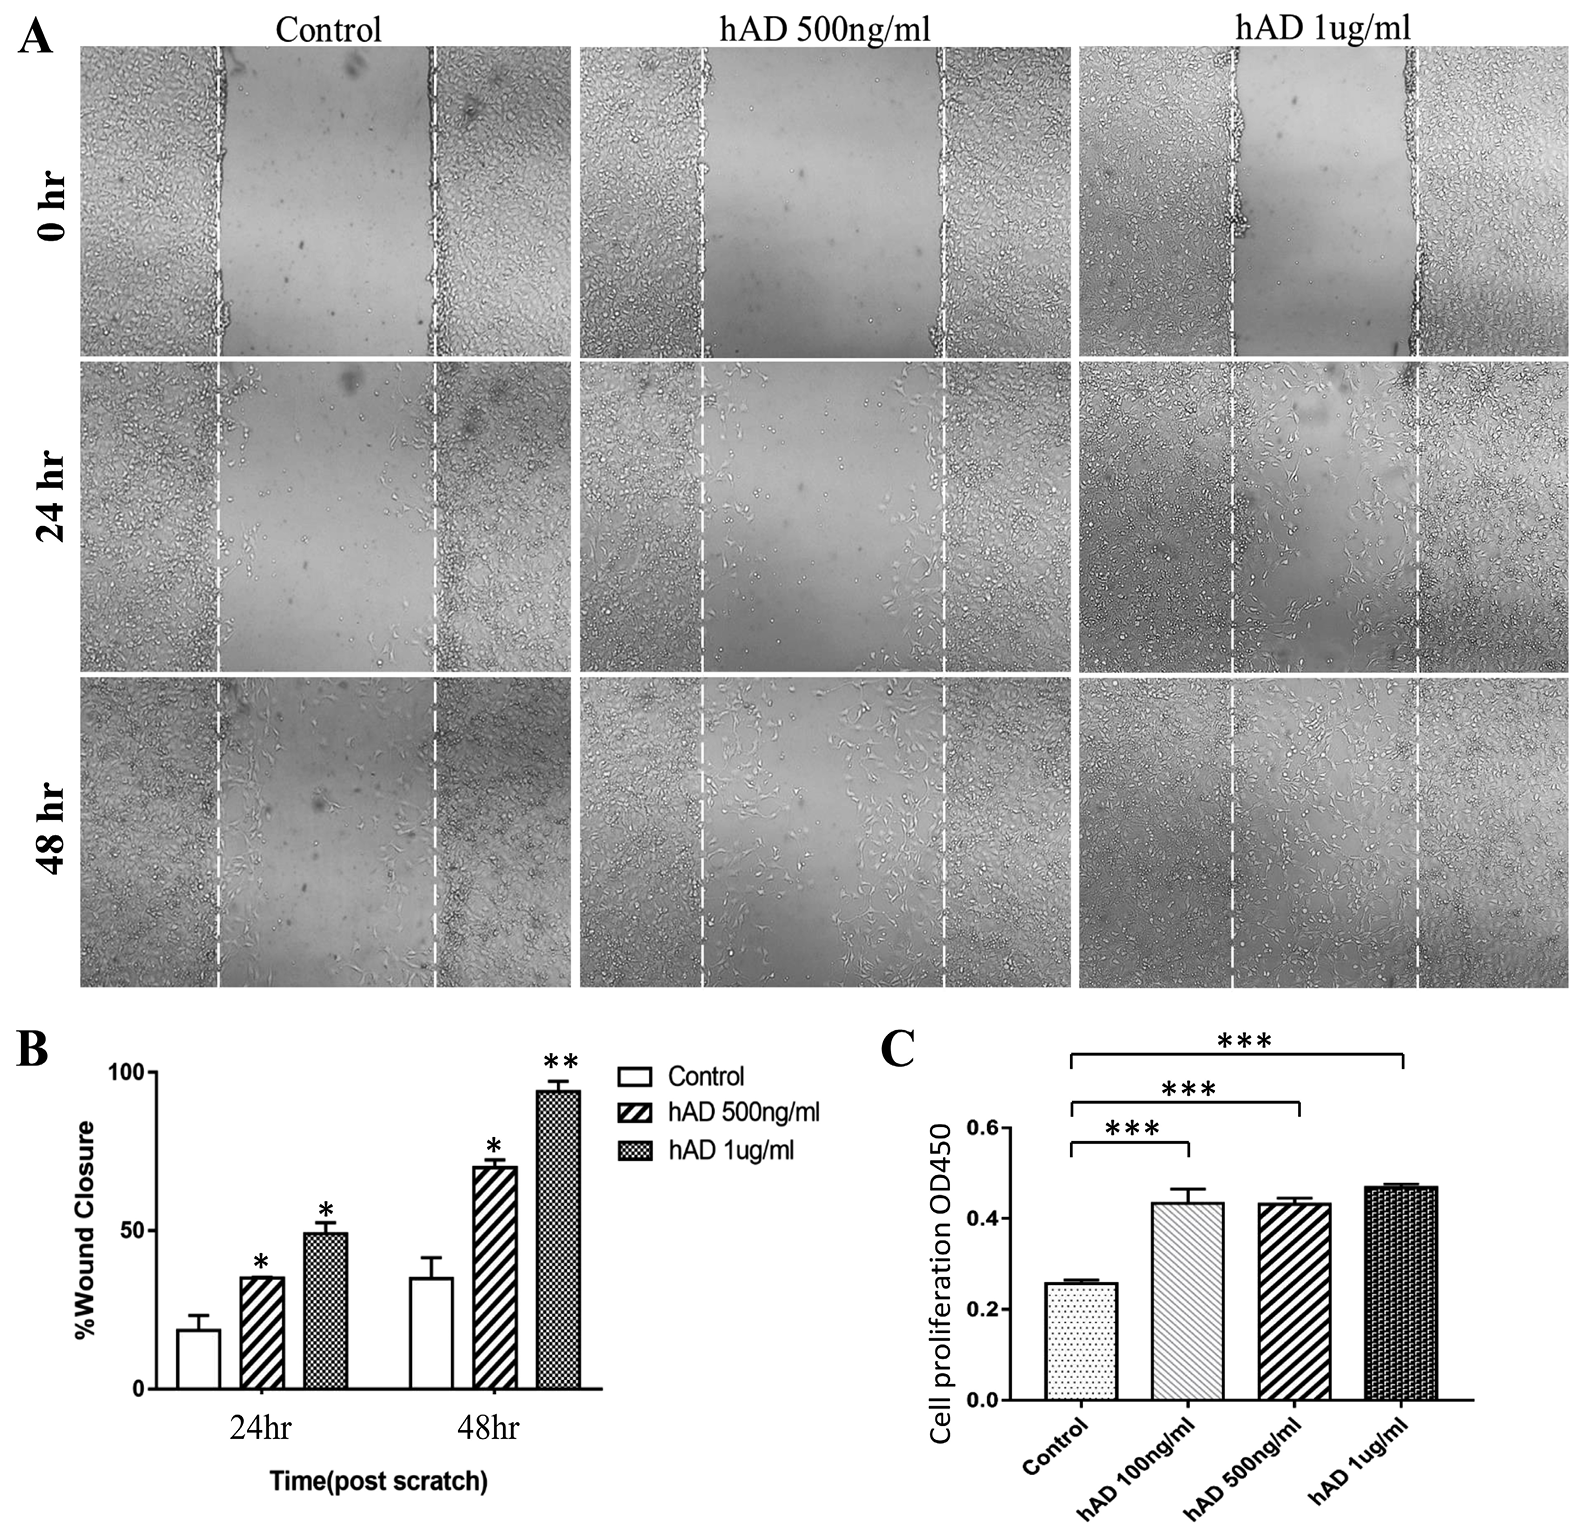
Recombinant hAD promotes NIH3T3 cell proliferation and migration. (A) Representative images from wound healing assays of NIH3T3 cell cultures treated with hAD demonstrating that cell migration into the cell-free region (outlined) is significantly accelerated in the presence of hAD when compared to controls. Images were captured at 24h and 48h after wounding (magnification, ×100). (B) Bar graph illustrating percentage wound closure at indicated time points during the scratch wound assay in the presence of varying concentrations of hAD (*P = 0.040, *P = 0.020, *P = 0.018, **P = 0.008 versus control). (C) NIH3T3 cell proliferation detected using the Cell Counting Kit-8 assay following treatment with hAD (0, 100, 500 and 1000 ng/mL) after 24h (****P<0.0001, versus the control group).

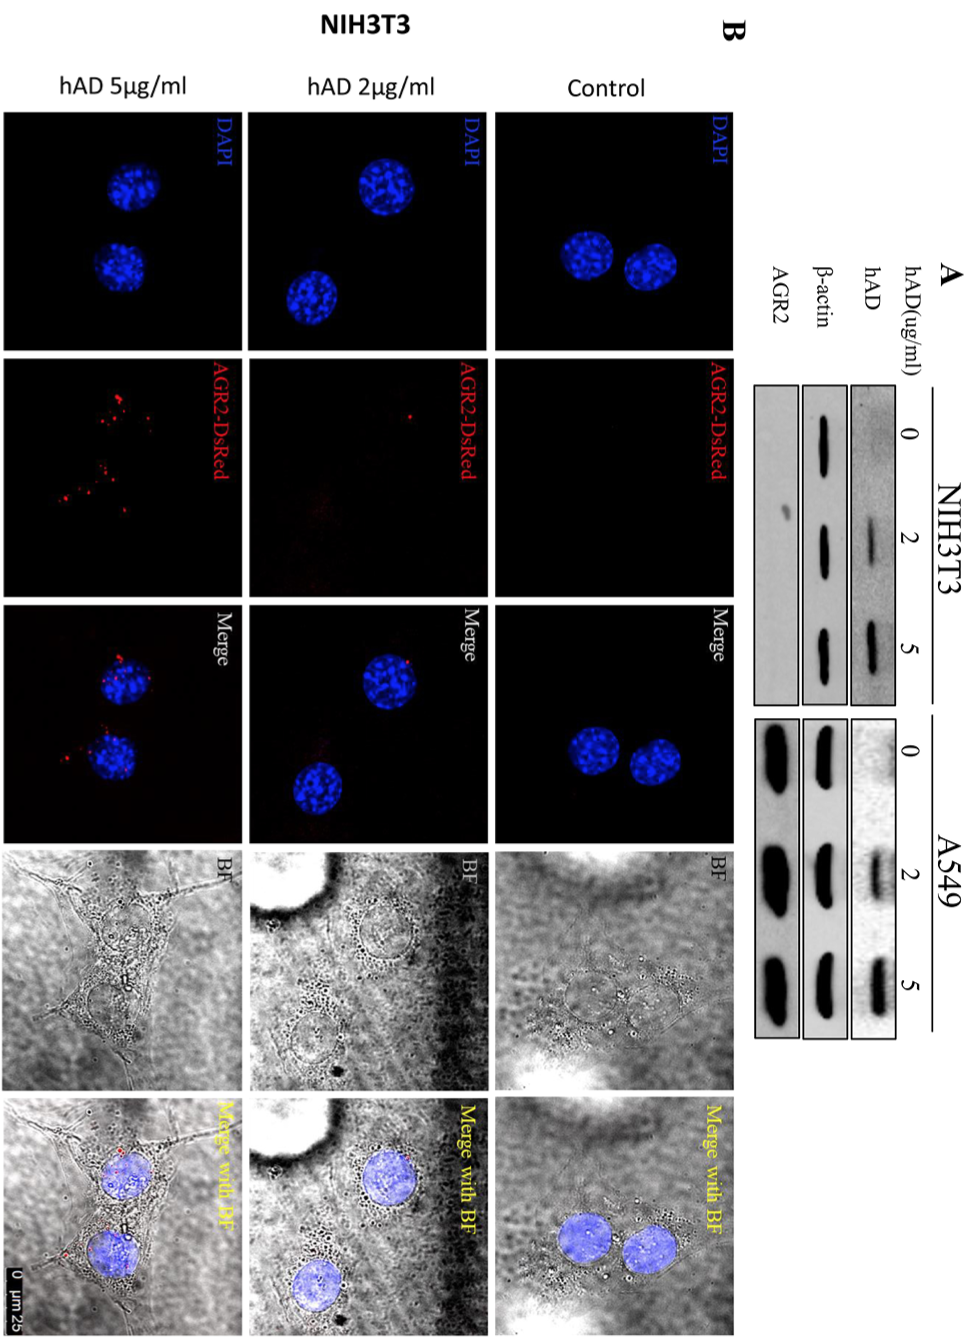
hAD helps to detect extracellular AGR2 internalization in NIH3T3 cell line which does not have internal AGR2 expression as well as in A549 which express internal AGR2. Cells were treated with different concentrations of hAD for 24h. Internalization of hAD was shown by (A) Western blot analysis. (B) Immunofluorescence assay. Scale bar, 25μm.


