
Changes in Subsoil Compaction and Salinity Caused by Tractor Wheels Passes During Tillage Practices Under Different Soil Types


Changes in Subsoil Compaction and Salinity Caused by Tractor Wheels Passes During Tillage Practices Under Different Soil Types
Rahim Bux Vistro1*, Mashooque Ali Talpur1, Irfan Ahmed Sheikh1, Muneer Ahmed Mangrio2, Rajish Kumar Soothar1, Mian Noor Hussain Asghar Ali3,4, Imran Ali Dhamach4, Muhammd Urs Mirjat1 and Abdul Saboor Soomro2

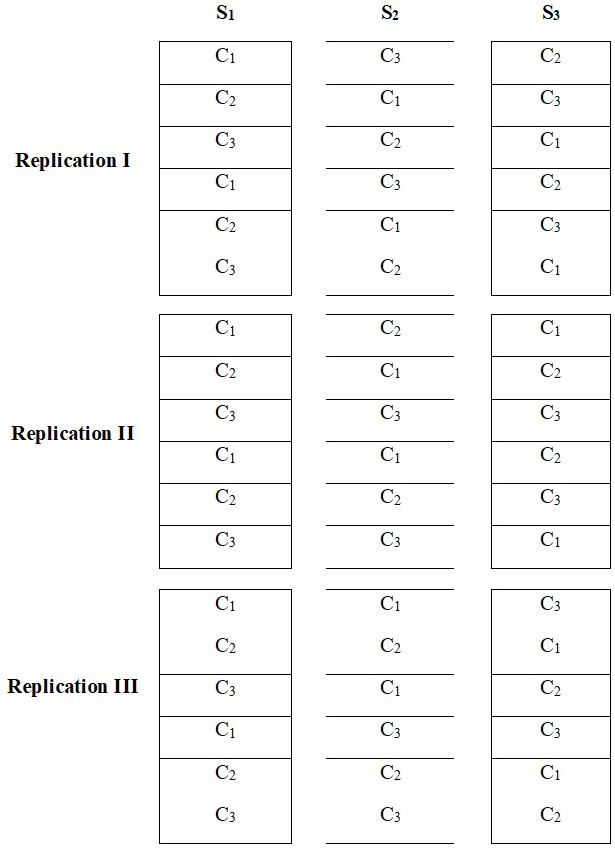
Experimental layout and setup in the field (S1= Clay loam soil; S2= Silty clay loam soil; S3= Silty loam soil; C1= Control without compaction, C2= Compaction with 03 rounds of tractor wheels passes; C3= Compaction with 06 rounds of tractor wheels passes.
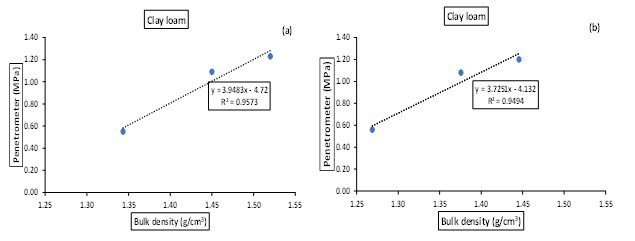
Relationship between dry bulk density under different compactions and soil penetration resistance for clay loam (S1) soil during (a) 2017-18 and (b) 2018-19 cropping seasons.
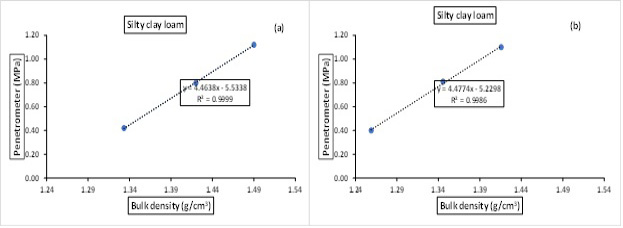
Relationship between dry bulk density under different compactions and soil penetration resistance for silty clay loam (S2) soil during 2017-18 (a) and 2018-19 (b) cropping seasons.
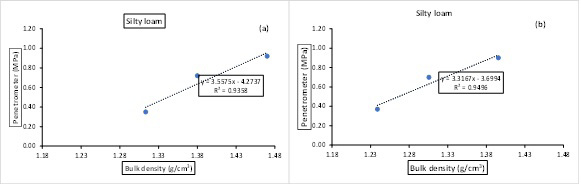
Relationship between dry bulk density under different compactions and soil penetration resistance for silty loam (S3) soil during 2017-18 (a) and 2018-19 (b) cropping seasons.

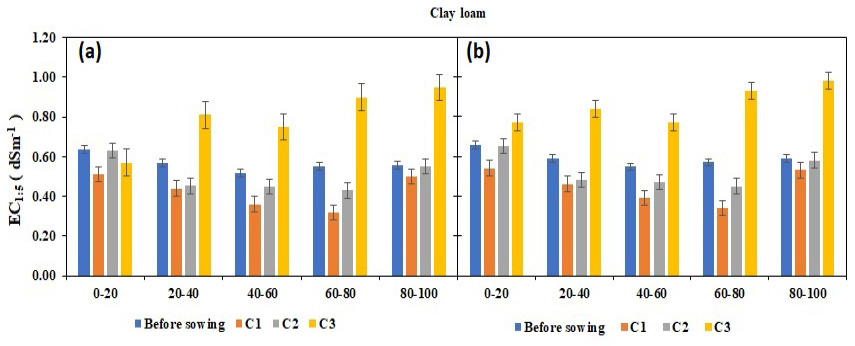
Before sowing and after experiment, the average EC1:5 of clay loam (S1) soil under different compactions during 2017-18 (a) and 2018-19 (b) cropping seasons.
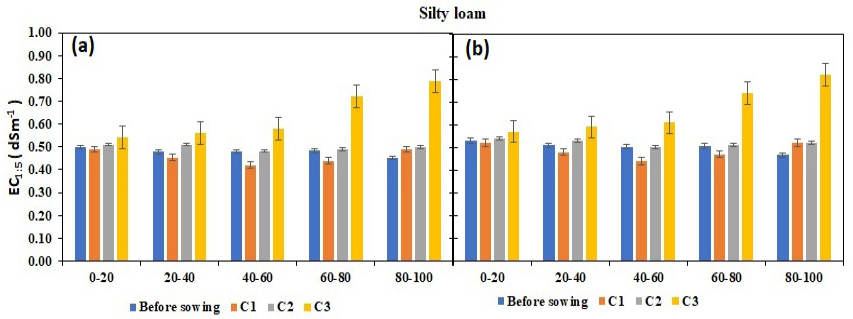
EC1:5 of silty loam (S3) soil before sowing and after experiment under different compaction during 2017-18 (a) and 2018-19 (b) cropping seasons.

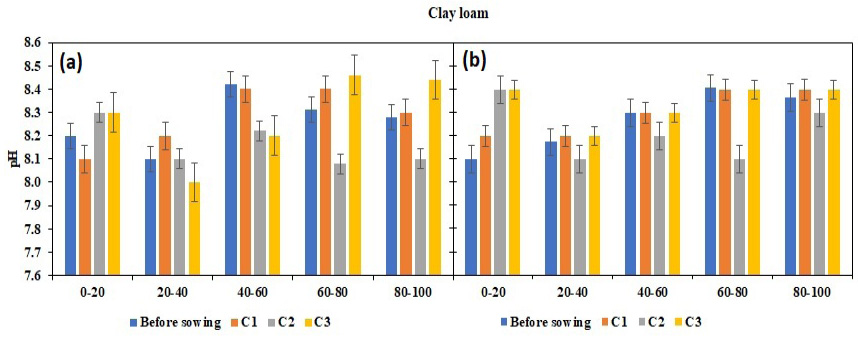
Soil pH of clay loam (S1) soil before sowing and after experiment under different compactions during 2017-18 (a) and 2018-19 (b) cropping seasons.
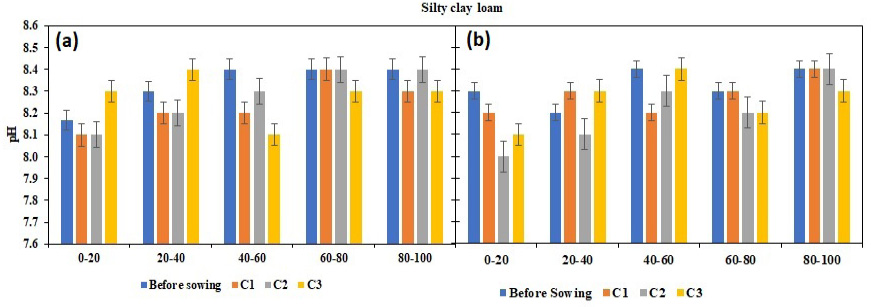
Before sowing and after experiment pH of silty clay loam (S2) soil under different compaction during 2017-18 (a) and 2018-19 (b) cropping seasons.
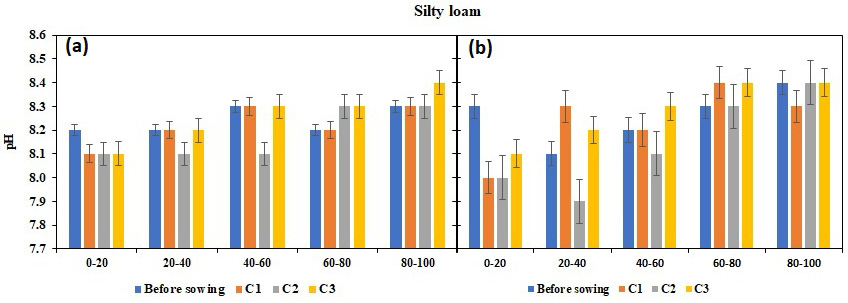
pH of silty loam (S3) soil before sowing and after experiment under different compaction during 2017-18 (a) and 2018-19 (b) cropping seasons.


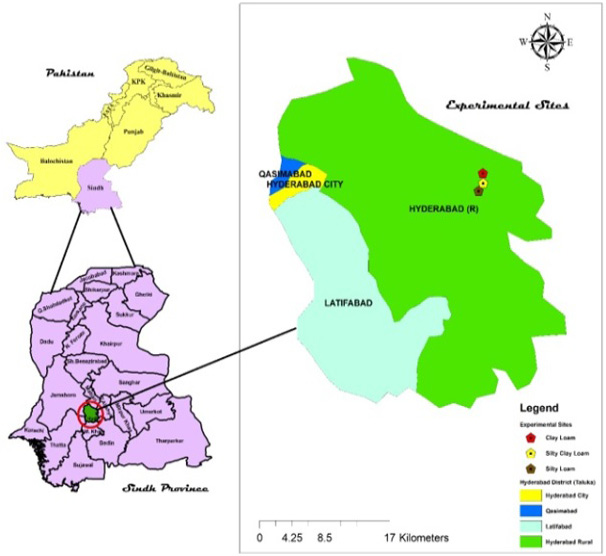
Location map of the experimental site.
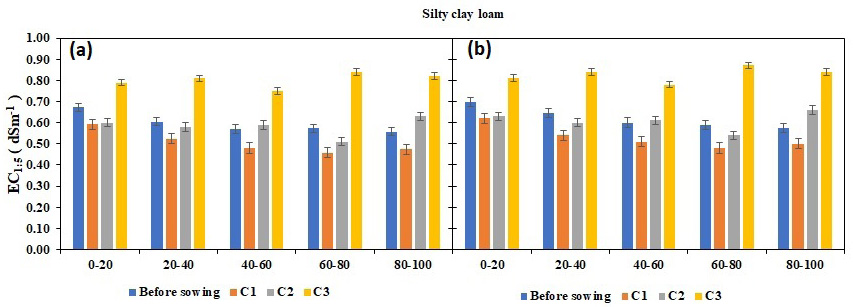
Before sowing and after the experiment, the average EC1:5 of silty clay loam (S2) soil under different compactions during 2017-18 (a) and 2018-19 (b) cropping seasons.

