

Bioinformatics Analyses of Bovine Adipose Tissue Transcriptome from Lilu Beef Cattle at Different Stages of Growth


Bioinformatics Analyses of Bovine Adipose Tissue Transcriptome from Lilu Beef Cattle at Different Stages of Growth
Guifen Liu1,2, Xiaomu Liu1,2, Khuram Shahzad3, Wei You1,2, Juan J. Loor3,* and Fachun Wan1,2,4,*
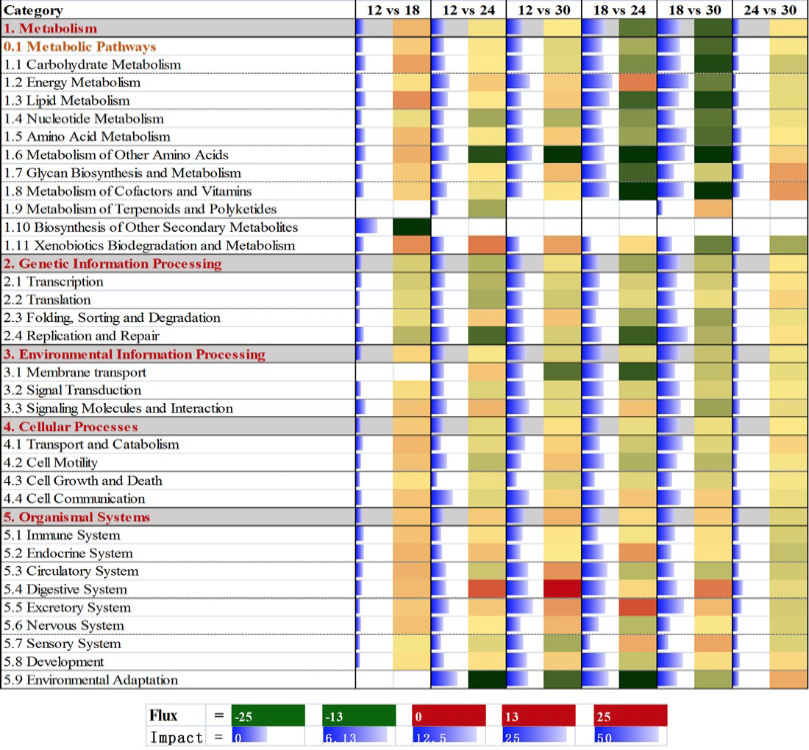
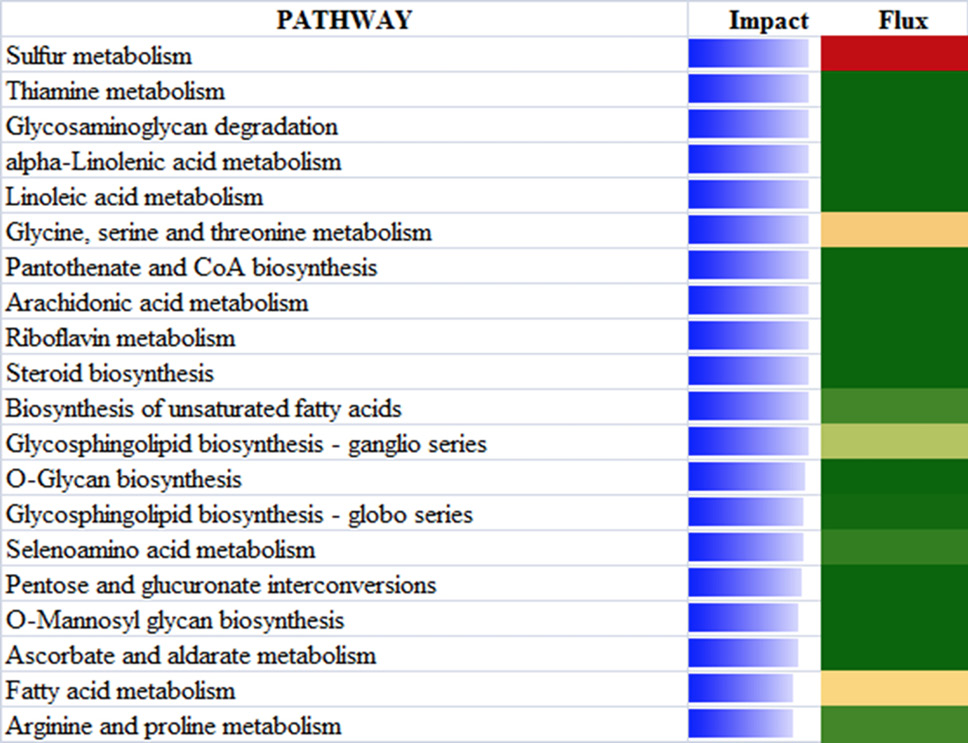
Results of flux and impact uncovered by the dynamic impact approach (DIA) based on Kyoto Encyclopedia of Genes and Genomes (KEGG) Pathways database analysis of the bovine muscle transcriptome for each time comparison. Notes: Blue lines show the impact of each category and the corresponding subcategories (P value<0.05 and no fold change). The impact is represented by the horizontal blue bars (large the bar larger the impact). Flux represents the direction of each category and the corresponding subcategory (green color, inhibition; yellow, stable; red color, activation, with different color intensities according to the level of up-regulation or down-regulation).

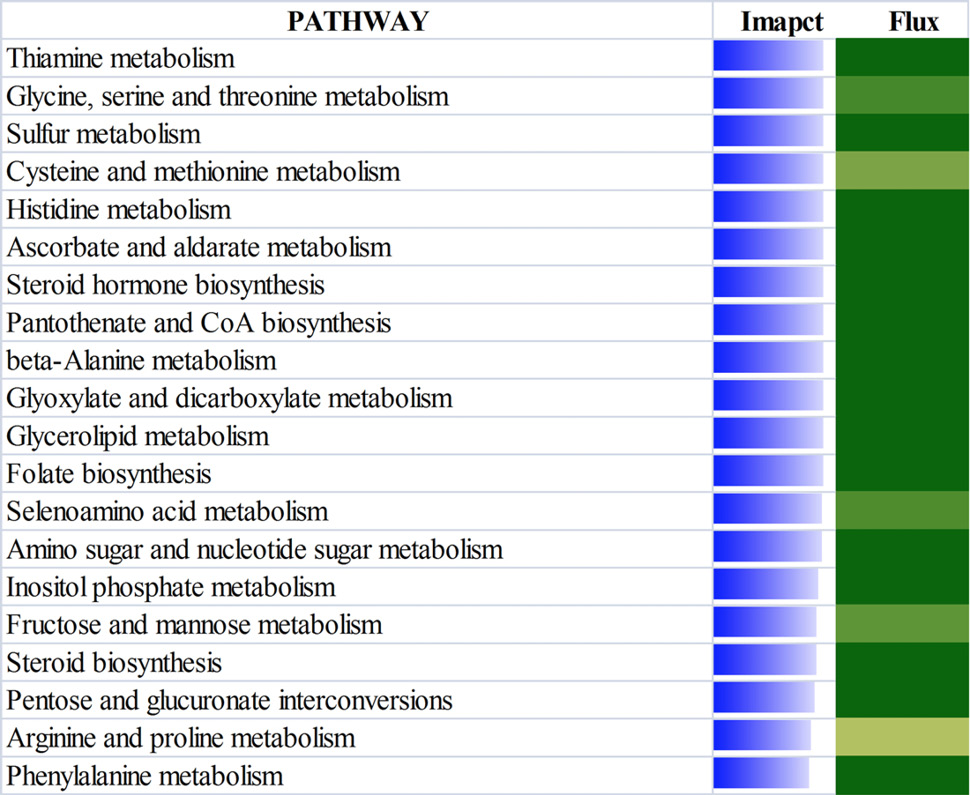
The top 20 most affected metabolic Kyoto Encyclopedia of Genes and Genomes pathways ranked by overall effect value in adipose tissues of beef cattle on comparison of 18 vs 24. The transparent bars represent the effect values (0 to 50), flux represents the direction of each category and the corresponding subcategory (green color, inhibition; yellow color, stable; red color, activation, with different color intensities according to the level of upregulation or downregulation).
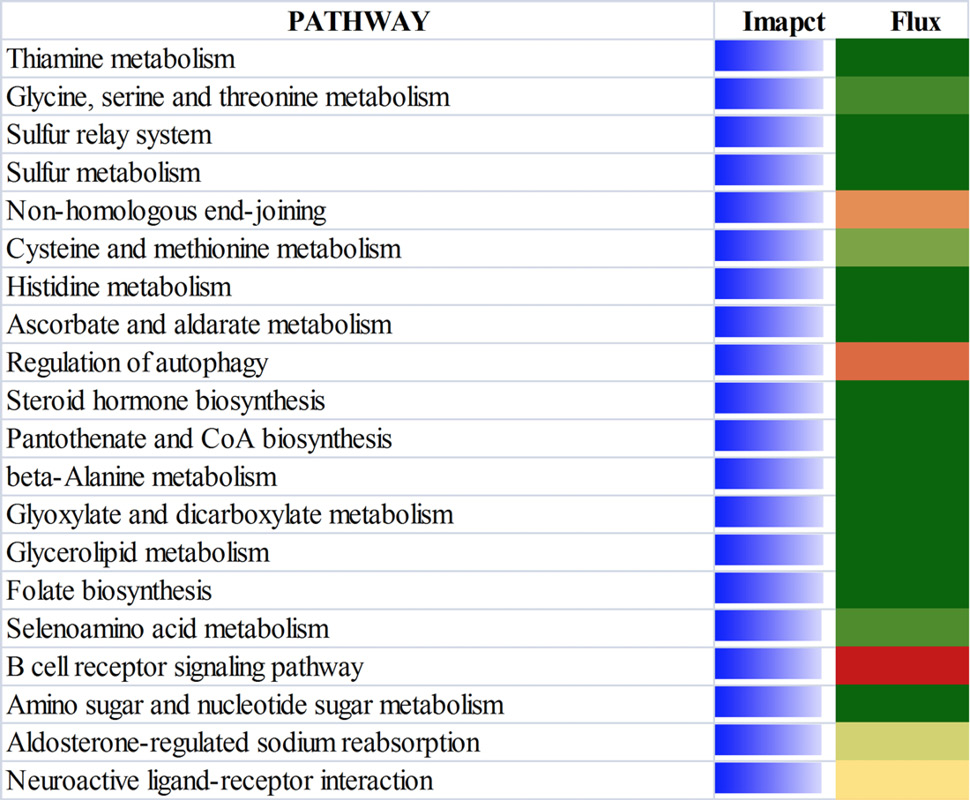
The top 20 most affected metabolic Kyoto Encyclopedia of Genes and Genomes pathways ranked by overall effect value in adipose tissues of beef cattle on comparison of 18 vs 30. The transparent bars represent the effect values (0 to 50), flux represents the direction of each category and the corresponding subcategory (green color, inhibition; yellow color, stable; red color, activation, with different color intensities according to the level of upregulation or downregulation).
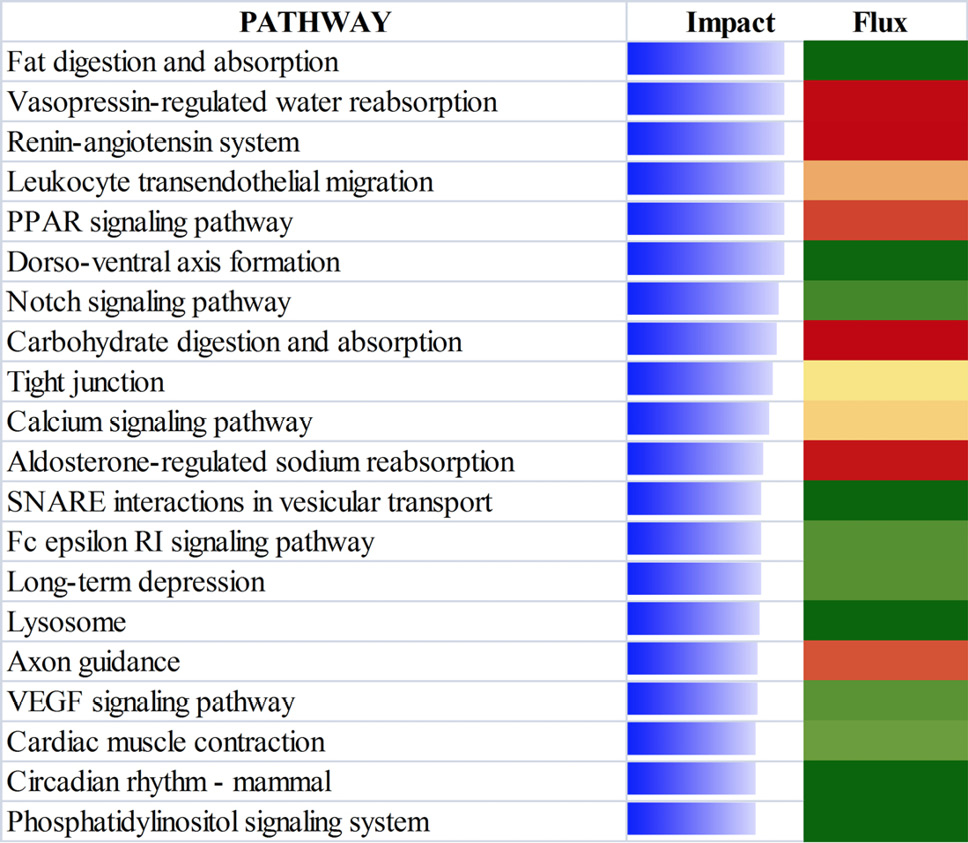
The top 20 most affected non metabolic Kyoto Encyclopedia of Genes and Genomes pathways ranked by overall effect value in adipose tissues of beef cattle on comparison of 18 vs 24. The transparent bars represent the effect values (0 to 50), flux represents the direction of each category and the corresponding subcategory (green color, inhibition; yellow color, stable; red color, activation, with different color intensities according to the level of upregulation or downregulation).
The top 20 most affected non metabolic Kyoto Encyclopedia of Genes and Genomes pathways ranked by overall effect value in adipose tissues of beef cattle on comparison of 18 vs 30. The transparent bars represent the effect values (0 to 50), flux represents the direction of each category and the corresponding subcategory (green color, inhibition; yellow color, stable; red color, activation, with different color intensities according to the level of upregulation or downregulation).
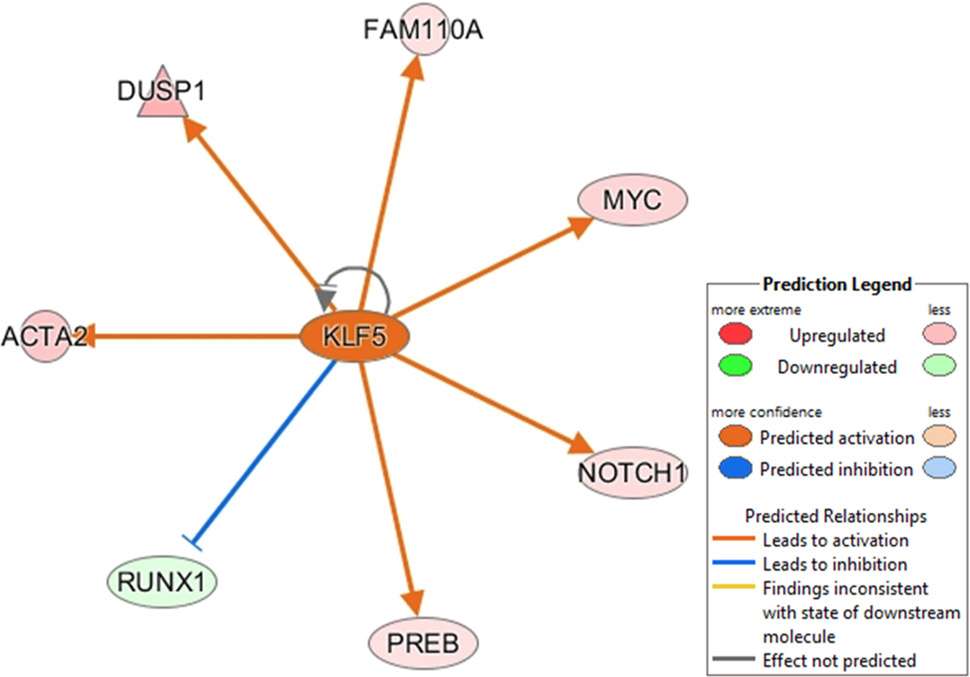
Ingenuity Pathway upstream network analysis of differentially expressed genes (DGE) between 18 vs 24 of beef cattle.
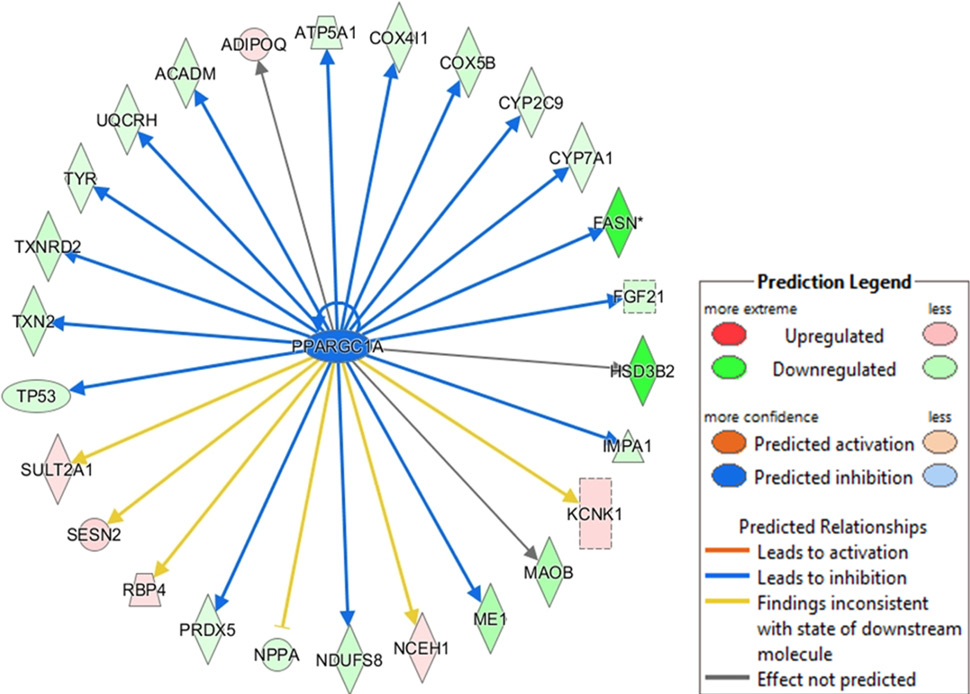
Ingenuity pathway upstream network analysis of differentially expressed genes (DGE) between 18 vs 30 of beef cattle.


