
Atrazine Induced Histopathological Alterations in the Liver of Adult Male Mice


Atrazine Induced Histopathological Alterations in the Liver of Adult Male Mice
Sajida Batool1, Saira Batool1, Sitara Shameem1, Fatima Khalid1, Tahira Batool2, Summera Yasmeen1, Saima Batool3*

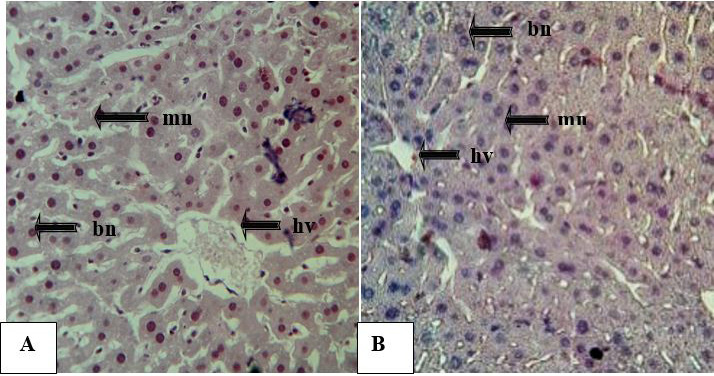
Photomicrographs from representing sections of the liver of Cnt and ATZ treated groups (H and E staining at 400×). Cnt: (A) liver exhibited a well-organized structure of trabeculae radiating from hepatic veins (hv) having mononucleated (mn) and binucleated (bn) hepatocytes separated by regular sinusoidal spaces (ss). ATZ treated group (B): liver showed the disorganized structure of trabeculae arising from the hepatic vein (hv) with deformed shape mononucleated hepatocytes (mn), binucleated hepatocytes with swollen nuclei (bn), cellular degeneration (cd), dilated sinusoidal spaces (ss), hollow and necrotic nuclei (nn) were also observed in the treated liver.
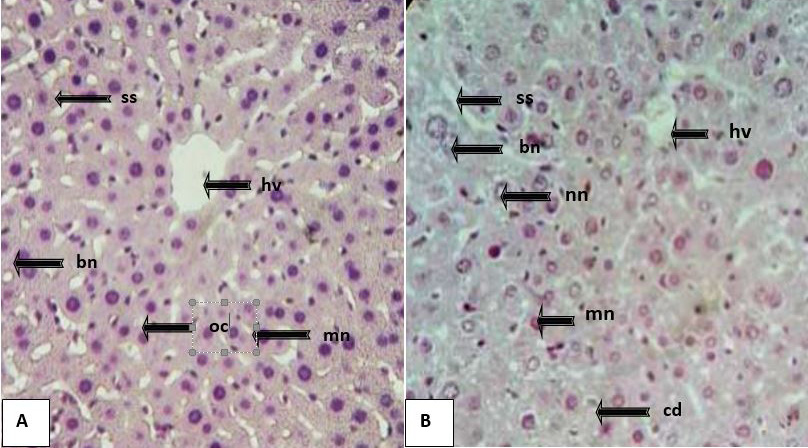
Photomicrographs of liver sections of Cnt and ATZ treated groups, showing distribution, size and nuclear structure of the hepatocytes (HandE staining at 400×).Cnt (A) showed well-oriented mono (mn) and binuclear hepatocytes (bn) of similar size and regular shape, nuclei darkly stained with condensed chromatin. ATZ (B) treated sections revealed a decreased number of mono (mn) and binuclear (bn) hepatocytes of variable size, mostly of deformed shape. Normal liver showed compact hepatic vein (hv) while treated liver showed narrow irregular hepatic vein (hv). Sections of ATZ treated group also revealed vacuolization in the hepatocytes.

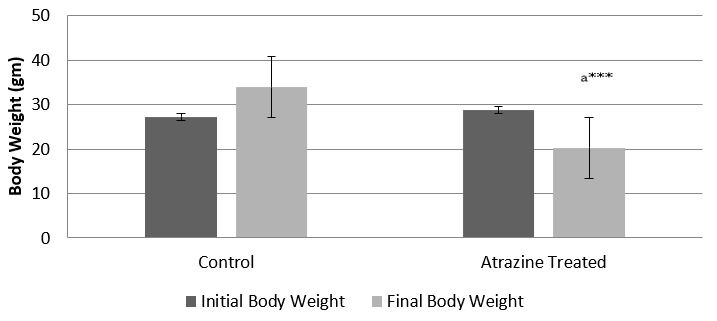
Mean body weight of male albino mice belonging to Cnt and ATZ treated groups. Values are expressed in Mean ± SEM. a=Cnt group vs ATZ treated group. ***p ˂ 0.001.

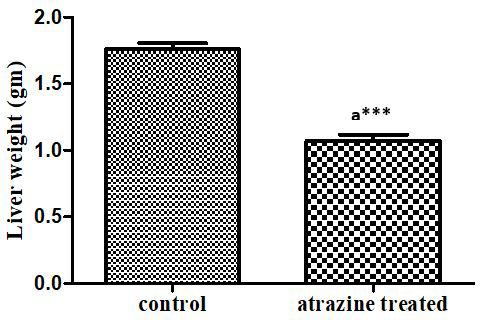
Effect of atrazine treatment (200 mg/kg) for 28 days on male albino mice’s mean liver weight. Data represented as mean of 10 mice ±SE, a = Cnt vs atrazine treated group, ***p ˂ 0.001.

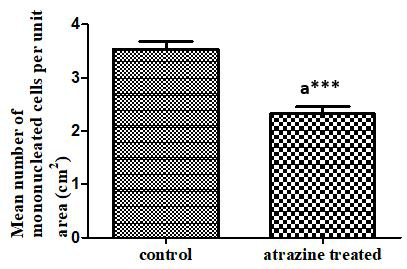
Alteration in the mean number of mononucleotide cells per unit area in the liver of atrazine treated male albino mice after 28 days of exposure at a dose of 200 mg/kg. Data represented as mean of 10 mice ±SE, a = Cnt vs ATZ group, ***p ˂ 0.001.

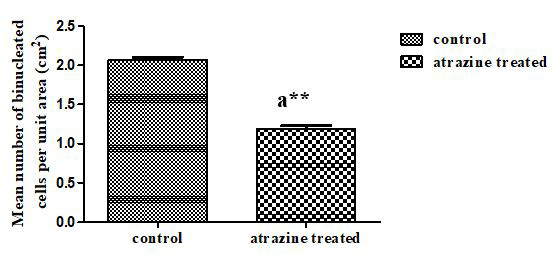
Mean number of binucleated cells per unit area in the liver of Cnt and ATZ treated male albino mice. Data represented as mean of 10 mice ±SE, a = Cnt vs ATZ treated group, ***p ˂ 0.001.

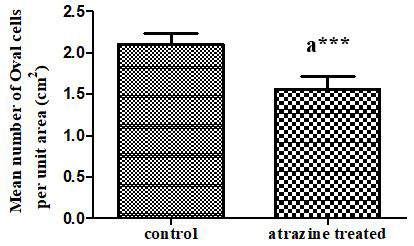
Effect of 4 weeks atrazine treatment on the mean number of oval cells per unit area in male albino mice’s liver. Data represented as mean of 10 mice ±SE, a = Cnt Vs ATZ treated group, ***p ˂ 0.001.

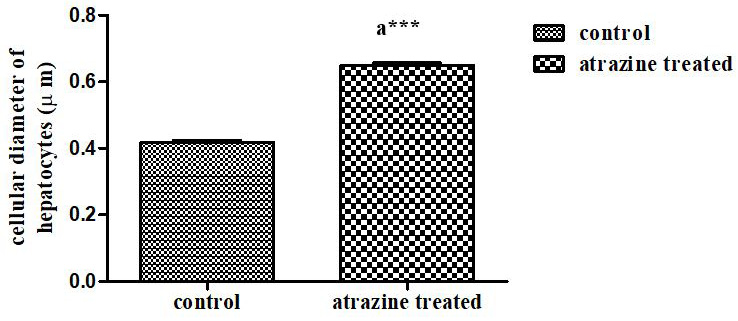
Cellular diameter of hepatocytes in the liver of Cnt and ATZ treated albino mice. Data represented as mean of 10 mice ±SE, a = Cnt vs ATZ treated group, ***p ˂ 0.001.

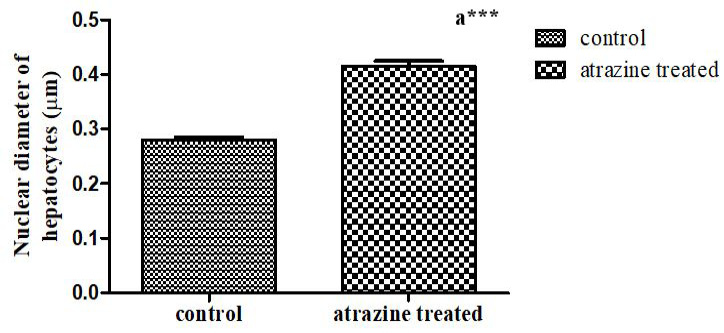
Effect of ATZ treatment (200mg/kg for 28 days) on the mean nuclear diameter of hepatocytes in male albino mice’s liver. Data represented as mean of 10 mice ±SE, a = CntvsATZ treated group, ***p ˂ 0.001.

