Assessment of Genetic Parameters, Agro-Morphologic Stability and Clustering Pattern of Promising Candidate Basmati Rice (Oryza sativa L.) Lines
Zulqarnain Haider1*, Muhammad Akhter2, Syed Sultan Ali1, Tahir Latif1, Rana Ahsan Raza Khan1, Awais Riaz1, Tahira Bibi1, Muhammad Ijaz3, Qasim Raza1, Mohsin Ali Raza4, Samina Sarfaraz1, Muhammad Iqbal1 and Muhammad Rafiq1
1Department of Plant Breeding and Genetics, Rice Research Institute, Kala Shah Kaku, Lahore, Pakistan; 2Ayub Agricultural Research Institute, Faisalabad, Pakistan; 3Department of Plant Breeding and Genetics, Rice Research Station, Bahawalnagar, Pakistan; 4Department of Rice Technology, Rice Research Institute, Kala Shah Kaku, Lahore, Pakistan.
*Correspondence | Zulqarnain Haider, Scientific Officer, Department of Plant Breeding and Genetics, Rice Research Institute, Kala Shah Kaku, 17 km GT road, Shahdara, Lahore, Pakistan; Email: z.haider.breeder@gmail.com
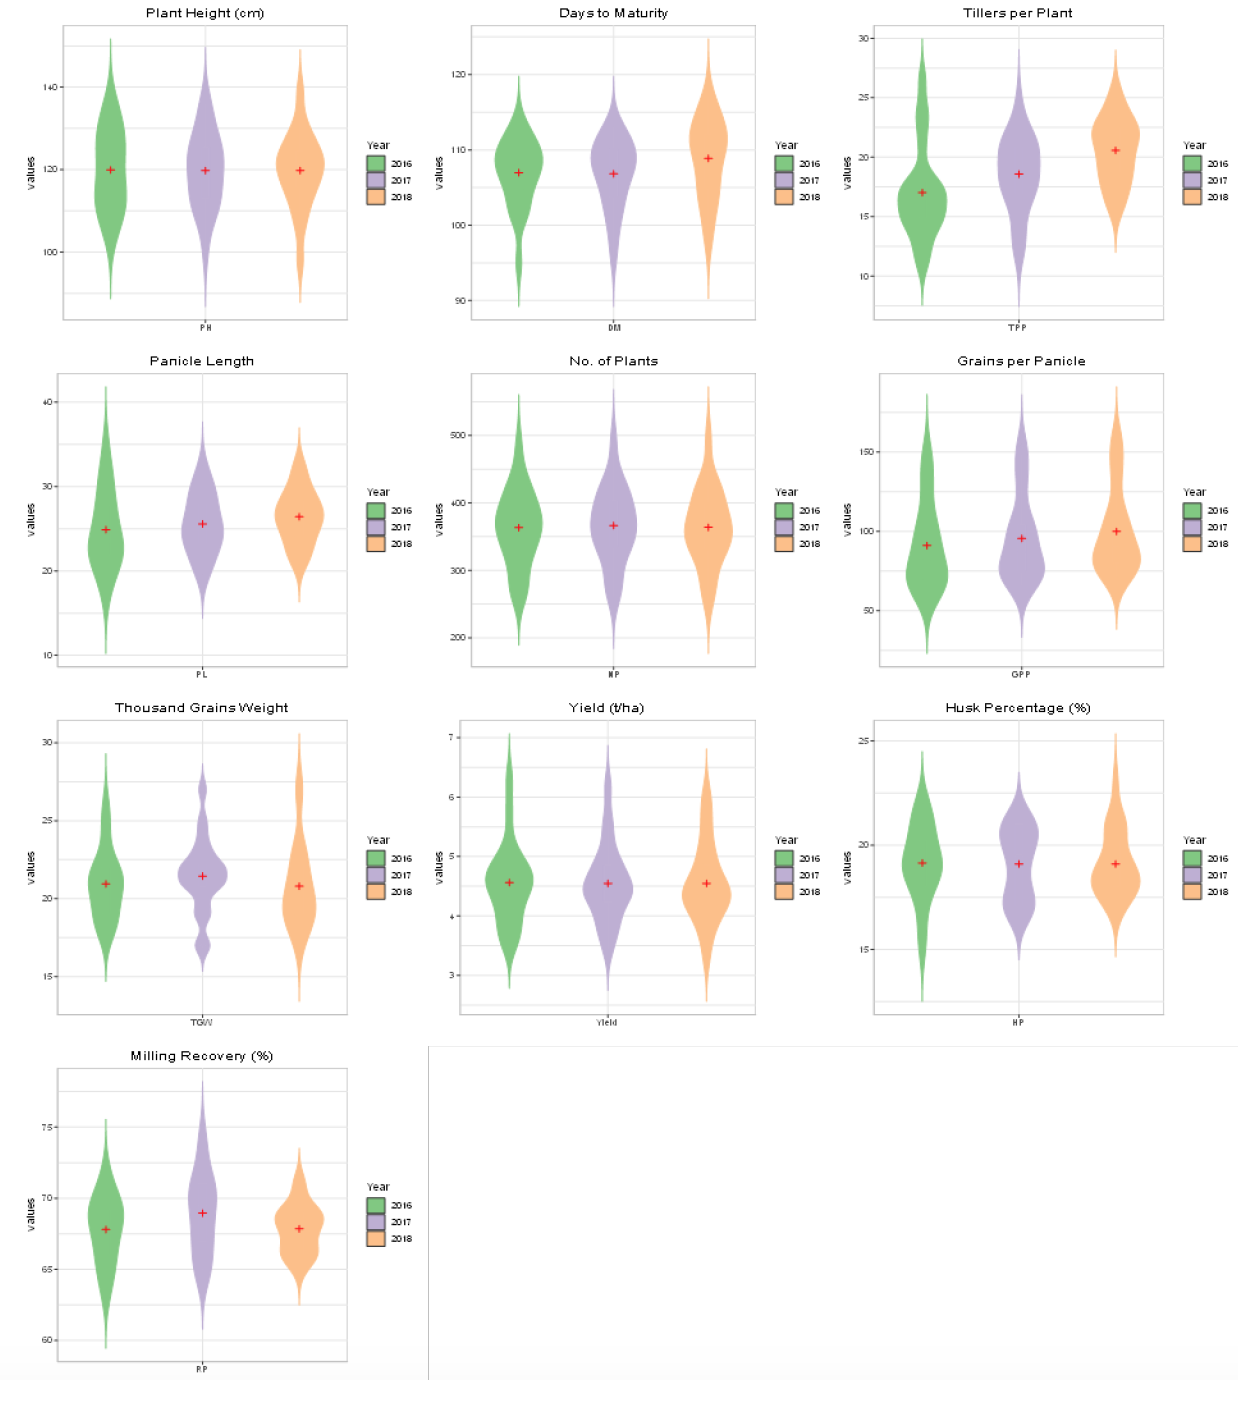
Figure 1 (a – j):
Violin plots depicting frequency distribution of all the genotypes / promising lines for studied traits during three years 2016, 2017 and 2018 represented with different colors in each plot.
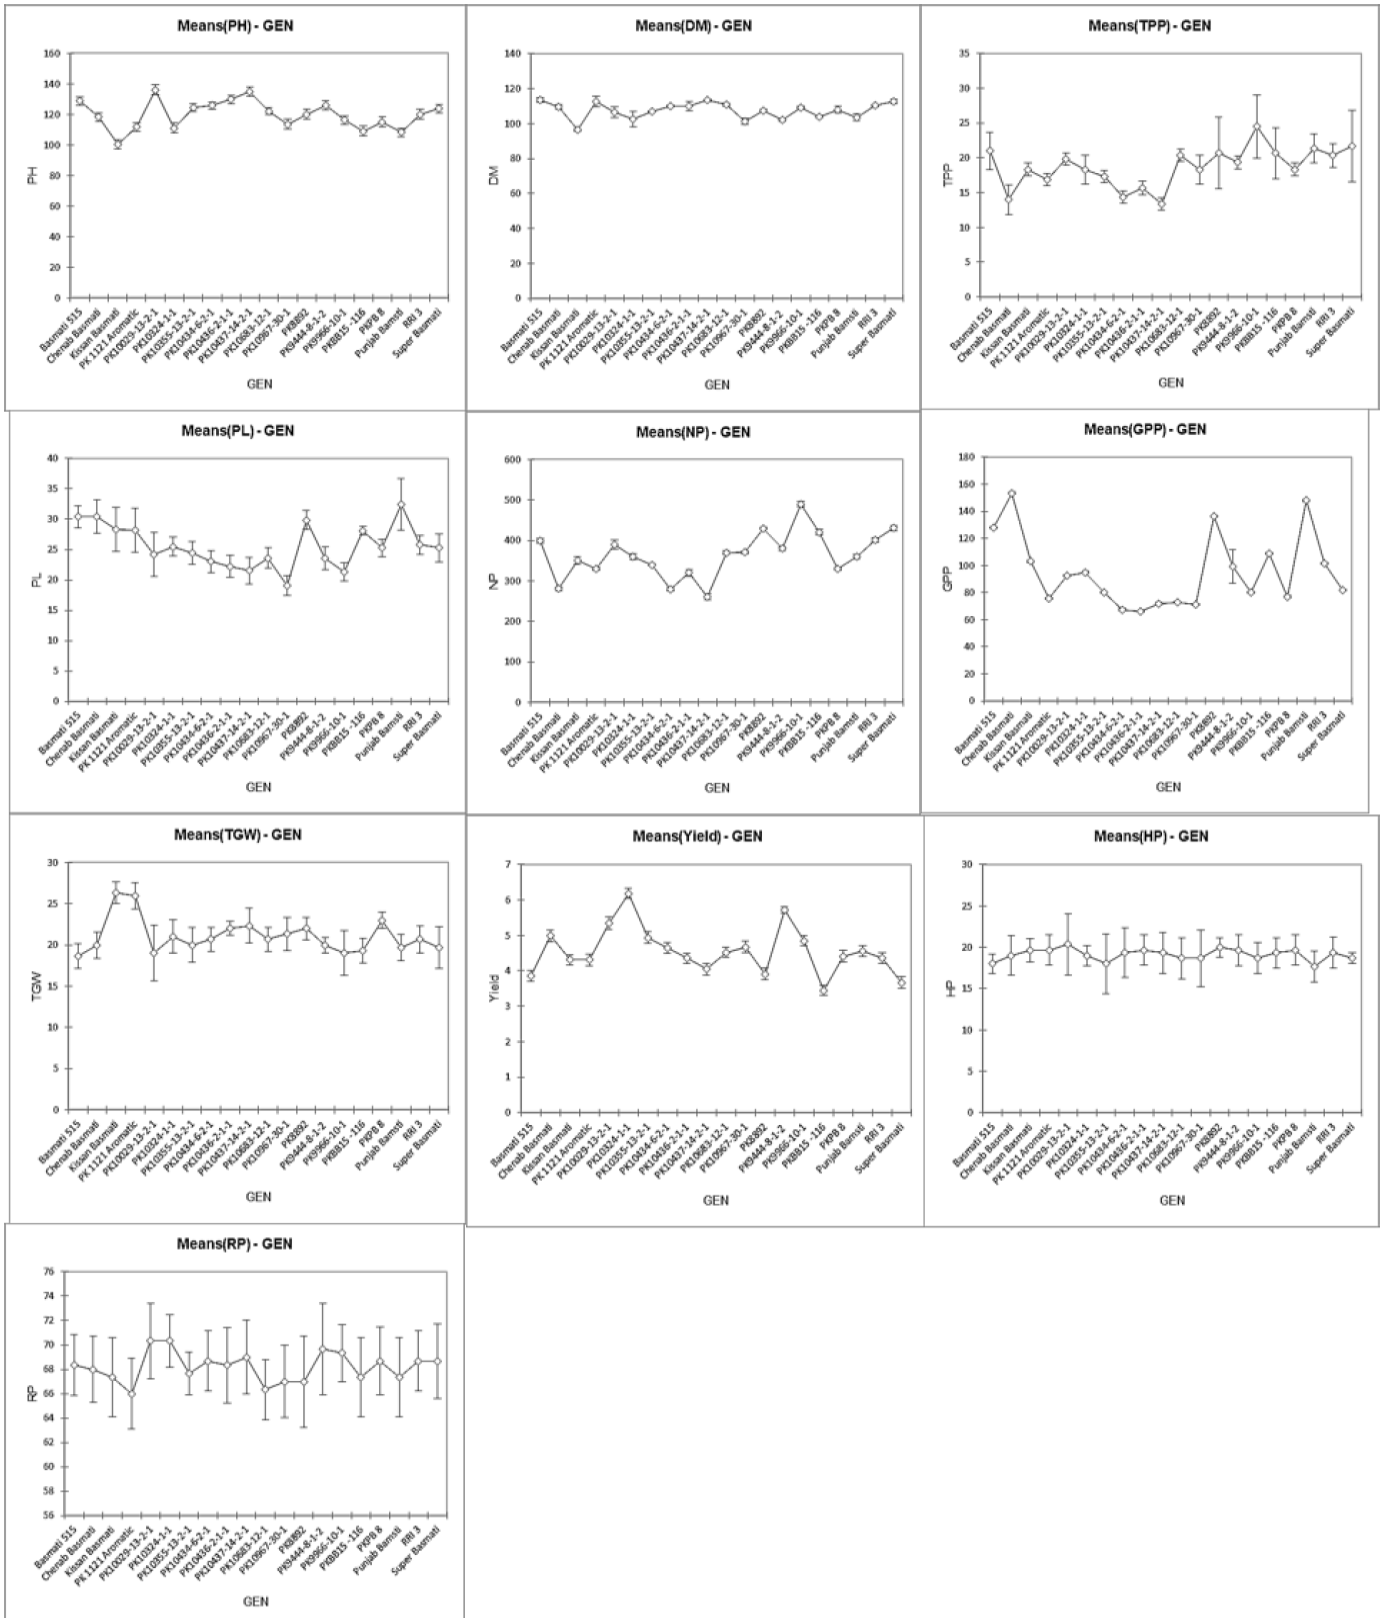
Figure 2:
Stability and mean performances of promising lines in three years 2016, 2017 and 2018 for the studied traits.
PH: Plant height; DM: Days to maturity; NTP: Number of tillers per plant; NP: Number of panicles per plant; NGP: Number of grains per panicle; PL: Panicle length; TGW: Thousand grain weight; GY: Grain yield; HP: Husk percentage; RP: Milling recovery percentage.
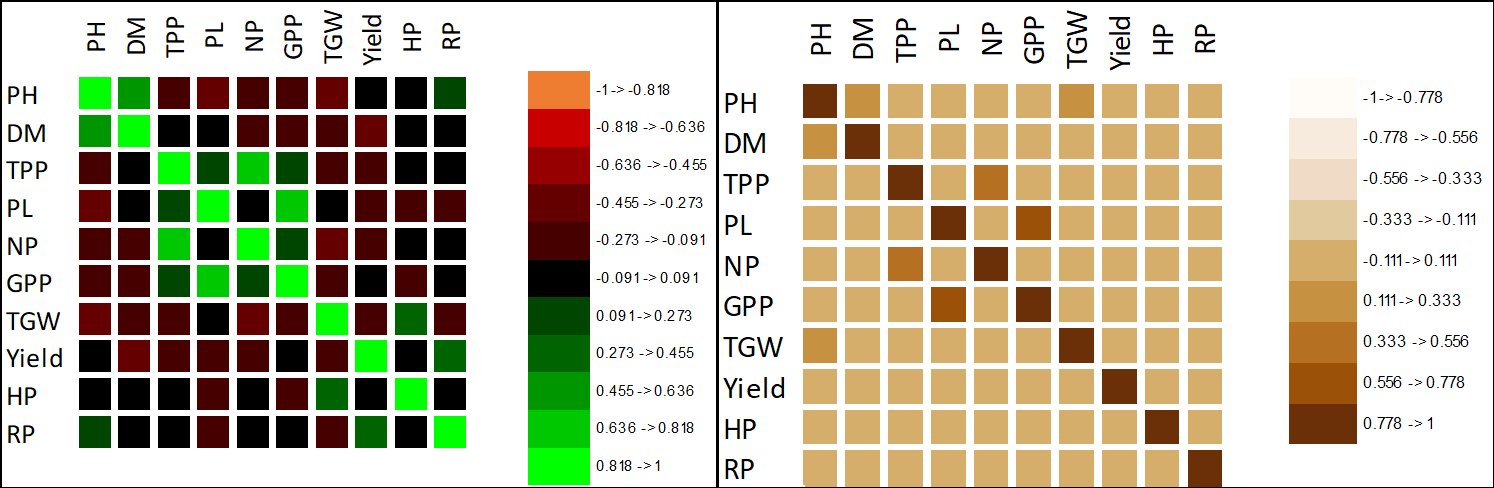
Figure 3 (a, b):
Diagrams are showing correlations and coefficients of determinations matrix within studied agronomic and physiological yield related traits. Level of significance was adjusted at 5%.
PH: Plant height; DM: Days to maturity; NTP: Number of tillers per plant; NP: Number of panicles per plant; NGP: Number of grains per panicle; PL: Panicle length; TGW: Thousand grain weight; GY: Grain yield; HP: Husk percentage; RP: Milling recovery percentage.
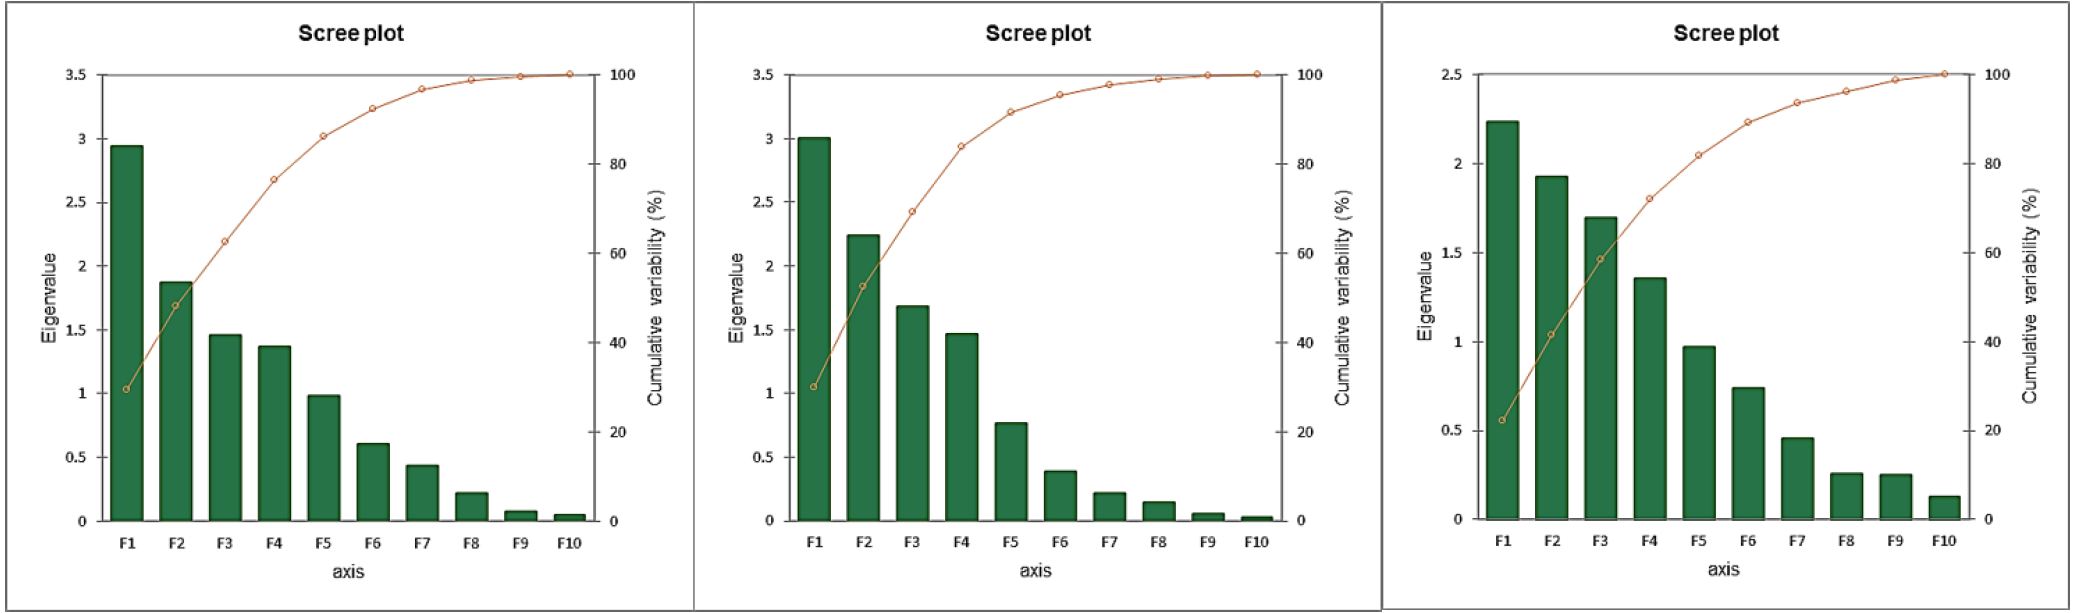
Figure 4:
Eigenvalues of all components in PCA for all the three years (left to right) indicating the proportions of total variance attributed to studied ten traits in target genotypes.
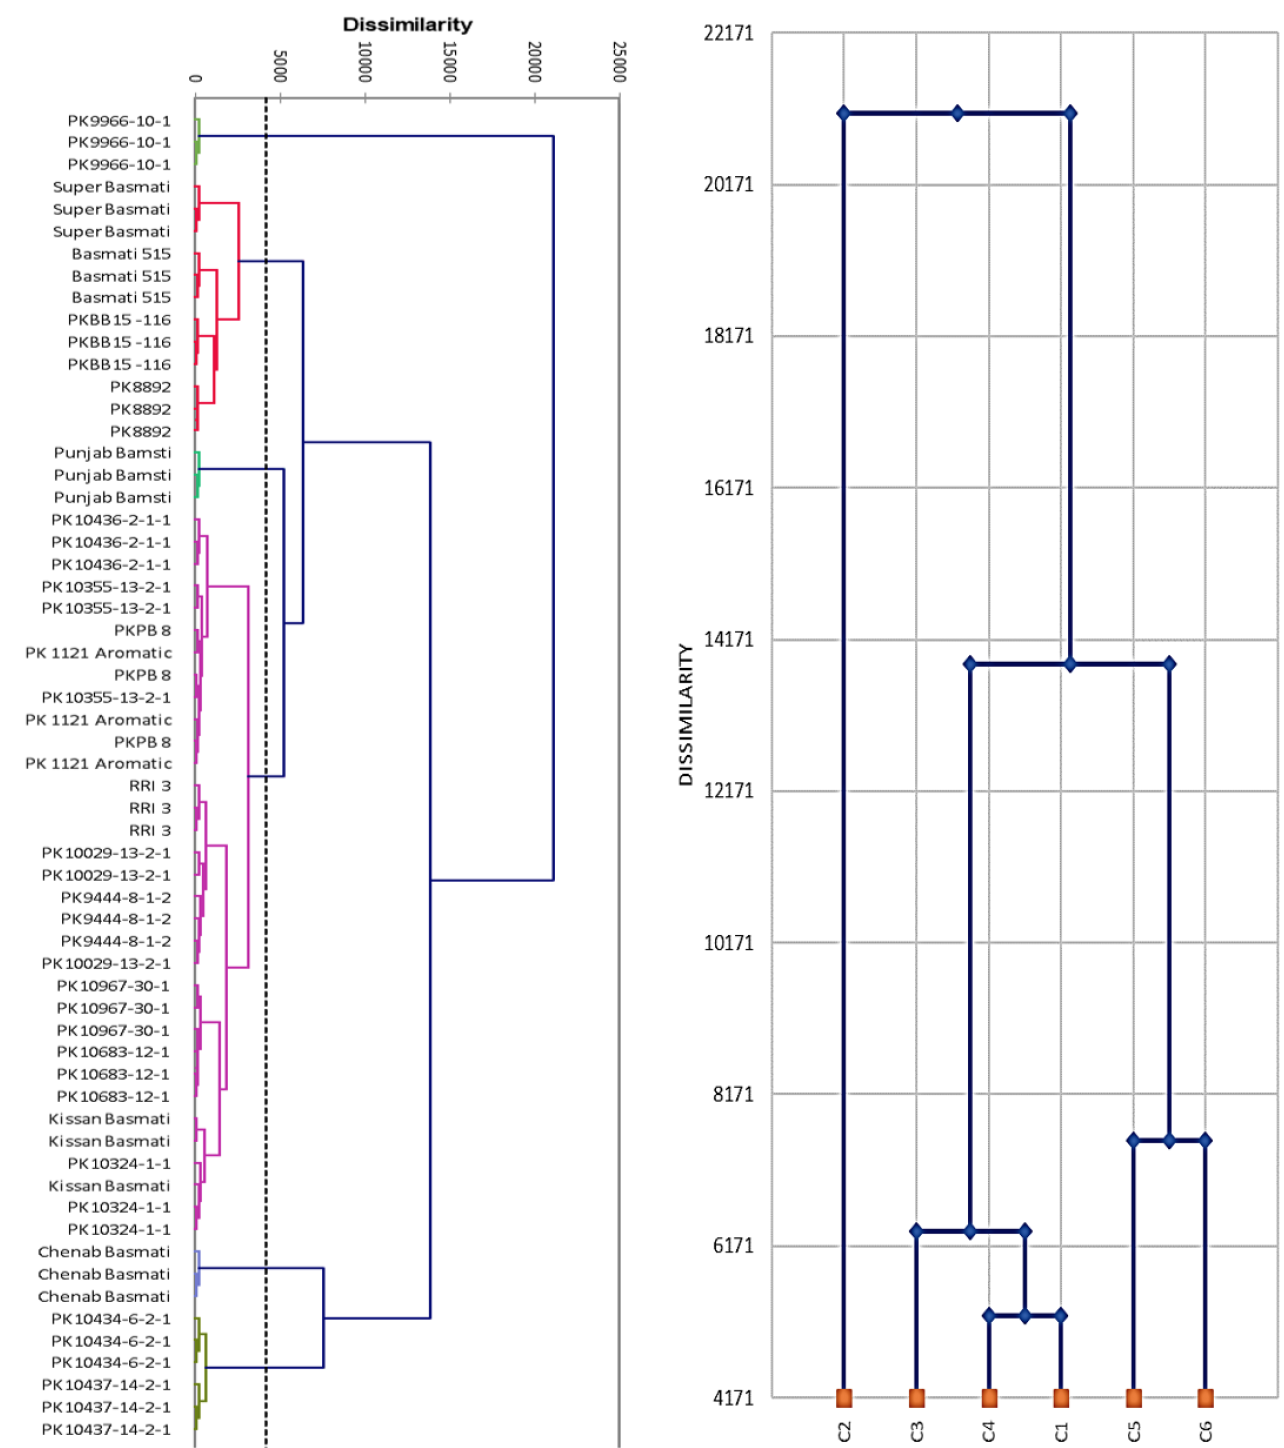
Figure 6:
dendrogram or Clustering of genotypes / promising lines studied in three consecutive years from 2016 to 2018 for ten morphological traits related to yield.
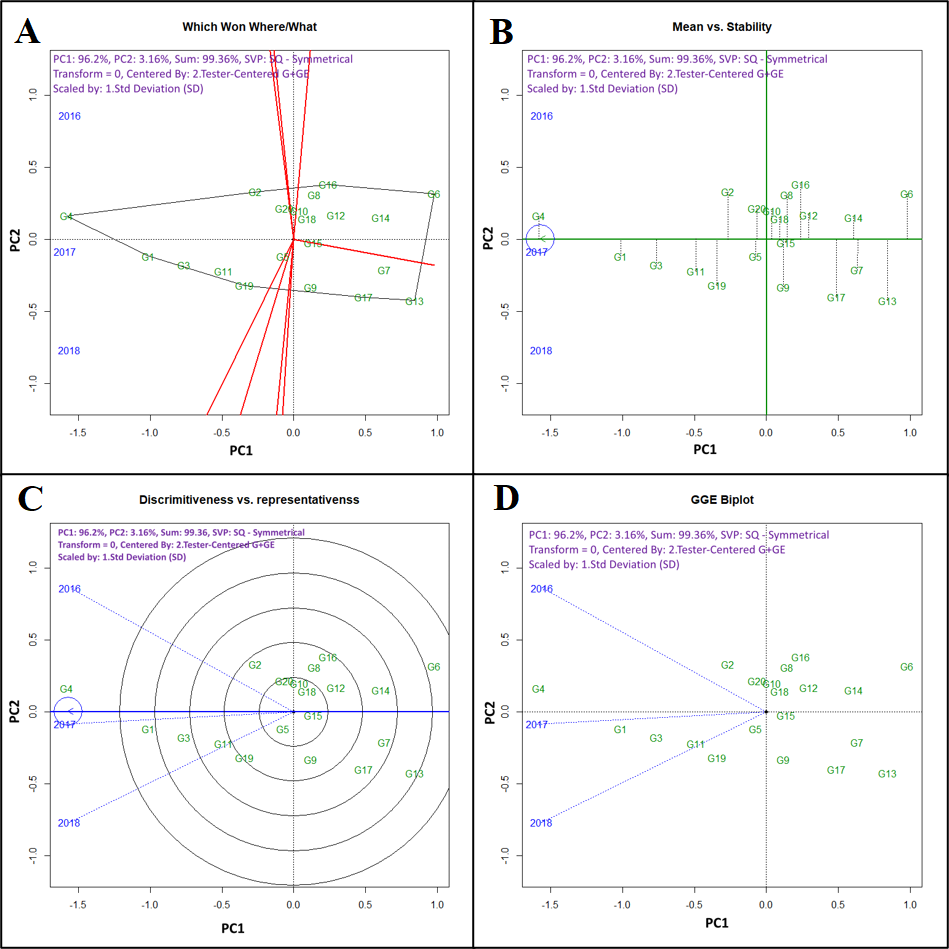
Figure 7:
(A) Mega-environment (which-won-were/what) analysis (B) mean performance and stability of genotypes (C) test-environment (discrimitiveness and representativeness) and (D) cumulative biplot analysis views based on GY data of investigated genotypes.
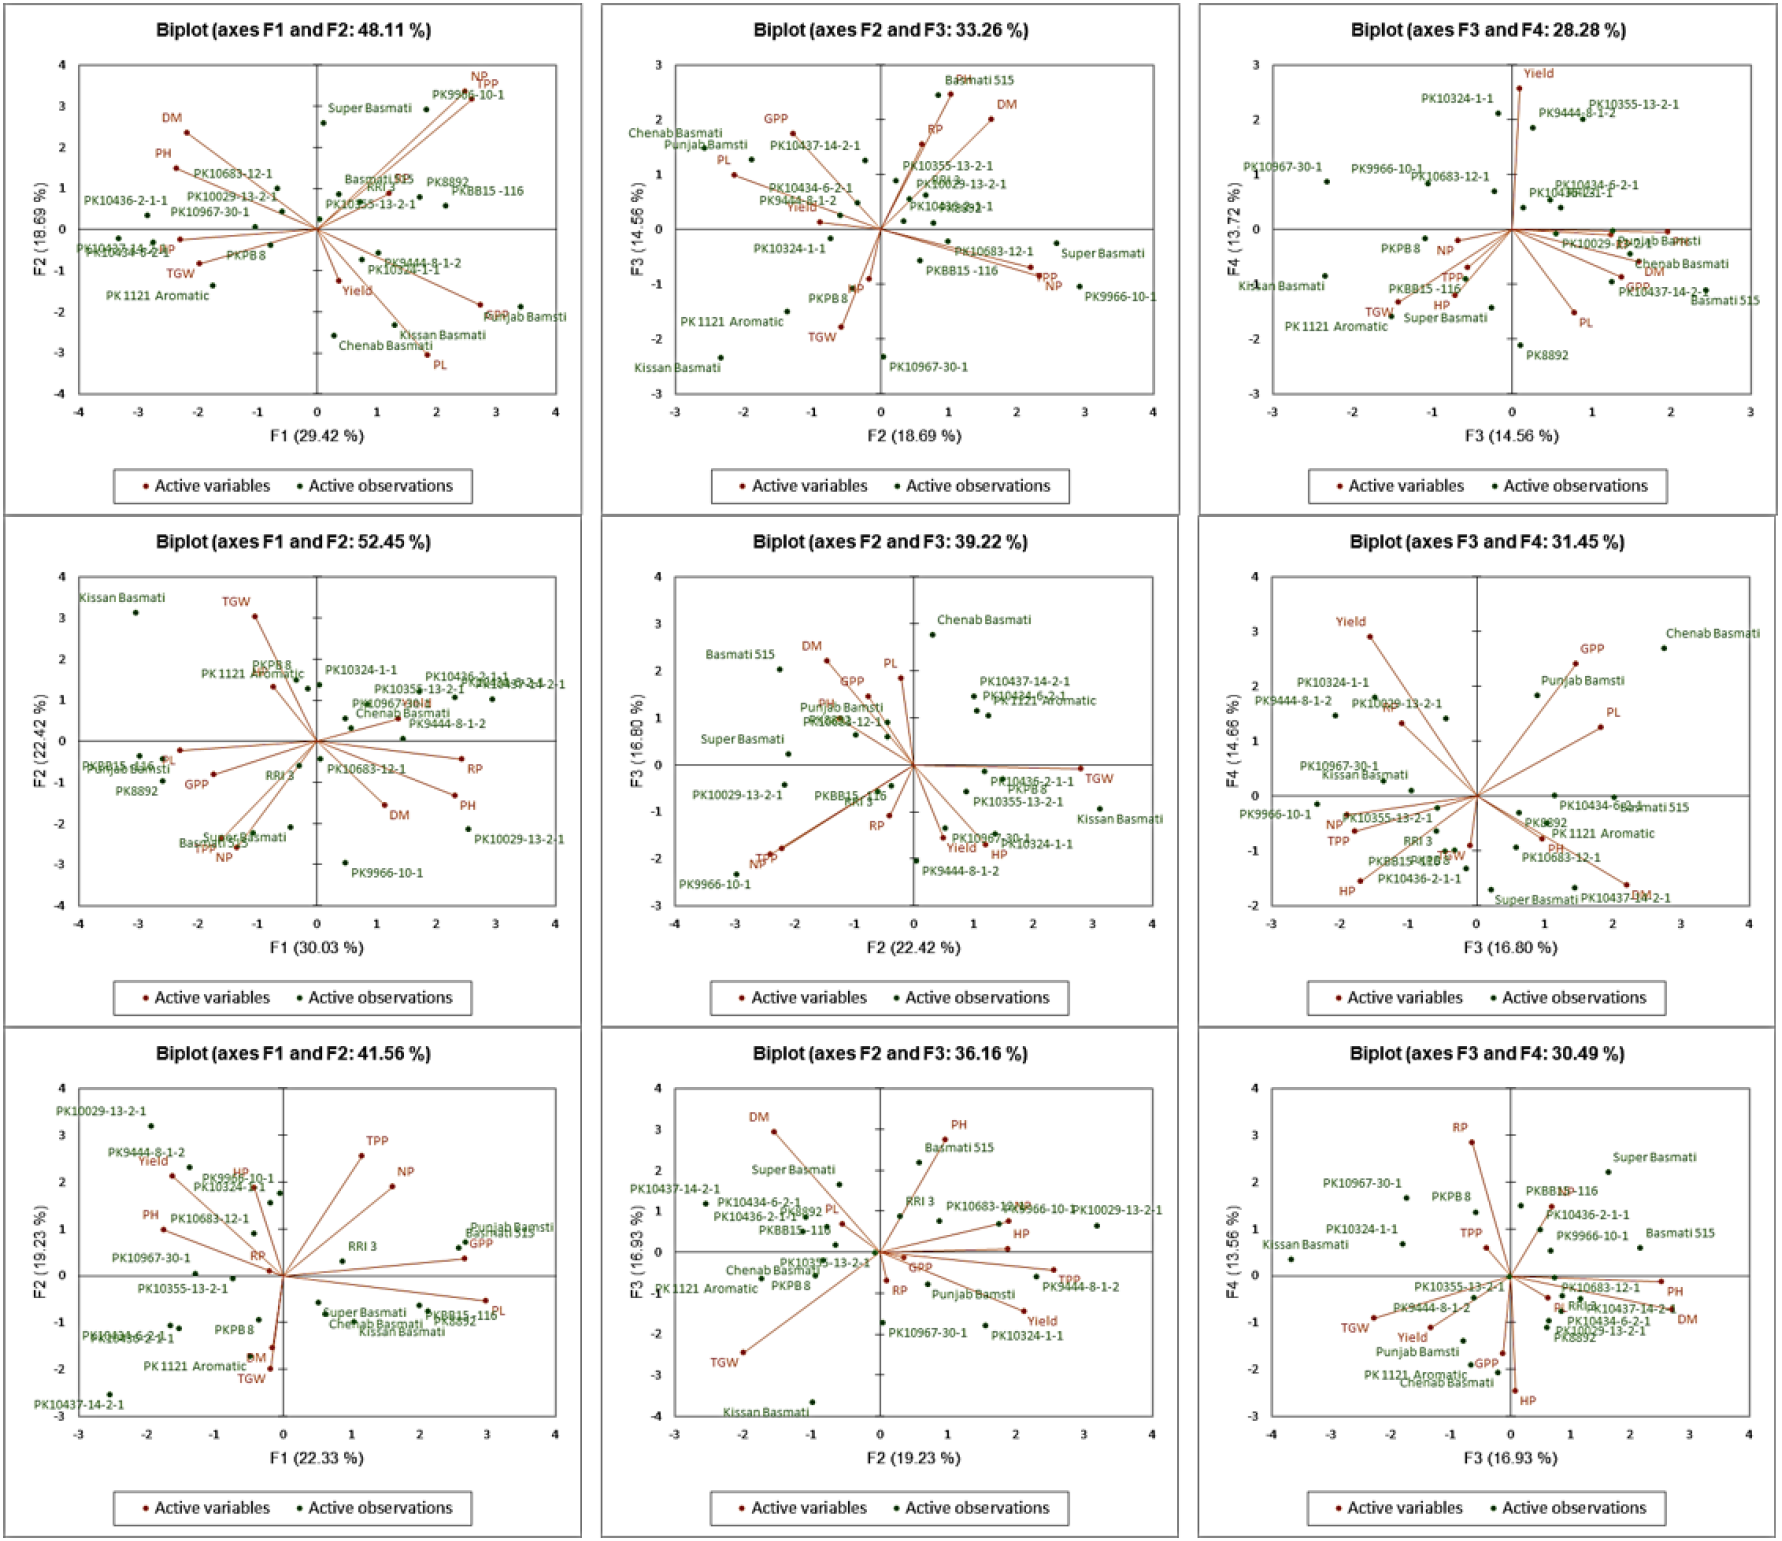
Figure 5 (a – i):
Results of principal component analyses (PCA) of ten morphological and yield components in the studied promising rice lines.
PH: Plant height; DM: Days to maturity; NTP: Number of tillers per plant; NP: Number of panicles per plant; NGP: Number of grains per panicle; PL: Panicle length; TGW: Thousand grain weight; GY: Grain yield; HP: Husk percentage; RP: Milling recovery percentage.


