
Analysis of Pesticide Residues in Pollen and Nectar Samples from Various Agricultural Areas of Pakistan through High Performance Liquid Chromatography


Analysis of Pesticide Residues in Pollen and Nectar Samples from Various Agricultural Areas of Pakistan through High Performance Liquid Chromatography
Mahnoor Pervez and Farkhanda Manzoor*

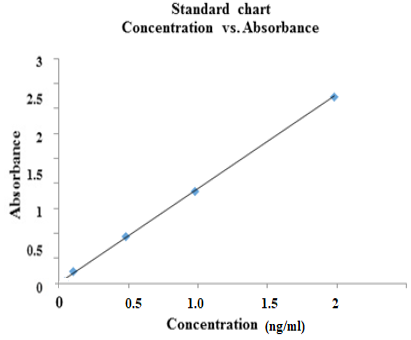
Standard curve between concentrations of pesticide standard and absorbance.
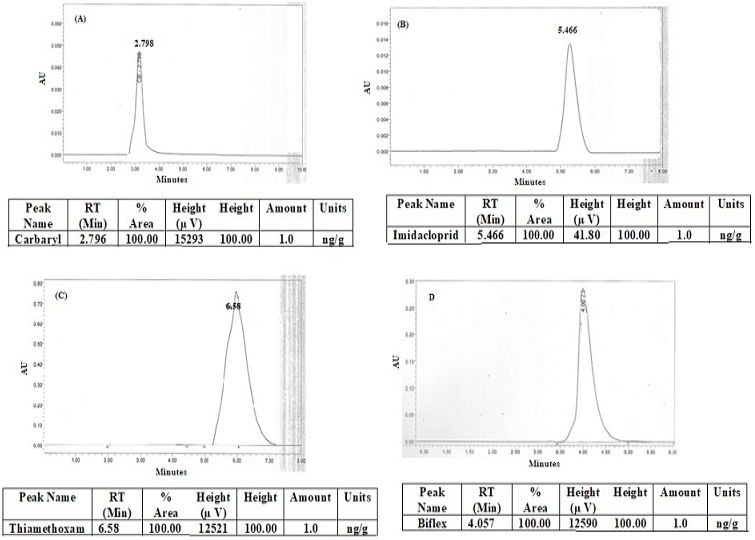
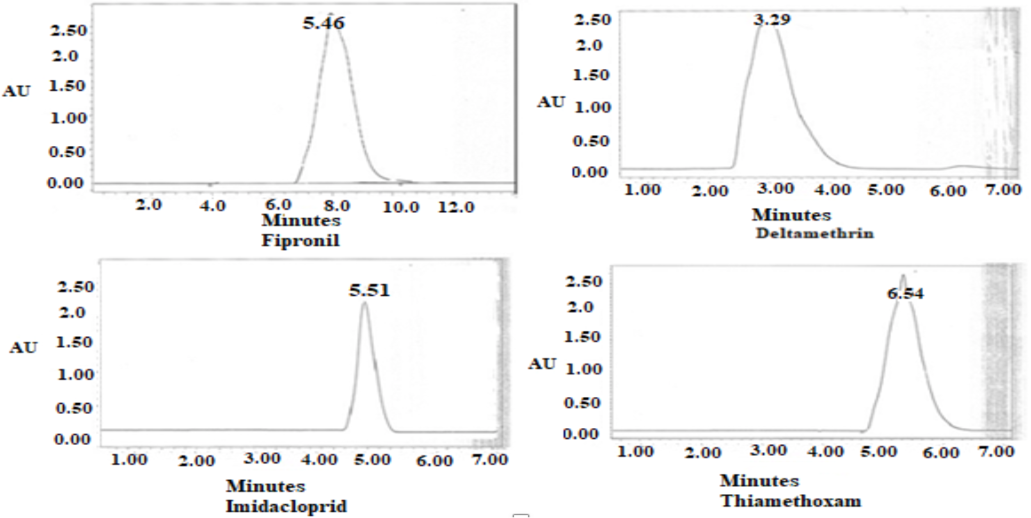
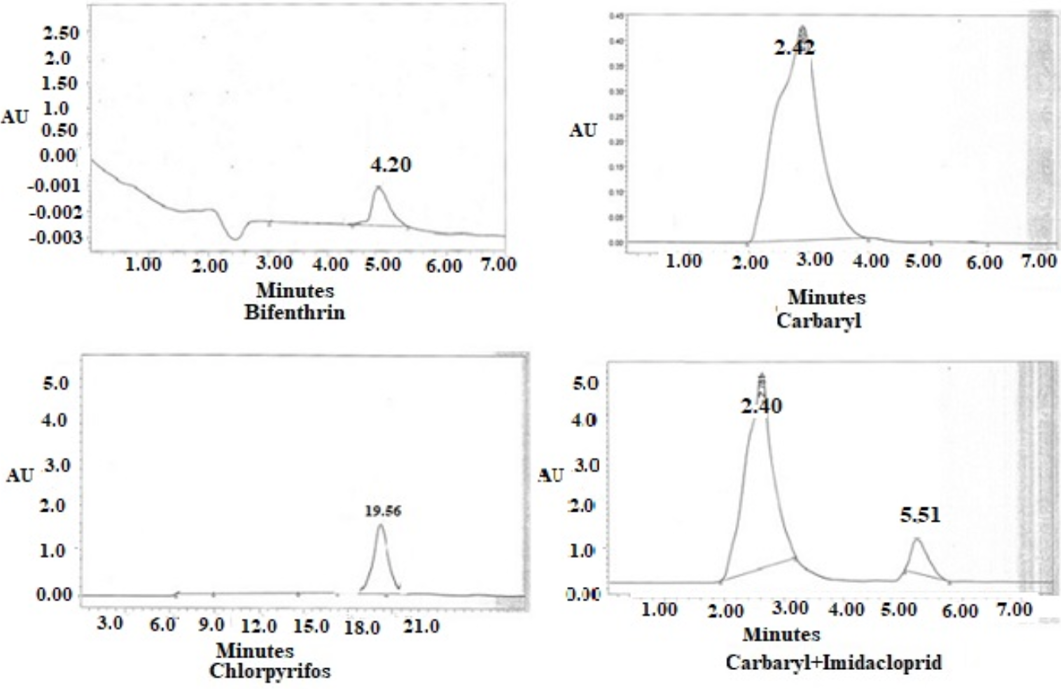
Chromatograms of technical grade standard carbaryl (A), imidacloprid (B), thiamethoxam (C) and bifenthrin (D).
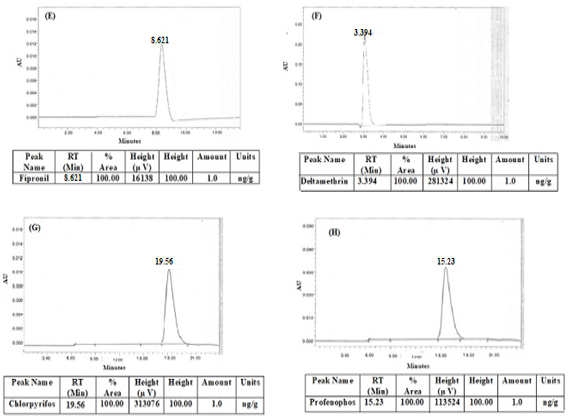
Chromatograms of technical grade standard fipronil (E), deltamethrin (F), chlorpyrifos (G) and profenophos (H).
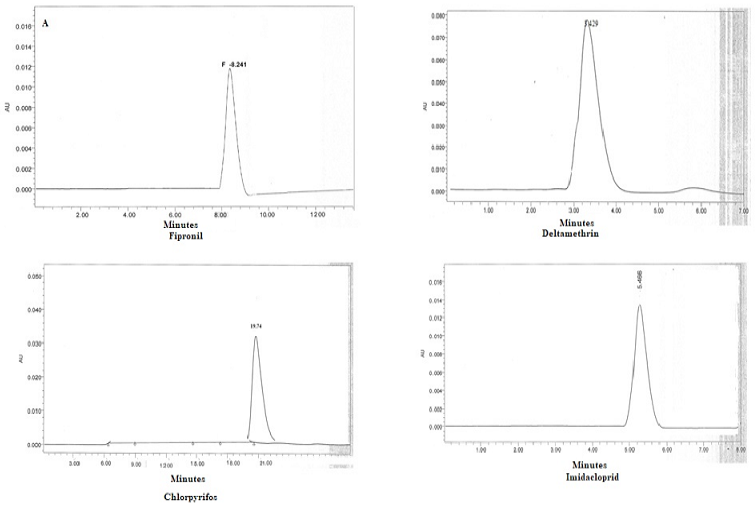
Chromatograms showing peaks of pesticide residues in pollen samples.
Chromatograms showing peaks of pesticide residues in pollen samples.
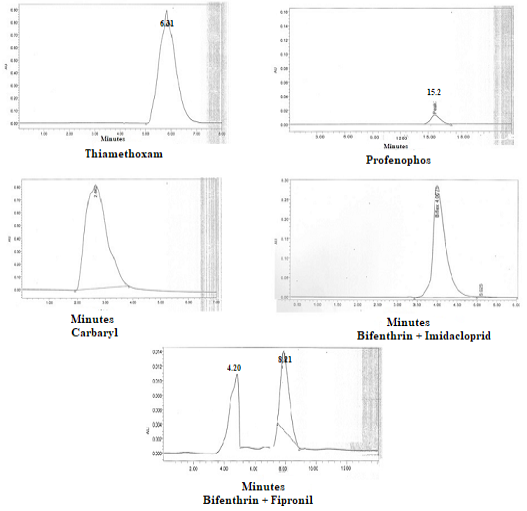
Chromatograms showing peaks of pesticide residues in nectar samples.
Chromatograms showing peaks of pesticide residues in nectar samples.
Box-plot comparison of pesticide residues detected in pollen samples through HPLC.

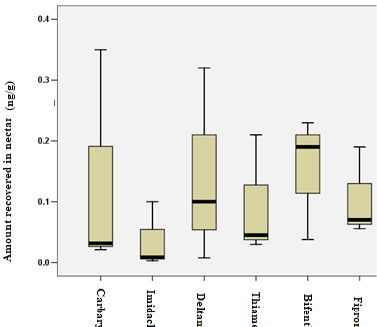
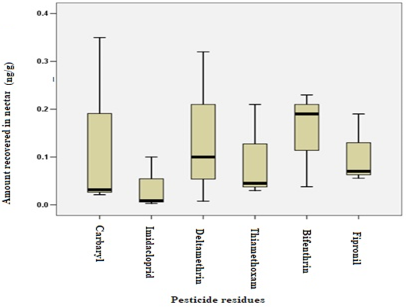
Box-plot comparison of pesticide residues detected in nectar samples through HPLC.


