

Alantolactone Inhibits A2780 Cell Growth through Glycolysis Inhibition and Ros-Induced Apoptosis and Overcomes Cisplatin Resistance


Alantolactone Inhibits A2780 Cell Growth through Glycolysis Inhibition and Ros-Induced Apoptosis and Overcomes Cisplatin Resistance
Chenchen Liu1,2, Tong Wang1, Muhammad Khan3*, Xiaolin Cui2 and Yongming Li1,2*
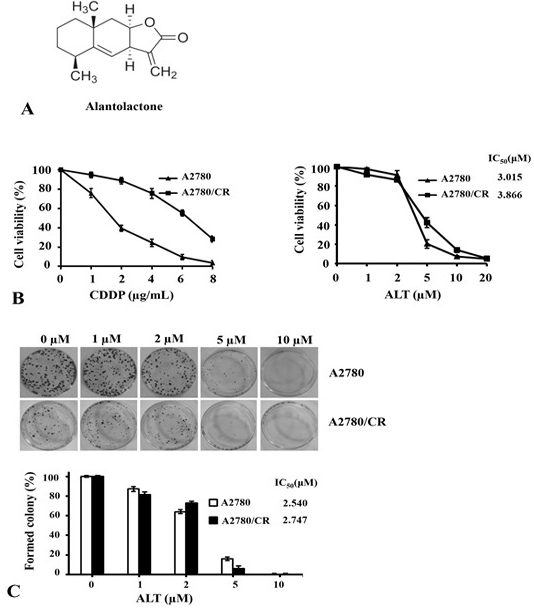
Effect of alantolactone on proliferation and growth of cisplatin sensitive (A2780) and cisplatin resistant (A2780/CR) ovarian cancer cells. (A) Chemical structure of alantolactone. (B) A2780 and A2780/CR cells were cultured and treated in 96 well plates in triplicates for 72 h. The cell proliferation was measured using CCK-8 assay kit. (C) A2780 and A2780/CR cells were plated in 6 well cell culture plates for 12 h. After treating the cells with indicated dose of ALT for 24 h, medium containing drug was removed and cells were washed. Drug-free medium was added and cells were cultured for 12 days. At the end, colonies were stained and quantified.

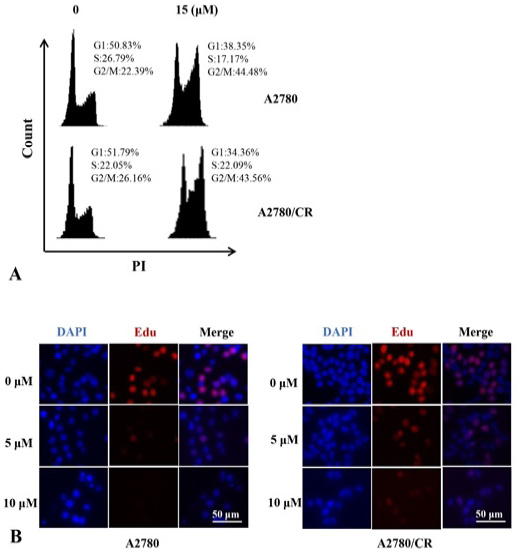
Effect of ALT on cell cycle progression and proliferation. (A) A2780 and A2780/CR cells were cultured in the presence or absence of ALT for 24 h. The cells were harvested and incubated with RNase A and PI. The cells were analyzed for cell cycle profile using flow cytometer. (B) Cells proliferation rates were analyzed by Edu cell proliferation assay. Blue cells stained with DAPI (left) indicate total number of cells, Red cells (middle) labelled with Edu are proliferating cells. In merge cell population, pink cells are proliferating cells.

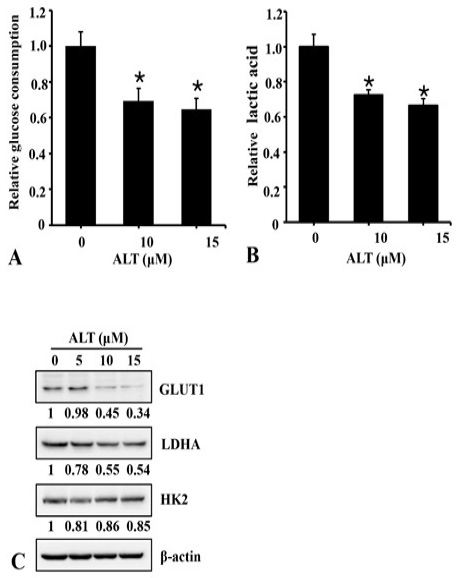
Effect of ALT on glucose and lactate level. A2780 cells were cultured and treated with ALT in 6 well plates for 24h. The culture media was collected and level of glucose (A) and lactate (B) was measured using commercially available kits. (C). A2780 cells were treated with ALT in a dose-dependent fashion for 24 h and expression of GLUT1, LDHA, HK2 and B-actin was measured from total cell lysate using Western blot. The numerical values below the immunoblots show the relative density of the band normalized to Beta actin from 3 repeated experiments.
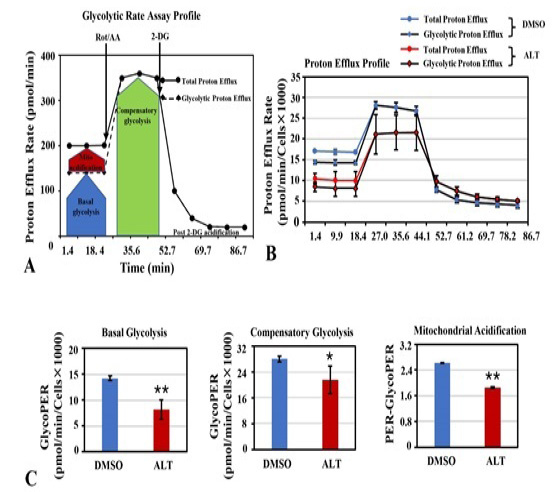
Analysis of glycolysis. (A) A schematic diagram of assay workflow showing proton efflux rate (PER) measured with glycolytic rate assay. (B) Comparison of total proton efflux rate and glycolytic proton efflux rates between DMSO treated and ALT treated A2780 cells. (C) Basal glycolysis, compensatory glycolysis and mitochondrial acidification was quantified as described in methodology.

ALT promotes apoptosis in A2780 (parental) and A2780/CR (Cisplatin resistant) cells. (A) A2780 and A2780/CR cells were cultured and exposed to ALT for 24 h. Apoptosis rates were determined using flow cytometry. (B) A2780 and A2780/CR cells were treated with ALT as shown in figure. The cellular extracts were subjected to immunoblotting for the expression of caspase-3, cleaved PARP, γH2AX and B-actin. The numerical values below the immunoblots show the relative density of the band normalized to Beta actin from 3 repeated experiments.

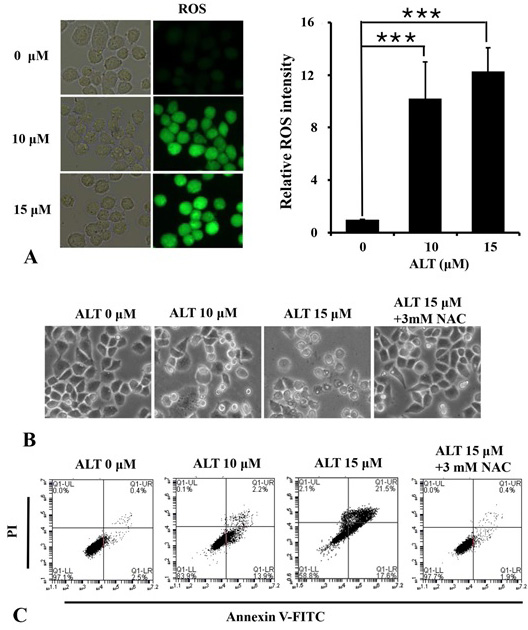
ALT induces apoptosis via ROS generation. (A) A2780 cells were stained with DCFHDA for 40 min following 6 h drug treatment as shown in figure. DCF fluorescence was checked using Leica DMi8 fluorescence microscope and images were captured. ROS intensity was analyzed using ImageJ (NIH) software. (B and C) A2780 cells were treated with ALT either pre-treated with NAC or un-treated with NAC and cell morphological changes (B) and apoptosis rates (C) were measured.

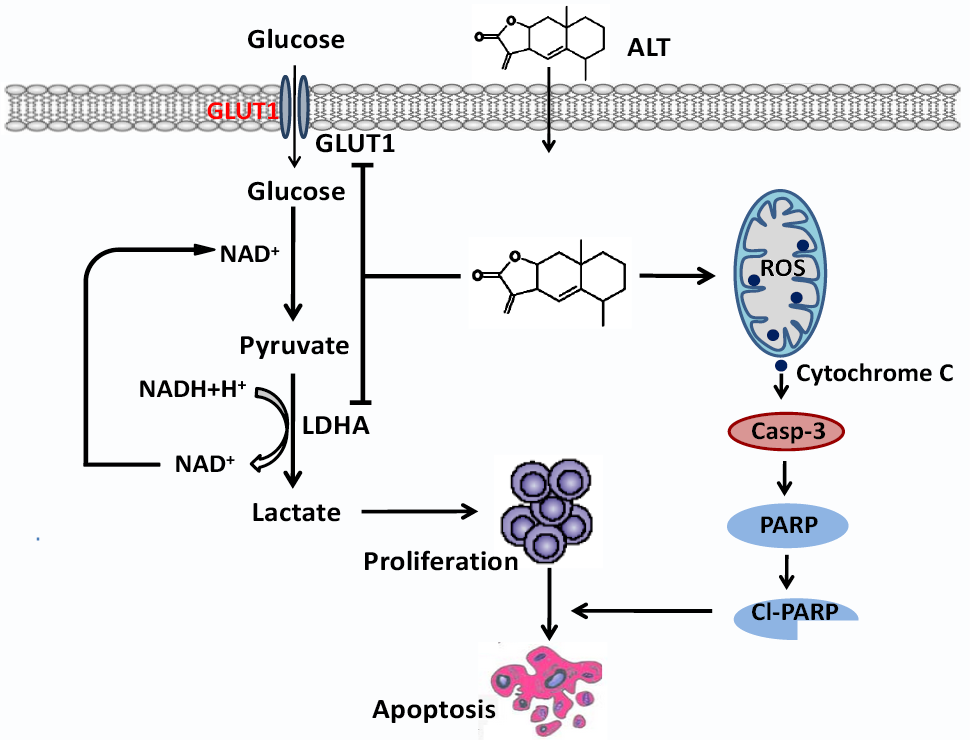
A schematic diagram showing the molecular mechanism of ALT-mediated apoptosis in human ovarian cancer cells.


