

A Comparative Study of Inhibitory Properties of Saponins (derived from Azadirachta indica) for Acetylcholinesterase of Tribolium castaneum and Apis mellifera


A Comparative Study of Inhibitory Properties of Saponins (derived from Azadirachta indica) for Acetylcholinesterase of Tribolium castaneum and Apis mellifera
Amtul Jamil Sami1,*, Sehrish Bilal1, Madeeha Khalid1, Muhammad Tahir Nazir1 and A.R. Shakoori2

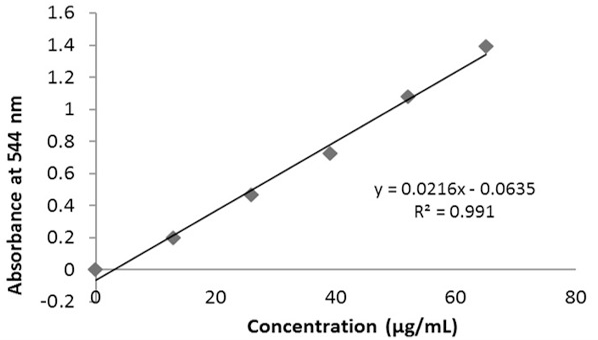
Standard curve for the estimation of saponins, quantified using vanillin-sulfuric acid assay.
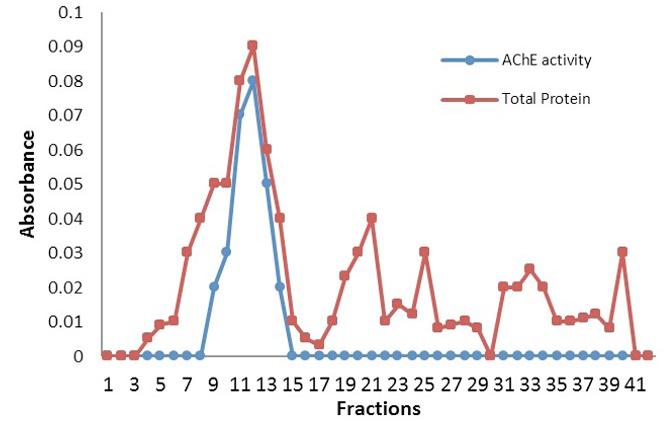
Purification of Tribolium castaneum AChE by Gel filtration chromatography (Sephadex G100), protein estimation by Bradford and colorimetric enzyme activity assay. Fractions were collected after eluting a void volume.

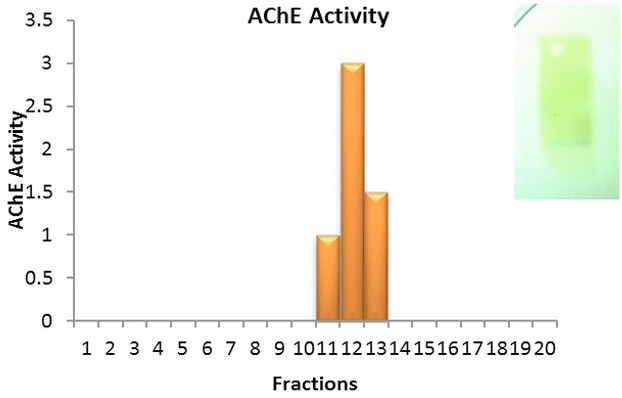
AChE activity in preparative native-PAGE fractions. The fractions 11, 12 and 13 showing diffused enzyme activity on zymogram are inseat.
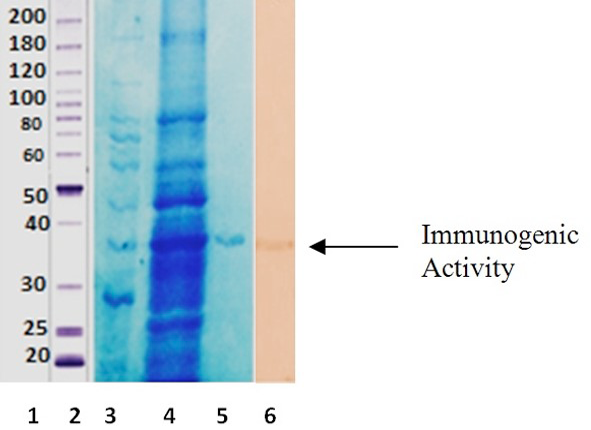
Purified AChE of Tribolium castaneum on 12% SDS-PAGE and western blot. A band of 35kDa is visible. Lane 1, marker; Lane 2, marker in 1% SDS-PAGE; Lane 3, crude extract of insect; Lane 4, purified fraction from gel filtration and preparative PAGE; Lane 5, immuno-blot of purified protein.

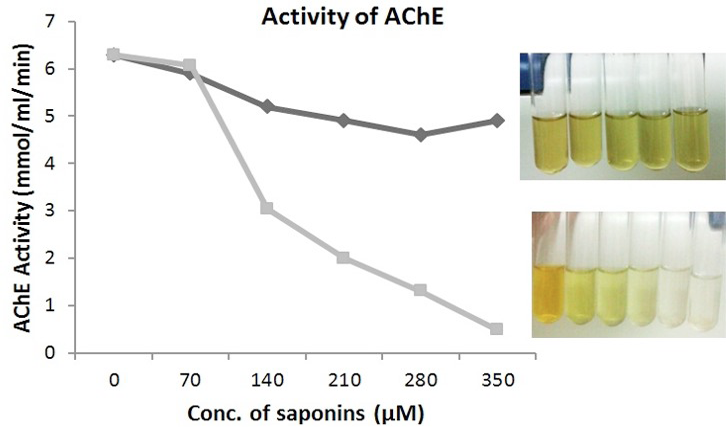
Effect of different concentrations of saponin on the AChE activity of T. castaneum and A. mellifera. Black line shows T. castaneum and grey line for A. mellifera. Inhibitory effect of saponin on T. castaneum is clearly shown.
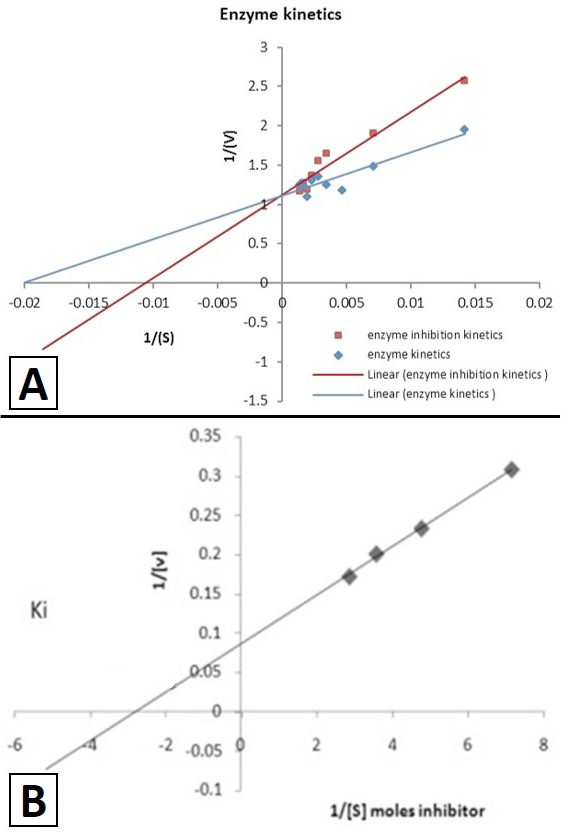
A, Lineweaver-Burk plot for the AChE for T. castaneum; B, graph shows the inhibition constant for saponin.
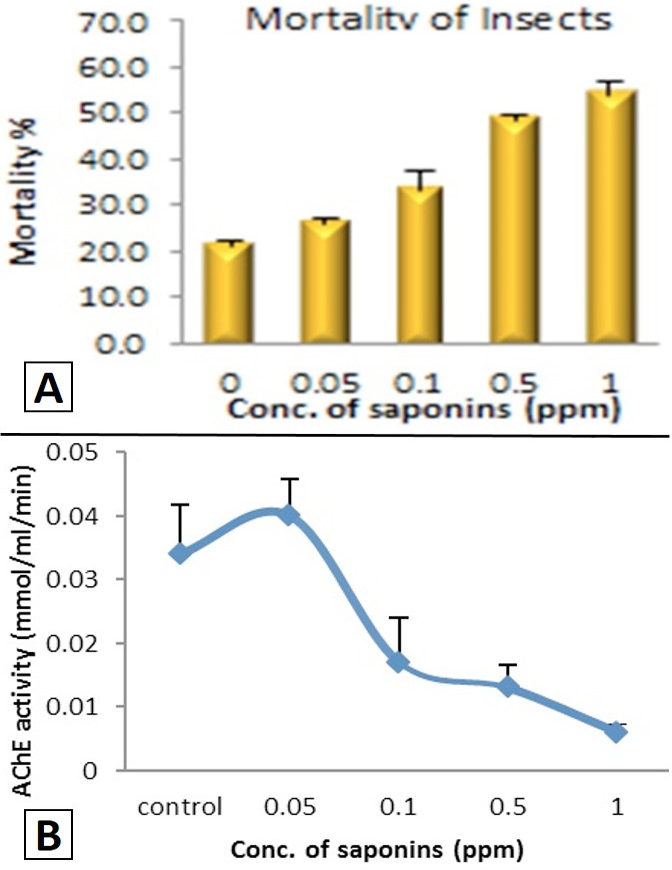
A, LC50 determination using different concentrations of saponins; B, activity of Acetylcholinesterase at different saponin concentrations. The error bars indicate SDs with significant value (P < 0.05).

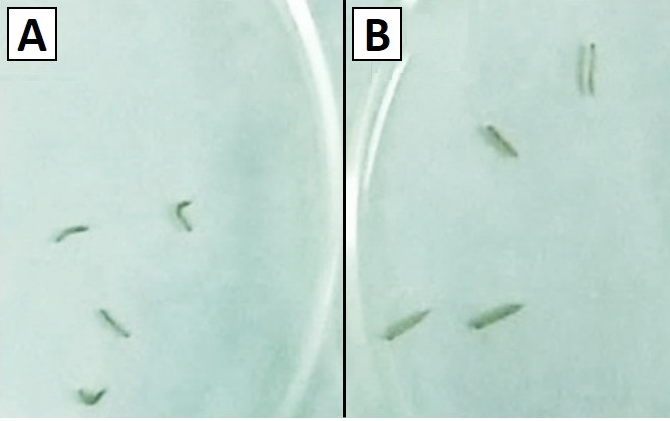
Comparison of size of larvae after 24 h. Test larvae (A) treated with diet containing inhibitor, indicate diminution in size indicating negative effect of neem derived Saponins on T. castaneum larvae. Control larvae (B) appear normal in size with no saponins in the diet.

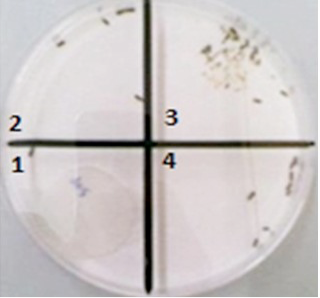
Filter paper disc containing saponin (5 ppm) present in quadrant 1, acts as a repellent for T. castaneum, within 5 min of exposure, insects move towards the quadrant farthest from the inhibitor containing disc.
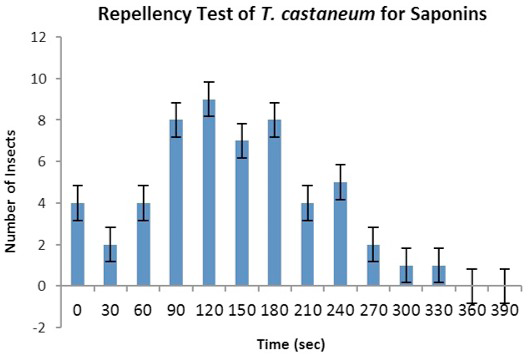
Repellancy test of adult T. castaneum in response to Saponins. The graph indicates the number of insects present in the quadrant containing the inhibitor. The number of insects decreased with time.

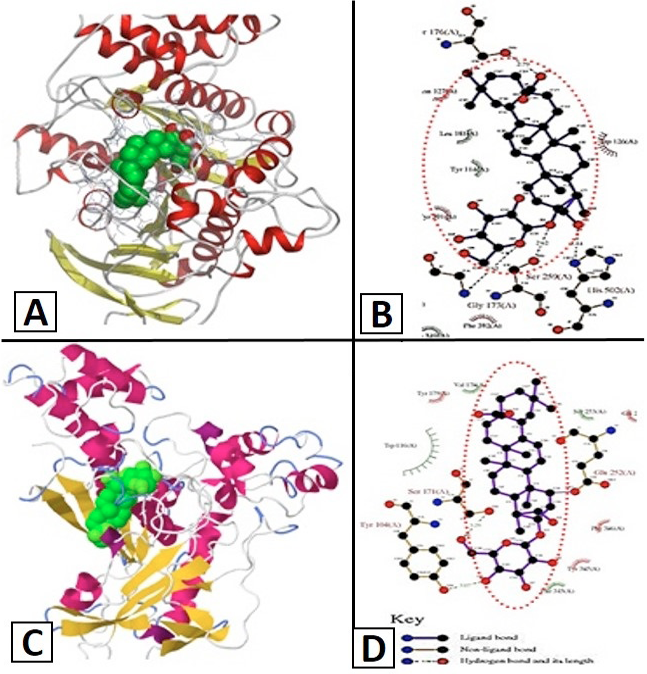
Docking of saponin molecule with AChE of T. castaneum and A. mellifera. Dotted lines indicate the bonding of saponin with amino acid residues of the enzyme AChE present in both species (Saponin molecule highlighted in red dotted line).


