

The Influence of N-Acetylcysteine Alone and in Combination with Angiotensin Converting Enzyme Inhibitor and Angiotensin Receptor Antagonist on Systemic and Tissue Levels in Rats with Experimentally-Induced Chronic Renal Failure


The Influence of N-Acetylcysteine Alone and in Combination with Angiotensin Converting Enzyme Inhibitor and Angiotensin Receptor Antagonist on Systemic and Tissue Levels in Rats with Experimentally-Induced Chronic Renal Failure
Ahmet Ozer Sehirli1,2, Serkan Sayiner3*, Ayliz Velioglu-Ogunc4, Nedime Serakinci5, Emel Eksioglu-Demiralp6, Berrak Yegen7, Feriha Ercan8 andGoksel Sener2

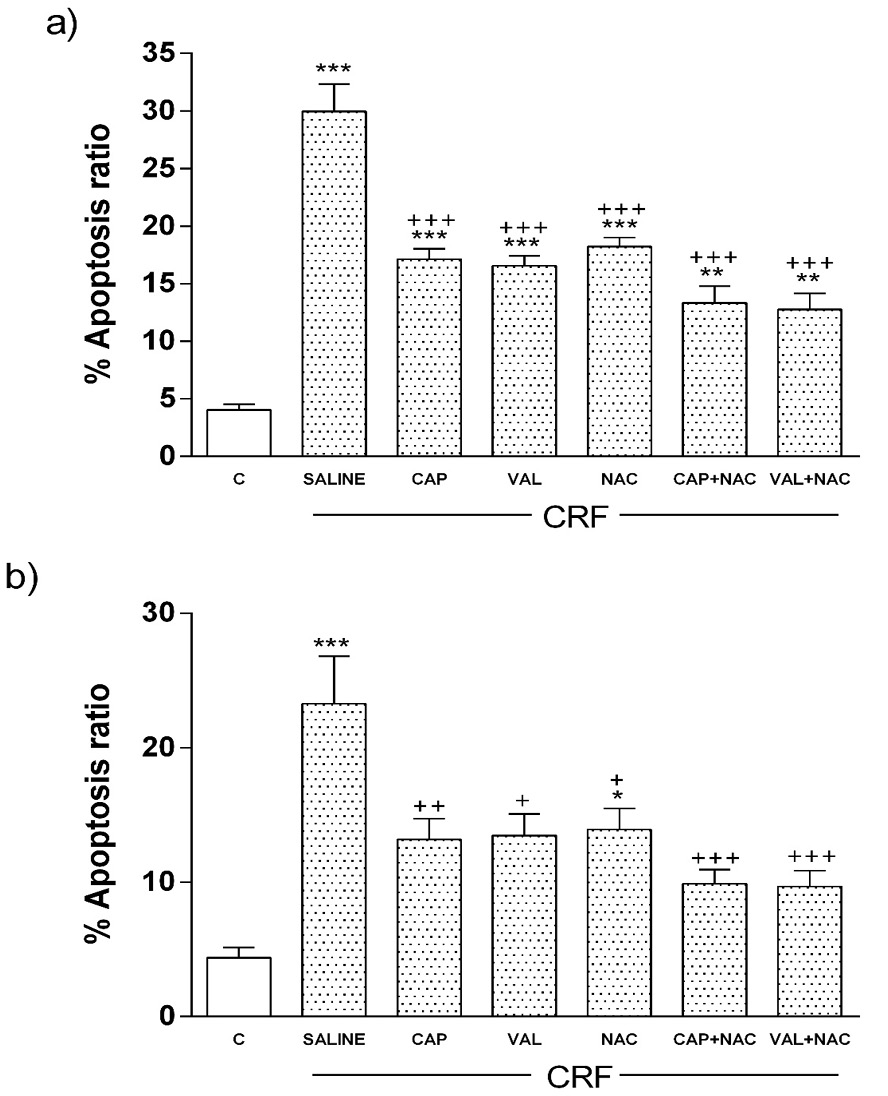
Apoptosis ratio in a) neutrophils, and b) lymphocytes in chronic renal failure (CRF). Control (C), Saline (SF) treated, Captopril (CAP) treated, Valsartan (VAL) treated, N-acetyl-L-cysteine (NAC) treated, CAP+NAC treated, VAL+NAC treated CRF groups. Apoptosis ratios were calculated by dividing the values of after-stimulation to the values obtained prior to phorbol myristate acetate stimulation. * p<0.05, ** p<0.01 and *** p <0.001 compared with control, + p<0.05, ++ p<0.01, +++ p<0.001 compared with SF treated CRF group.
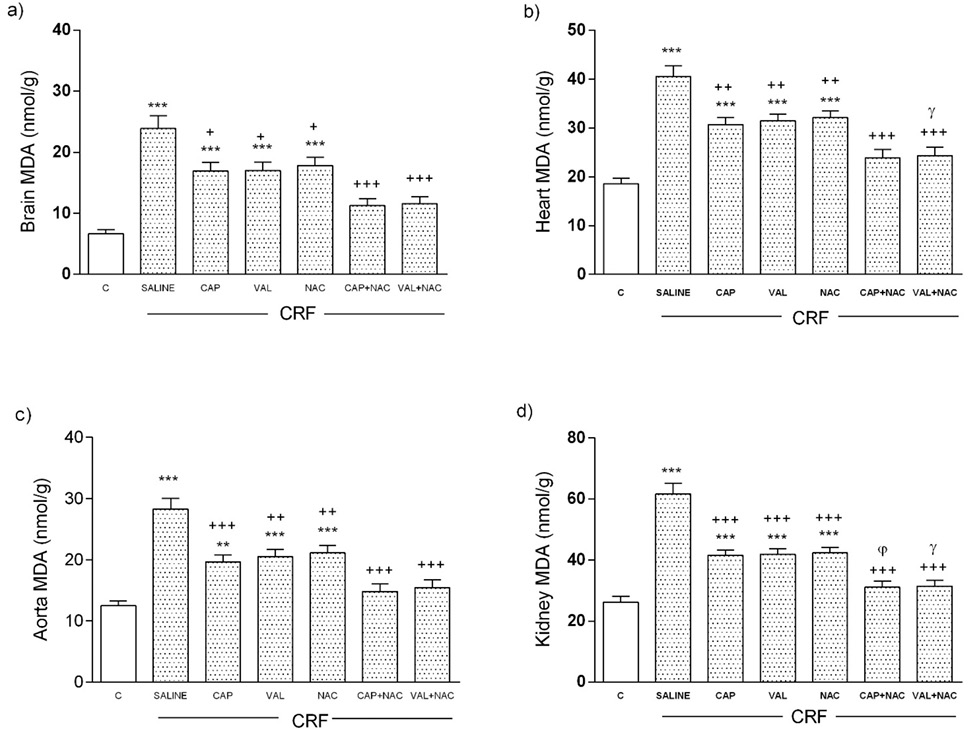
Malondialdehyde (MDA) levels in the a) brain, b) heart, c) aorta and d) kidney tissues in chronic renal failure (CRF). Control (C), Saline (SF) treated, Captopril (CAP) treated, Valsartan (VAL) treated, N-acetyl-L-cysteine (NAC) treated, CAP+NAC treated, VAL+NAC treated CRF groups. ** p<0.01 and *** p <0.001 compared with control, + p<0.05, ++ p<0.01, +++ p<0.001 compared with SF treated CRF group, φ p<0.05 compared with CAP treated CRF group, γ p<0.05 compared with VAL treated CRF group.

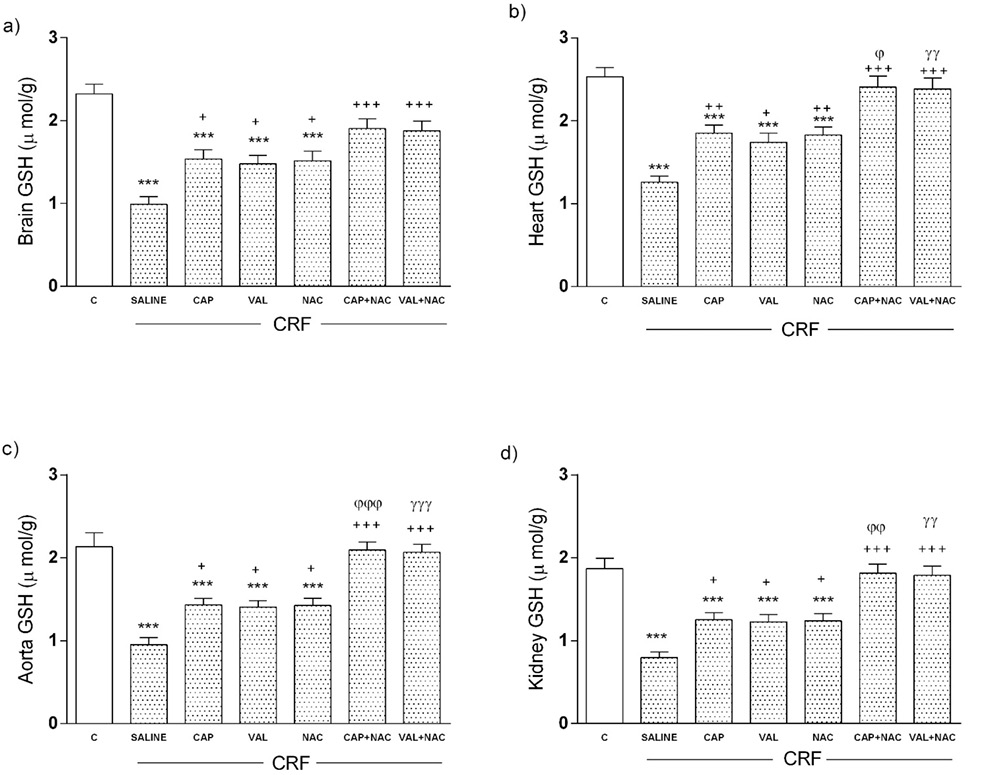
Glutathione (GSH) levels in the a) brain, b) heart, c) aort and d) kidney tissues in chronic renal failure (CRF). Control (C), Saline (SF) treated, Captopril (CAP) treated, Valsartan (VAL) treated, N-acetyl-L-cysteine (NAC) treated, CAP+NAC treated, VAL+NAC treated CRF groups. *** p <0.001 compared with control, + p<0.05, ++ p<0.01, +++ p<0.001 compared with SF treated CRF group, φ p<0.05, φφ p<0.01, φφφ p<0.001 compared with CAP treated CRF group, γγ p<0.01, γγγ p<0.001 compared with VAL treated CRF group.
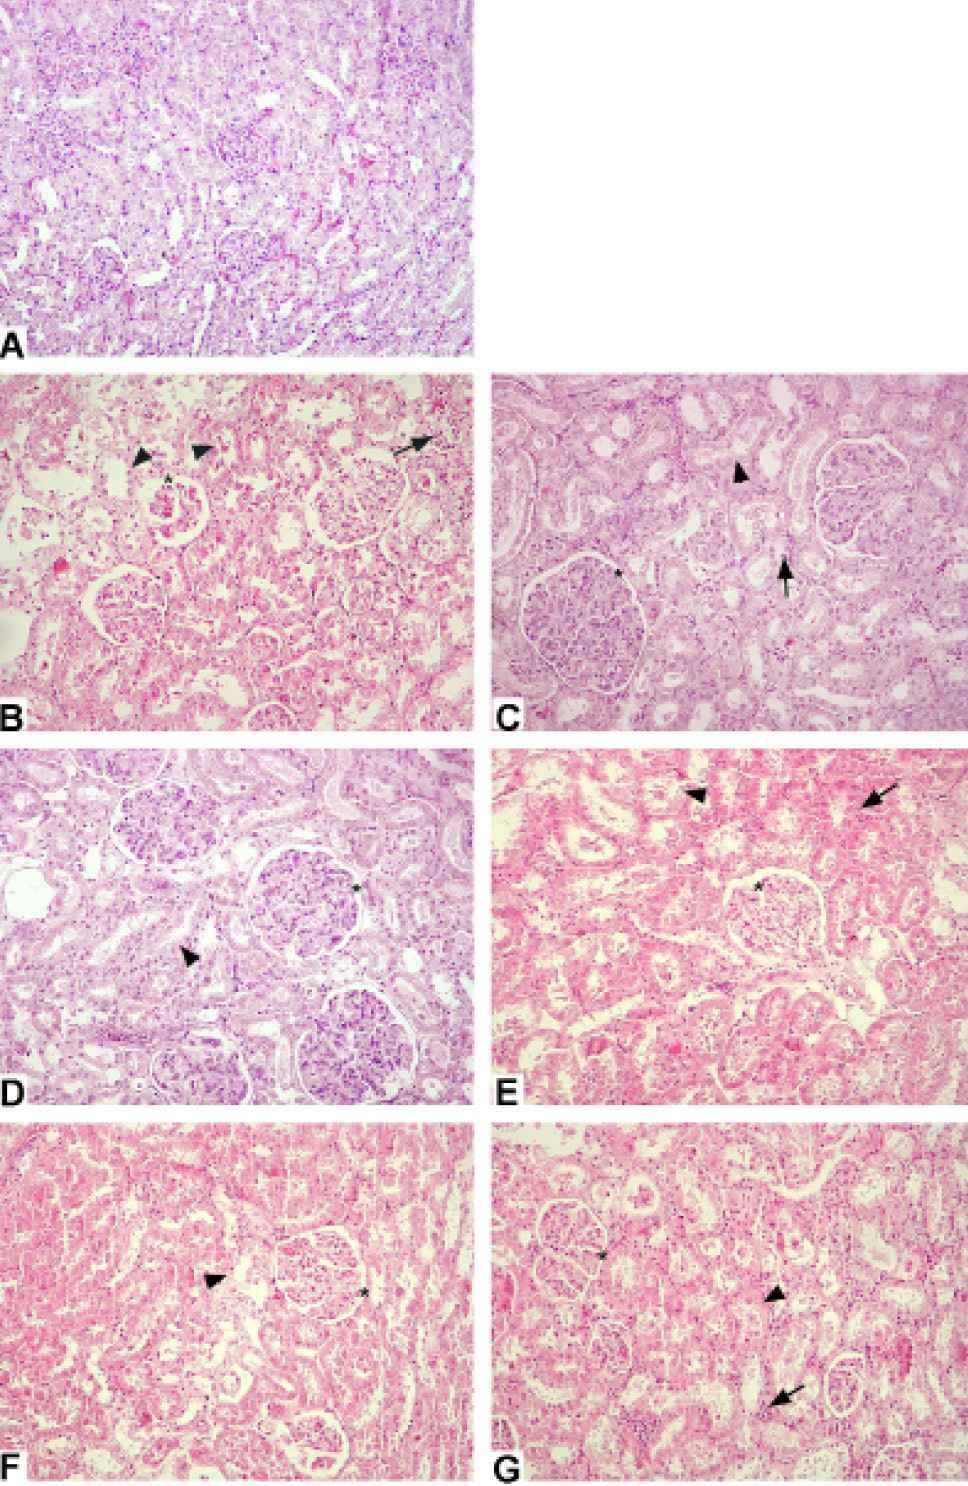
Representative photomicrographs of kidney in experimental groups. Normal morphology of kidney (A) in control group (A); degenerated glomerulus (*) and tubular structures (arrowhead) and inflammatory cells (arrow) in CRF group (B); quite regular glomerulus (*), a few degenerated tubular structures (arrowhead) and decreased number of inflammatory cells (arrow) in CRF+CAP (C), CRF+VAL (D), CRF+NAC (E), CRF+CAP+NAC (F) and CRF+VAL+NAC (G) groups are seen. H andE staining, Original magnifications: 200x.
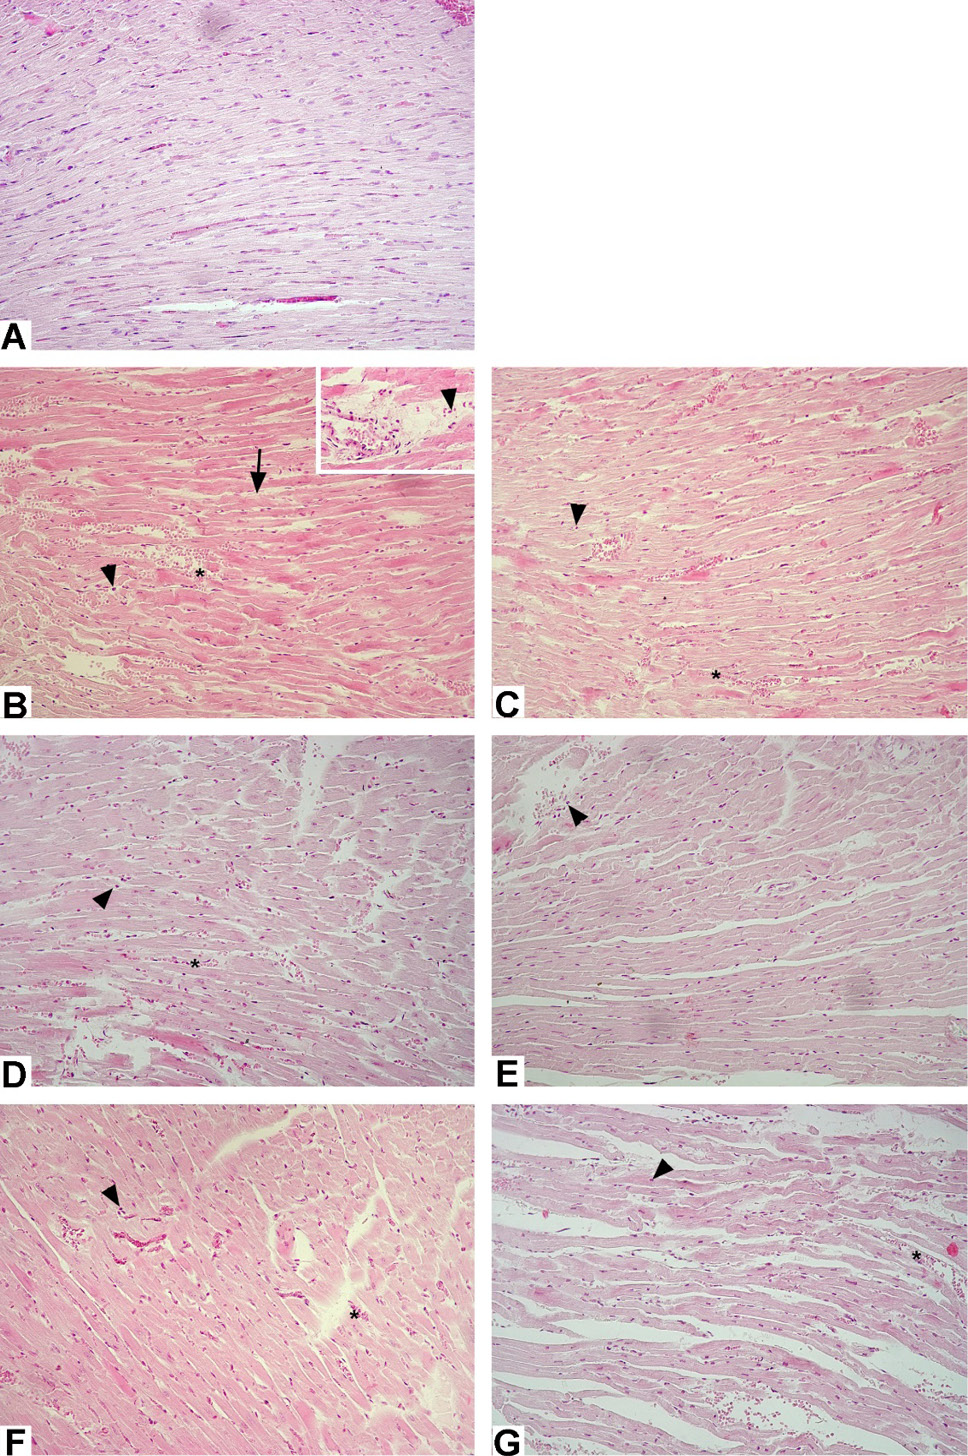
Representative photomicrographs of heart in experimental groups: Normal morphology of heart in control group (A); degenerated cardiac muscle fibers (arrow), haemorrhage (*) and inflammatory cells (arrowhead) in CRF group (B); quite regular cardiac muscle fibers, decrease of vascular congestion (*) and inflammatory cells (arrowhead) in CRF+CAP (C), CRF+VAL (D), CRF+NAC (E), CRF+CAP+NAC (F) and CRF+VAL+NAC (G) groups are seen. H andE staining, original magnifications: 400x.

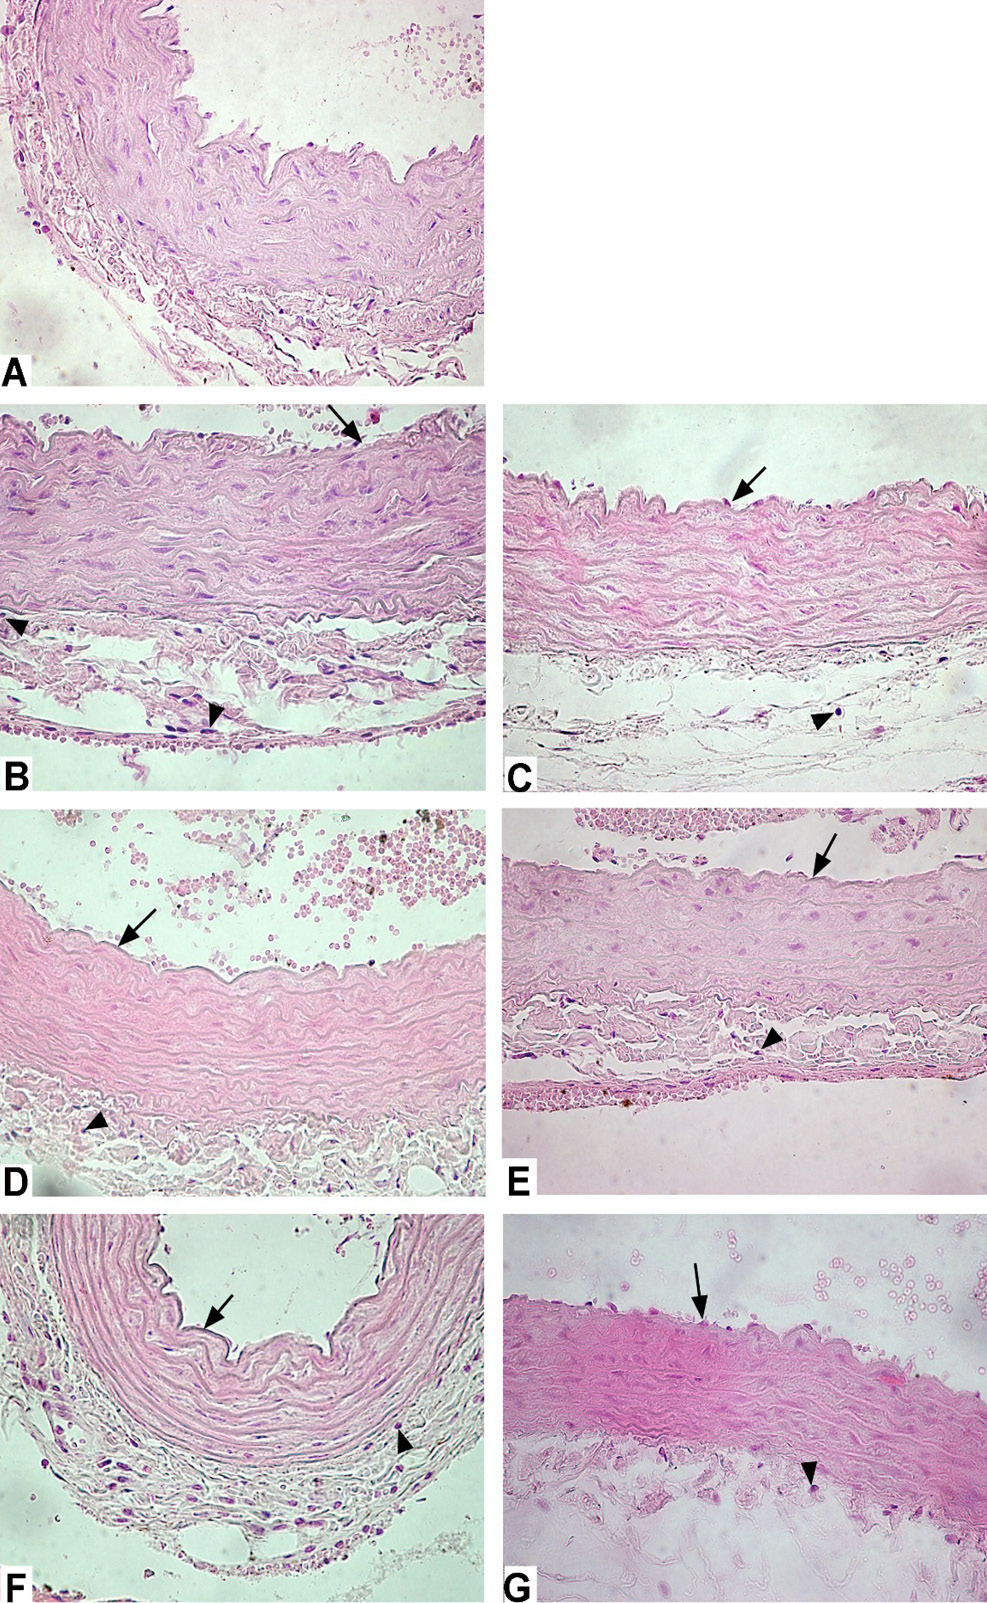
Representative photomicrographs of aorta in experimental groups: Normal morphology of aorta in control group (A); degenerated endothelium (arrow) and inflammatory cells (arrowhead) in adventitia layer of CRF group (B); quite regular endothelium (arrow) and a decreased number of inflammatory cells (arrowhead) in adventitia layer of CRF+CAP (C), CRF+VAL (D), CRF+NAC (E), CRF+CAP+NAC (F) and CRF+VAL+NAC (G) groups are seen. H andE staining, original magnifications: 200x
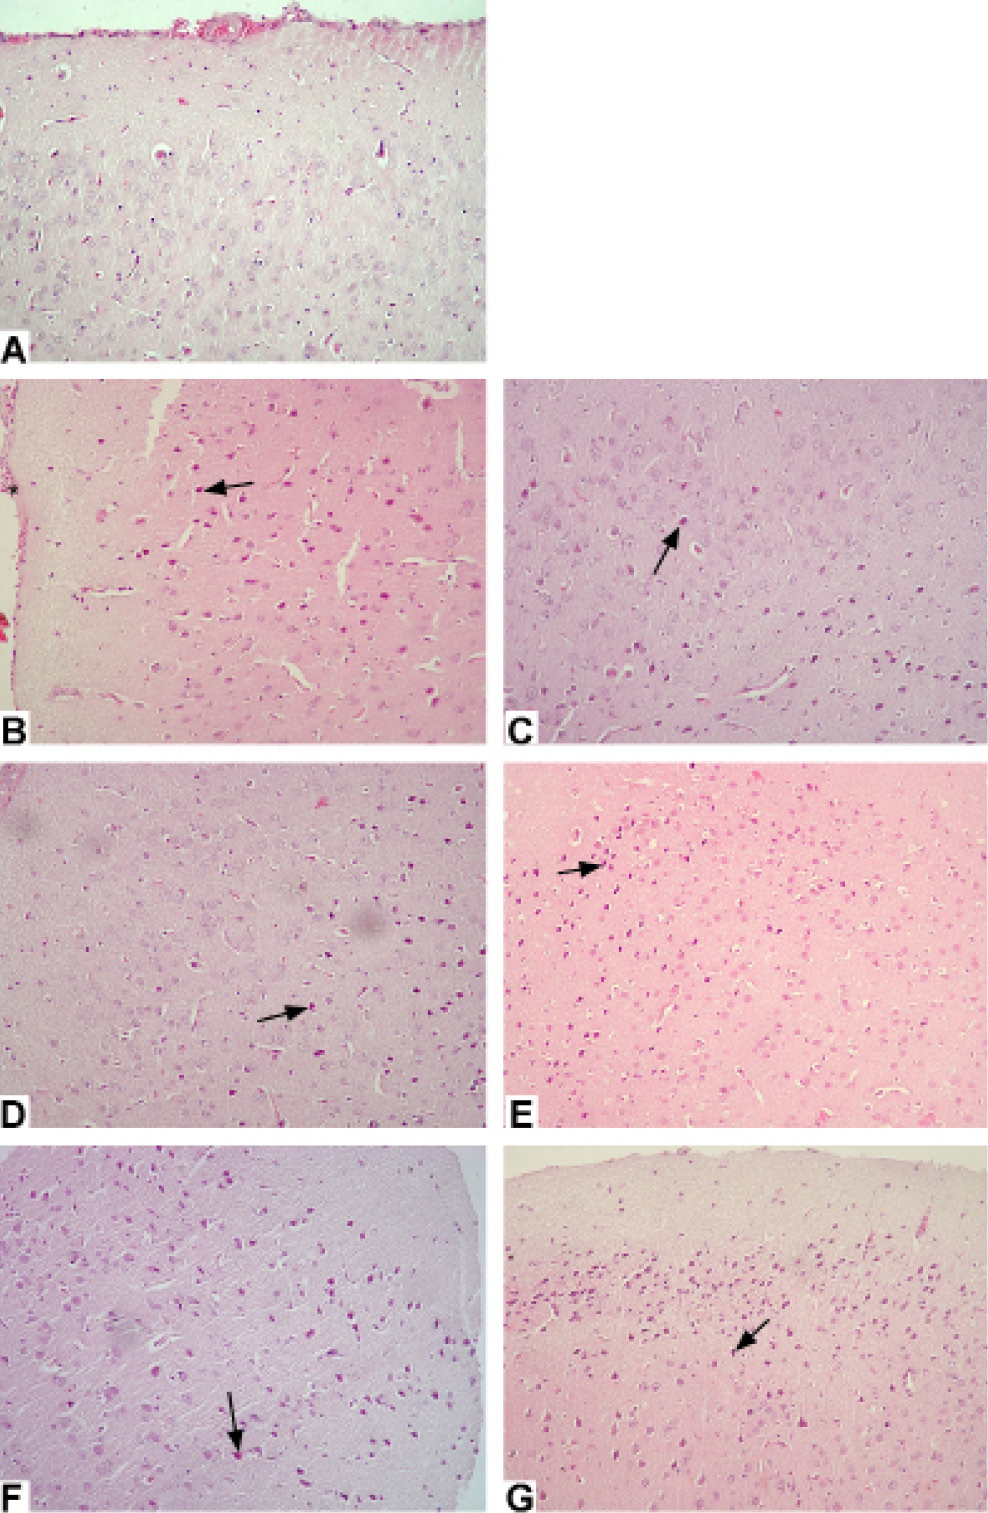
Representative photomicrographs of cerebral cortex in experimental groups: Normal morphology of cerebral cortex in control group (A); vascular congestion (*) and degenerated neurons (arrow) in CRF group (D); decreased number of degenerated neurons (arrow) in CRF+CAP (C), CRF+VAL (D), CRF+NAC (E), CRF+CAP+NAC (F) and CRF+VAL+NAC (G) groups are seen. H andE staining, original magnifications: 200x.


