
Real Time Estimation of Wheat Chlorophyll Content Retrieve from Landsat 8 Imagery Under Rainfed Condition


Research Article
Real Time Estimation of Wheat Chlorophyll Content Retrieve from Landsat 8 Imagery Under Rainfed Condition
Syed Shah Mohioudin Gillani1, Muhammad Naveed Tahir1, Adeel Anwar1*, Syed Ijaz Ul Haq2, Muhammad Awais3, Mujahid Iqbal4, Javed Iqbal5, Hina Ahmed Malik3, Syed Muhammad Zaigham Abbas Naqvi6, Raza Ullah7 and Muhammad Abdullah Khan1
1Department of Agronomy, PMAS-Arid Agriculture University, Rawalpindi, 46300, Pakistan; 2School of Agriculture Engineering and Food Sciences, Shandong University of Technology, Zibo, China, 255000; 3Institute of Soil and Environmental Sciences University of Agriculture, Faisalabad, PAkistan; 4Agriculture Research Institute Sariab Quetta, Pakistan; 5Department of Agricultural Engineering, Khwaja Fareed University of Engineering and Information Technology, Rahim Yar Khan, Pakistan; 6Department of Electrical Engineering, Henan Agricultural University, Zhengzhou 450002, China; 7Agronomy College, Jilin Agriculture University, Changchun, China.
Abstract | Monitoring crop bio-physical characteristics through non-destructive methods enable us to understand the different environmental impacts and help to respond to them precisely and rapidly. Chlorophyll pigmentation in plants is a supreme factor to assess the health of plants and ultimately leads to crop yield estimation. The present experiment evaluated the capacity of high-resolution satellite imagery to estimate wheat chlorophyll content coupled with ground-based information for accurately monitoring crop chlorophyll status under rainfed conditions. Images with zero clouds from LANDSAT 8 and ground data collection were carried out in a simultaneous time frame. Vegetation indices (VI) comprised of normalized difference vegetation index (NDVI), green normalized difference vegetation index (GNDVI), chlorophyll absorbed ratio index (CARI), modified chlorophyll absorbed ratio index (MCARI), and transformed chlorophyll absorbed ratio index (TCARI) were derived by LANDSAT 8 imagery for chlorophyll determination. Validation of the chlorophyll contents was performed (43 locations under rainfed conditions) nondestructively using a chlorophyll meter (SPAD-502 Minolta) along with GPS positions during Mid-March, 2017 for the wheat crop. Regressional models were plotted amongst the ground-truthed statistics and the VIs originated from satellite images to assess the accuracy. High sensitivity for chlorophyll determination was reported for NDVI and MCARI with R2 values of 0.81 and 0.80 respectively. Results proposed the real-time application of satellite imagery with high spatial resolution at wider regions. This will help the scientists to monitor and manage the nutrient requirements of plants as well as will enable them to accurately and rapidly respond to plant health by determining chlorophyll contents in plants.
Received | July 31, 2022; Accepted | December 14, 2022; Published | February 15, 2023
*Correspondence | Adeel Anwar, Department of Agronomy, PMAS-Arid Agriculture University, Rawalpindi, 46300, Pakistan; Email: dradeelanwar@uaar.edu.pk
Citation | Gillani, S.S.M., M.N. Tahir, A. Anwar, S.I. Haq, M. Awais, M. Iqbal, J. Iqbal, H.A. Malik, S.M.Z.A. Naqvi, R. Ullah and M.A. Khan. 2023. Real time estimation of wheat chlorophyll content retrieve from Landsat 8 imagery under rainfed condition. Sarhad Journal of Agriculture, 39(1): 147-155.
DOI | https://dx.doi.org/10.17582/journal.sja/2023.39.1.147.155
Keywords | Chlorophyll pigmentation, vegetation indices, Regressional models, wheat chlorophyll estimation
Copyright: 2023 by the authors. Licensee ResearchersLinks Ltd, England, UK.
This article is an open access article distributed under the terms and conditions of the Creative Commons Attribution (CC BY) license (https://creativecommons.org/licenses/by/4.0/).
Introduction
Wheat (Triticum aestivum L.) is a most imperative nourishment cereal for more than 33% of the world. It is viewed that wheat contributes around 60 percent of the world’s protein requirement and a larger number of calories to the world eating routinely than whatever other food crop (Conway, 2012). In plants, chlorophyll is known as the fundamental element during photosynthesis (Yuan et al., 2007). The determination of vigor for crops suggests the crop management significantly which is proposed by the ratio of chlorophyll content per unit area of the leaf. Chlorophyll converts solar energy in the form of chemical energy in plants, thereby creates direct impact on plant development and final yield. Literature has cited significantly encouraging results between the leaf nitrogen and chlorophyll ratios. Therefore, quantifying chlorophyll contents can indirectly measure nitrogen status (Filella et al., 1995; Moran et al., 2000).
Spectrophotometry, high-performance liquid chromatography (HPLC), and extraction are some conventional techniques to analyze plants’ pigments. A leaf when measured in these techniques is destructed and sequential changes over time are not observable in it. Moreover, conventional methods are not cost-effective and are time taking, thereby unfeasible for large-scale measurements of landscapes and ecosystems. Thus, precise, effective, and feasible methods are needed to predict and measure the biophysical variables (Grassino et al., 2022).
Remote sensing gave a novel and important method to connect remote sensing assessments with the biochemistry of the earth’s surface in an authentic and viable manner. However, the correlation between ground data and satellite information is dependent on the experimental territory and its state of reflectance collection. The expansion of remote sensing technology favors new scope for predicting the chlorophyll contents of crop growth stages (Buschmann and Nagel, 1993; Gitelson and Merzlyak, 1994; Markwell et al., 1995; Gamon and Surfus, 1999; Gitelson et al., 2001, 2002). Numerous effective and modern remote sensing techniques are in practice to achieve precise, efficient, cost-effective, and less time consuming such as multispectral, light detection and ranging techniques, unmanned aerial vehicle system, satellite, etc. More and more efforts are concentrated to understand the correlation between the optical characteristics of vegetation and the concentration of photosynthetic pigments in green leaf tissues (i.e., chlorophyll and carotenoids).
Leaf reflection-based novel, simple, and substitute nondestructive method was recommended to quantify pigments in leaves (Richardson et al., 2002; Sims and Gamon, 2002; Gitelson et al., 2003; Hu et al., 2004; Le Maire et al., 2004) and canopies (Barton, 2001; Gitelson et al., 2005). However, when using the chlorophyll content values of individual leaf to express the chlorophyll content of canopy, there was still an important uncertainty. Precise, fast, and practical methods in the quantification of canopy chlorophyll contents per unit ground area were still unavailable. To cover this gap, a current experiment was conducted, and various spectral chlorophyll indices were evaluated to precisely estimate the chlorophyll contents on the basis of LANDSAT 8 imagery under rainfed conditions of district Chakwal. The leading aims of this experiment were to estimate the wheat chlorophyll contents in real-time on the basis of VIs. Further, the validation of field data procured using SPAD chlorophyll meter was performed, and the accuracy was determined with results of remotely sensed estimation in wheat crop.
Materials and Methods
Study site and chlorophyll determination
The proposed experiment was carried out under rainfed condition of district Chakwal. The Chakwal district is located at 33°40’ north latitude and 72°51’ east longitude, with an altitude ranging from 500 m to 1200 m and total area of 6,524 square kilometers. The total area depends upon rainfall for agriculture. The Chakwal district has total four tehsils and 68 union councils. Wheat data collection (crop chlorophyll content) was performed in mid-March, 2017 (Mid-Crop season) by implementing the SPAD-502 Minolta chlorophyll meter for in vivo detections in wheat leaves from 43 union councils. 10 m x 10 m field was marked, seven plants were selected at one site, and mean was calculated for them. A GPS meter was used to geo-tag the locations of the study and sample area.
Remote sensing data and digital image analysis
Remote-sensing information was obtained through the USGS website. To process and analyze the digital images, ground-truthing information collection was very important for subsequent image analysis. The satellite imagery was geo-corrected by applying the Ground Control Points (GCPs). Atmospheric correction of satellite imageries was performed using ArcMap and ERDAS Imagine software for noise removal by applying noise cancelation models on satellite data. After atmospheric correction of satellite imagery, spectral vegetation indices were applied to remotely sense the wheat chlorophyll indices.
Spectral vegetation indices
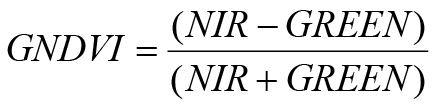
Green normalized difference vegetation index (GNDVI): GNDVI is recognized as the most robust vegetation index. Studies recommended the GNDVI as a highly correlated index to chlorophyll content. It also has been shown that it can be a promising index for determining the status of N uptake in wheat during growth stages (Moges et al., 2005; Tahir et al., 2013). GNDVI can be calculated using the equation below:
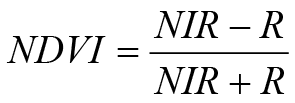
Normalized difference vegetation index (NDVI): NDVI was suggested by Rouse et al. (1974) and was used in this study considering its various advantages as proposed in many studies. The index is very responsive to green vegetation and can estimate the crops and predict precipitation in semi-arid areas. Following equation expresses the NDVI index.
Chlorophyll absorbed ratio index (CARI): Kim et al. (1994) described this index with the following formula:
CARI = [(0.8*R700+0.2*R550)-R670)]
Modified chlorophyll absorbed ratio index (MCARI): This is the modified version of CARI and calculated with the following equation (Daughtry et al., 2000).
MCARI = [(R700-R670)-0.2*(R700-R550)*(R700/R670)]
Transformed chlorophyll absorbed ratio index (TCARI): Transformed chlorophyll absorption ratio was proposed by (Haboudane et al., 2002).
TCARI = 3 x [(R700-R670)-0.2 x (R700-R550) x (R700/R670)]
Mapping and statistical analysis
Regression models were developed, and results were demonstrated for the significant relationship between satellite data and the ground data of the chlorophyll. The correlation coefficient R2 of all the indices and ground data was mapped. The probability and spatial variations around the study site were mapped by upscaling and interpolations for chlorophyl estimation in wheat crop. The reflectance values derived from satellite data determined the R2 values which were obtained using the regression equations that determined the most efficient VIs for chlorophyll estimation remotely at mid-crop stages. Linear regression analysis was then performed to evolve relationships among satellites-derived vegetation indices and ground-truthing wheat leaf chlorophyll content.
Results and Discussion
Land cover classification
Classification of land cover was mapped for experimental area using the LANDSAT 8 satellite imagery. Supervised classification was performed to create six main surface classes including water, buildup, barren lands, mountains, high vegetation and low vegetation. Land classification is shown in Figure 1.
Mean reflectance values of green, red, and NIR electromagnetic spectrum were used to compute different VIs. The obtained VIs; NDVI, GNDVI, CARI, MCARI, and TCARI suggested different band ratios which explained the estimation ability of wheat chlorophyll contents. All vegetation indices were implemented to develop regression models based on ground-truthed information to evolve the equations that predicted the chlorophyll content of wheat crops.
GNDVI and chlorophyll contents: GNDVI analyses the greenness of crops. The GNDVI map showed variation across the district Chakwal. The minimum value was -1 and the maximum value was 0.42. In land cover classification, the area was classified into different classes in which a lot of areas were comprised of non-vegetation area as shown in the map of GNDVI due to which that area reflected the low value of GNDVI (Figure 2).
The output of the regressional model suggested the efficient relationship between GNDVI and wheat chlorophyll contents. The regressional model (Y= 225.44X) showed a 75% data variation (R2 = 0.75) that is a sign of chlorophyll variations in the leaves obtained from GNDVI index. The ground data obtained from the field and the GNDVI values are in a 75% accuracy that determines the model’s fitness (Figure 3). Some researchers are also in the support of these positive correlations (Blackburn and Steele, 1999; Bell et al., 2004; Li-Hong et al., 2007) with R2 value of 0.72, 0.88, and 0.82, respectively.
In NDVI we calculated the photosynthtically absorbed radiation. The NDVI map showed the status across the whole study area. The map signifies the NDVI index for vegetation and chlorophyll determination with its lower reflectance value of –1 that is for built-up and water bodies. The strongest values that determined the vigorous crop health and good vegetation cover were recorded as +0.46 (Figure 4).
Significant and strong linear relationship was observed amongst NDVI and wheat chlorophyll contents. The ground data obtained from the field and the NDVI values are in an 80% accuracy that determines the model’s fitness (Figure 5). Y= 188.93X model determined the corelation variations amongst the NDVI and wheat chlorophyll contents. The results are also supported by (Hashmi et al., 2011) with R2 values of 86%.
CARI determines the depth of chlorophyll absorption. Map of CARI presented the variations among values for the study area. Figure 6 shows the lowest value as zero and the highest as 2.5 across the district Chakwal. These vegetation indices help us to understand how much the depth of chlorophyll absorption is. Some areas have high vegetation so in those areas, the CARI value was also higher. Some areas of district Chakwal comprised of high mountains, low vegetation, and water bodies, so CARI showed low value for those areas.
CARI showed a positive relationship with the wheat chlorophyll yet the lower in comparison to NDVI and GNDVI. Figure 7 represented R2 value of 0.65 and regressional model Y=92.4X.
TCARI and chlorophyll contents: TCARI is an amended version of MCARI. TCARI was mapped to present the chlorophyll strength in the study area. The distribution of vegetative area from lowest to highest using TCARI was mapped with the values from 0 – 4 (Figure 8). The lowest value of TCARI map indicated the presence of water and barren land.
The correlation between TCARI and wheat chlorophyll values showed very low significance as compared to GNDVI, NDVI, CARI, and MCARI. The linear regressional model (Y= 21.46X) between the TCARI and wheat chlorophyll contents showed R2 value of 0.61 (Figure 9). The study results are also supported by (Haboudane et al., 2004; Zhang et al., 2014) with R2 of 55% and 66.74%, respectively.
MCARI and chlorophyll contents: CARI index was amended with certain modifications to obtain the enhanced vegetation distribution in the study area and MCARI index was developed. MCARI ultimately proved significant for the current study with the highest estimation of chlorophyll contents. MCARI values varied across the whole study area. The minimum value was 0 and the maximum value was 5 with the lowest and highest vegetation, respectively (Figure 10).
Above all indices, GNDVI, NDVI, CARI, and TCARI showed a positive and linear relationship. Regression model Y=14.96X amongst chlorophyll content and MCARI reflectance values determined with the 81% fitness of the model (Figure 11). Literature regarding the efficacy of MCARI was not in accordance with the current study. Current study found the MCARI as the most effective index for chlorophyll determinations (Haboudane et al., 2008; Wu et al., 2009; Liao et al., 2013).
Probability map of chlorophyll contents
Vigorous crop health is based on chlorophyll contents. The probability map to determine the contents around the study area of district Chakwal is a clear contribution to chlorophyll estimation. The prediction of the chlorophyll content is based on the threshold values. The map shows a range between 0 and 1 which is a clear demonstration of the higher and lower vegetation areas in Chakwal district. Red color in the map is the demonstration of higher chlorophyll contents and most of the Chakwal area is comprised of it. Blue color is the lowest vegetative area, while the values that fall between them are the variations of chlorophyll contents due to the plant health or the vegetation pattern under rainfed conditions in the district Chakwal (Figure 12).
The current experiment analyzed the feasibility of high-resolution remote sensing data to map the wheat chlorophyll content under rain-fed conditions. Vigorousness of the crop and crop health can visually be assessed by its greenness and chlorophyll is the critical element responsible for it. Its determination can help to estimate the yield and plant health at an early stage of crop production. VIs were extracted from the imagery of LANDSAT 8 including NDVI, GNDVI, CARI, TCARI, and MCARI and then validate with the ground-truthing data of wheat chlorophyll contents (Tahir et al., 2018). Linear regression analysis between different vegetation indices and wheat chlorophyll contents was performed to derive regression equations to determine more robust index. MCARI showed strong relationship with value of R2 = 0.81) when compared with GNDVI, NDVI, CARI, and TCARI used in the study (Naqvi et al., 2018). MCARI index exhibited significantly higher values for accurate and real-time predictions of wheat chlorophyll. The effectiveness of high spatial resolution satellite imagery for mapping spatial differences in chlorophyll content at the regional scale proved to be detrimental and significant (Naqvi et al., 2021).
Conclusions and Recommendations
The current experiment is conclusively a one-step forward to analyze the chlorophyll contents of the plants remotely. Remote estimations help the farmer to take predictive measures to enhance crop yield and mitigate food security issues. The best-suited vegetation indices can help to evaluate the remote sensing data very rapidly. The future impact of the current study is that Landsat 8 can become the rapid and efficient source for remote estimation of chlorophyll contents as well as for yield parameters. This can help to fight the risk of global food risks as well.
Acknowledgement
The authors are thankful to Pir Mehr Ali Shah Arid Agriculture University for providing the research facilities.
Novelty Statement
Landsat-8 can be used as the remote sensing approach under rainfed conditions for the estimation of chlorophyll contents that can lead to the healthy crop development.
Author’s Contribution
Syed Shah Mohioudin Gillani: Prepared and presented the work, writing- original draft.
Mujahid Iqbal: Provided the study materials and maintained the research data.
Adeel Anwar and Muhammad Abdullah Khan: Management activities to annotate and reproducibility of research outputs.
Syed Ijaz Ul Haq: Reviewing and editing.
Muhammad Awais: Drafting and interpretation of the data.
Muhammad Naveed Tahir and Syed Muhammad Zaigham Abbas Naqvi: Supervision and conceptualization.
Javed Iqbal: Project administration.
Hina Ahmed Malik: Project administration.
Raza Ullah: Revising the manuscript critically for important intellectual content.
Conflict of interest
The authors have declared no conflict of interest.
References
Barton, C.V., 2001. A theoretical analysis of the influence of heterogeneity in chlorophyll distribution on leaf reflectance. Tree Physiol., 21(12-13): 789-795. https://doi.org/10.1093/treephys/21.12-13.789
Bell, G., B. Howell, G. Johnson, W. Raun, J. Solie and M. Stone. 2004. Optical sensing of turfgrass chlorophyll content and tissue nitrogen. HortScience, 39(5): 1130-1132. https://doi.org/10.21273/HORTSCI.39.5.1130
Blackburn, G.A. and C.M. Steele. 1999. Towards the remote sensing of matorral vegetation physiology: Relationships between spectral reflectance, pigment, and biophysical characteristics of semiarid bushland canopies. Remote Sens. Environ., 70(3): 278-292. https://doi.org/10.1016/S0034-4257(99)00044-9
Buschmann, C. and E. Nagel. 1993. In vivo spectroscopy and internal optics of leaves as basis for remote sensing of vegetation. Int. J. Remote Sens., 14(4): 711-722. https://doi.org/10.1080/01431169308904370
Conway, G., 2012. One billion hungry: Can we feed the world? Cornell University Press. https://doi.org/10.7591/9780801466083
Daughtry, C., C. Walthall, M. Kim, E.B. De Colstoun and J. McMurtrey Iii. 2000. Estimating corn leaf chlorophyll concentration from leaf and canopy reflectance. Remote Sens. Environ., 74(2): 229-239. https://doi.org/10.1016/S0034-4257(00)00113-9
Filella, I., L. Serrano, J. Serra and J. Penuelas. 1995. Evaluating wheat nitrogen status with canopy reflectance indices and discriminant analysis. Crop Sci., 35(5): 1400-1405. https://doi.org/10.2135/cropsci1995.0011183X003500050023x
Gamon, J. and J. Surfus. 1999. Assessing leaf pigment content and activity with a reflectometer. New Phytol., 143(1): 105-117. https://doi.org/10.1046/j.1469-8137.1999.00424.x
Gitelson, A. and M.N. Merzlyak. 1994. Spectral reflectance changes associated with autumn senescence of aesculus hippocastanum l. And Acer platanoides L. Leaves. Spectral features and relation to chlorophyll estimation. J. Plant Physiol., 143(3): 286-292. https://doi.org/10.1016/S0176-1617(11)81633-0
Gitelson, A.A., A. Vina, V. Ciganda, D.C. Rundquist and T.J. Arkebauer. 2005. Remote estimation of canopy chlorophyll content in crops. Geophys. Res. Lett., 32(8). https://doi.org/10.1029/2005GL022688
Gitelson, A.A., M.N. Merzlyak and O.B. Chivkunova. 2001. Optical properties and nondestructive estimation of anthocyanin content in plant leaves. Photochem. Photobiol., 74(1): 38-45. https://doi.org/10.1562/0031-8655(2001)074<0038:OPANEO>2.0.CO;2
Gitelson, A.A., Y. Gritz and M.N. Merzlyak. 2003. Relationships between leaf chlorophyll content and spectral reflectance and algorithms for non-destructive chlorophyll assessment in higher plant leaves. J. Plant Physiol., 160(3): 271-282. https://doi.org/10.1078/0176-1617-00887
Gitelson, A.A., Y. Zur, O.B. Chivkunova and M.N. Merzlyak. 2002. Assessing carotenoid content in plant leaves with reflectance spectroscopy. Photochem. Photobiol., 75(3): 272-281. https://doi.org/10.1562/0031-8655(2002)075<0272:ACCIPL>2.0.CO;2
Grassino, M., D.J. Batstone, K.W.L. Yong, G. Capson-Tojo and T. Hülsen. 2022. Method development for ppb culture screening, pigment analysis with uplc-uv-hrms vs. Spectrophotometric methods, and spectral decomposition-based analysis. Talanta, 246: 123490. https://doi.org/10.1016/j.talanta.2022.123490
Haboudane, D., J.R. Miller, E. Pattey, P.J. Zarco-Tejada and I.B. Strachan. 2004. Hyperspectral vegetation indices and novel algorithms for predicting green lai of crop canopies: Modeling and validation in the context of precision agriculture. Remote Sens. Environ., 90(3): 337-352. https://doi.org/10.1016/j.rse.2003.12.013
Haboudane, D., J.R. Miller, N. Tremblay, P.J. Zarco-Tejada and L. Dextraze. 2002. Integrated narrow-band vegetation indices for prediction of crop chlorophyll content for application to precision agriculture. Remote Sens. Environ., 81(2-3): 416-426. https://doi.org/10.1016/S0034-4257(02)00018-4
Haboudane, D., N. Tremblay, J.R. Miller and P. Vigneault. 2008. Remote estimation of crop chlorophyll content using spectral indices derived from hyperspectral data. IEEE Trans. Geosci. Remote Sens., 46(2): 423-437. https://doi.org/10.1109/TGRS.2007.904836
Hashmi, M.Z., A.Y. Shamseldin and B.W. Melville. 2011. Comparison of sdsm and lars-wg for simulation and downscaling of extreme precipitation events in a watershed. Stochastic Environ. Res. Risk Assess., 25(4): 475-484. https://doi.org/10.1007/s00477-010-0416-x
Hu, B., S.E. Qian, D. Haboudane, J.R. Miller, A.B. Hollinger, N. Tremblay and E. Pattey. 2004. Retrieval of crop chlorophyll content and leaf area index from decompressed hyperspectral data: The effects of data compression. Remote Sens. Environ., 92(2): 139-152. https://doi.org/10.1016/j.rse.2004.05.009
Kim, M.S., C. Daughtry, E. Chappelle, J. McMurtrey and C. Walthall. 1994. The use of high spectral resolution bands for estimating absorbed photosynthetically active radiation (a par). pp. 299-306.
Le Maire, G., C. Francois and E. Dufrene. 2004. Towards universal broad leaf chlorophyll indices using prospect simulated database and hyperspectral reflectance measurements. Remote Sens. Environ., 89(1): 1-28. https://doi.org/10.1016/j.rse.2003.09.004
Liao, Q., J. Wang, G. Yang, D. Zhang, H. Lii, Y. Fu and Z. Li. 2013. Comparison of spectral indices and wavelet transform for estimating chlorophyll content of maize from hyperspectral reflectance. J. Appl. Remote Sens., 7(1): 073575. https://doi.org/10.1117/1.JRS.7.073575
Li-Hong, X., C. Wei-Xing and Y. Lin-Zhang. 2007. Predicting grain yield and protein content in winter wheat at different n supply levels using canopy reflectance spectra. Pedosphere, 17(5): 646-653. https://doi.org/10.1016/S1002-0160(07)60077-0
Markwell, J., J.C. Osterman and J.L. Mitchell, 1995. Calibration of the minolta spad-502 leaf chlorophyll meter. Photosynth. Res., 46(3): 467-472. https://doi.org/10.1007/BF00032301
Moges, S., W. Raun, R. Mullen, K. Freeman, G. Johnson and J. Solie. 2005. Evaluation of green, red, and near infrared bands for predicting winter wheat biomass, nitrogen uptake, and final grain yield. J. Plant Nutr., 27(8): 1431-1441. https://doi.org/10.1081/PLN-200025858
Moran, J.A., A.K. Mitchell, G. Goodmanson and K.A. Stockburger. 2000. Differentiation among effects of nitrogen fertilization treatments on conifer seedlings by foliar reflectance: A comparison of methods. Tree Physiol., 20(16): 1113-1120. https://doi.org/10.1093/treephys/20.16.1113
Naqvi, S., M.N. Tahir, G.A. Shah, R.S. Sattar and M. Awais. 2018. Remote estimation of wheat yield based on vegetation indices derived from time series data of landsat 8 imagery. Appl. Ecol. Environ. Res., 17(2): 3909-3925. https://doi.org/10.15666/aeer/1702_39093925
Naqvi, S.M.Z.A., M. Awais, F.S. Khan, U. Afzal, N. Naz and M.I. Khan. 2021. Unmanned air vehicle based high resolution imagery for chlorophyll estimation using spectrally modified vegetation indices in vertical hierarchy of citrus grove. Remote Sens. Appl. Soc. Environ., 23: 100596. https://doi.org/10.1016/j.rsase.2021.100596
Richardson, A.D., S.P. Duigan and G.P. Berlyn. 2002. An evaluation of noninvasive methods to estimate foliar chlorophyll content. New Phytol., 153(1): 185-194. https://doi.org/10.1046/j.0028-646X.2001.00289.x
Rouse, J., R. Haas, J. Schell, D. Deering and J. Harlan. 1974. Monitoring the vernal advancement of retrogradation of natural vegetation, nasa/gsfc, type iii, final report. Greenbelt, pp. 371.
Sims, D.A. and J.A. Gamon. 2002. Relationships between leaf pigment content and spectral reflectance across a wide range of species, leaf structures and developmental stages. Remote Sens. Environ., 81(2-3): 337-354. https://doi.org/10.1016/S0034-4257(02)00010-X
Tahir, M.N., J. Li, B. Liu, G. Zhao, Y. Fuqi and C. Chengfeng. 2013. Hyperspectral estimation model for nitrogen contents of summer corn leaves under rainfed conditions. Pak. J. Bot., 45(5): 1623-1630.
Tahir, M.N., S.Z.A. Naqvi, Y. Lan, Y. Zhang, Y. Wang, M. Afzal, M.J.M. Cheema and S. Amir. 2018. Real time estimation of chlorophyll content based on vegetation indices derived from multispectral uav in the kinnow orchard. Int. J. Precis. Agric. Aviat., 1(1): 24-31. https://doi.org/10.33440/j.ijpaa.20180101.0001
Wu, C., Z. Niu, Q. Tang, W. Huang, B. Rivard and J. Feng. 2009. Remote estimation of gross primary production in wheat using chlorophyll-related vegetation indices. Agric. For. Meteorol., 149(6-7): 1015-1021. https://doi.org/10.1016/j.agrformet.2008.12.007
Yuan, W., S. Liu, G. Zhou, G. Zhou, L.L. Tieszen, D. Baldocchi, C. Bernhofer, H. Gholz, A.H. Goldstein and M.L. Goulden. 2007. Deriving a light use efficiency model from eddy covariance flux data for predicting daily gross primary production across biomes. Agric. For. Meteorol., 143(3-4): 189-207. https://doi.org/10.1016/j.agrformet.2006.12.001
Zhang, D.Y., H. Yang, C. Coburn and Z. Wong. 2014. Assessment of chlorophyll content using a new vegetation index based on multi-angular hyperspectral image data. Spectrosc. Spectral Anal., 34(6): 1599-1604.
To share on other social networks, click on any share button. What are these?


