

Protective Effects of Xingnao Enema on Blood-brain Barrier Disruption in a Rat Model of Intracerebral Hemorrhage


Protective Effects of Xingnao Enema on Blood-brain Barrier Disruption in a Rat Model of Intracerebral Hemorrhage
Kun Wang1,2, Yinglin Cui2, Xu Zhao2 and Changjiang Hu1*
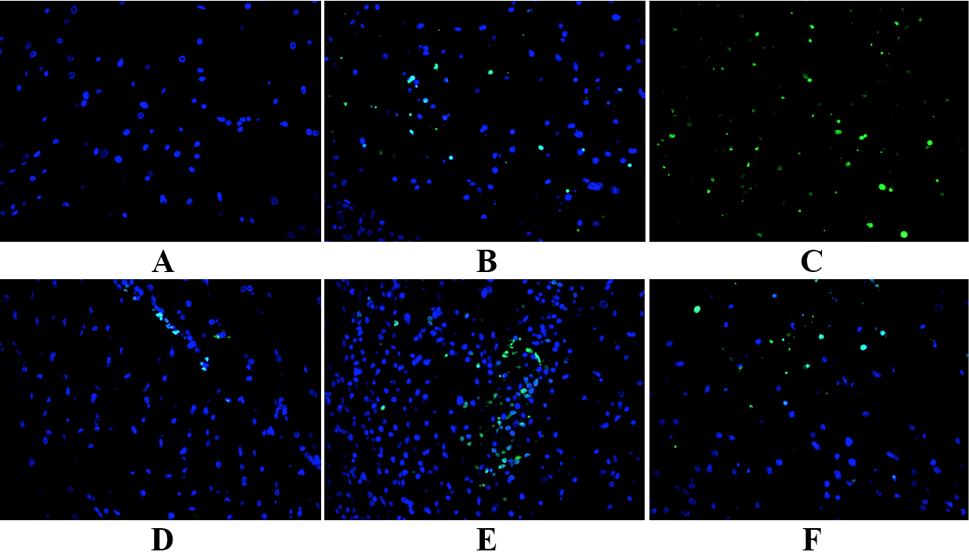
Effect of XN on neuronal apoptosis in hemorrhagic brain tissue of ICH rats. Under the fluorescence microscope, blue represents cell nuclei, green intensity represents apoptotic cells in the blank group (A), sham-operated group (B), model group (C), AGNH group (D) and XN-treated (low/high doses, E/F) groups. The two patterns were superimposed to determine the apoptosis. All images were taken at 400× magnification.
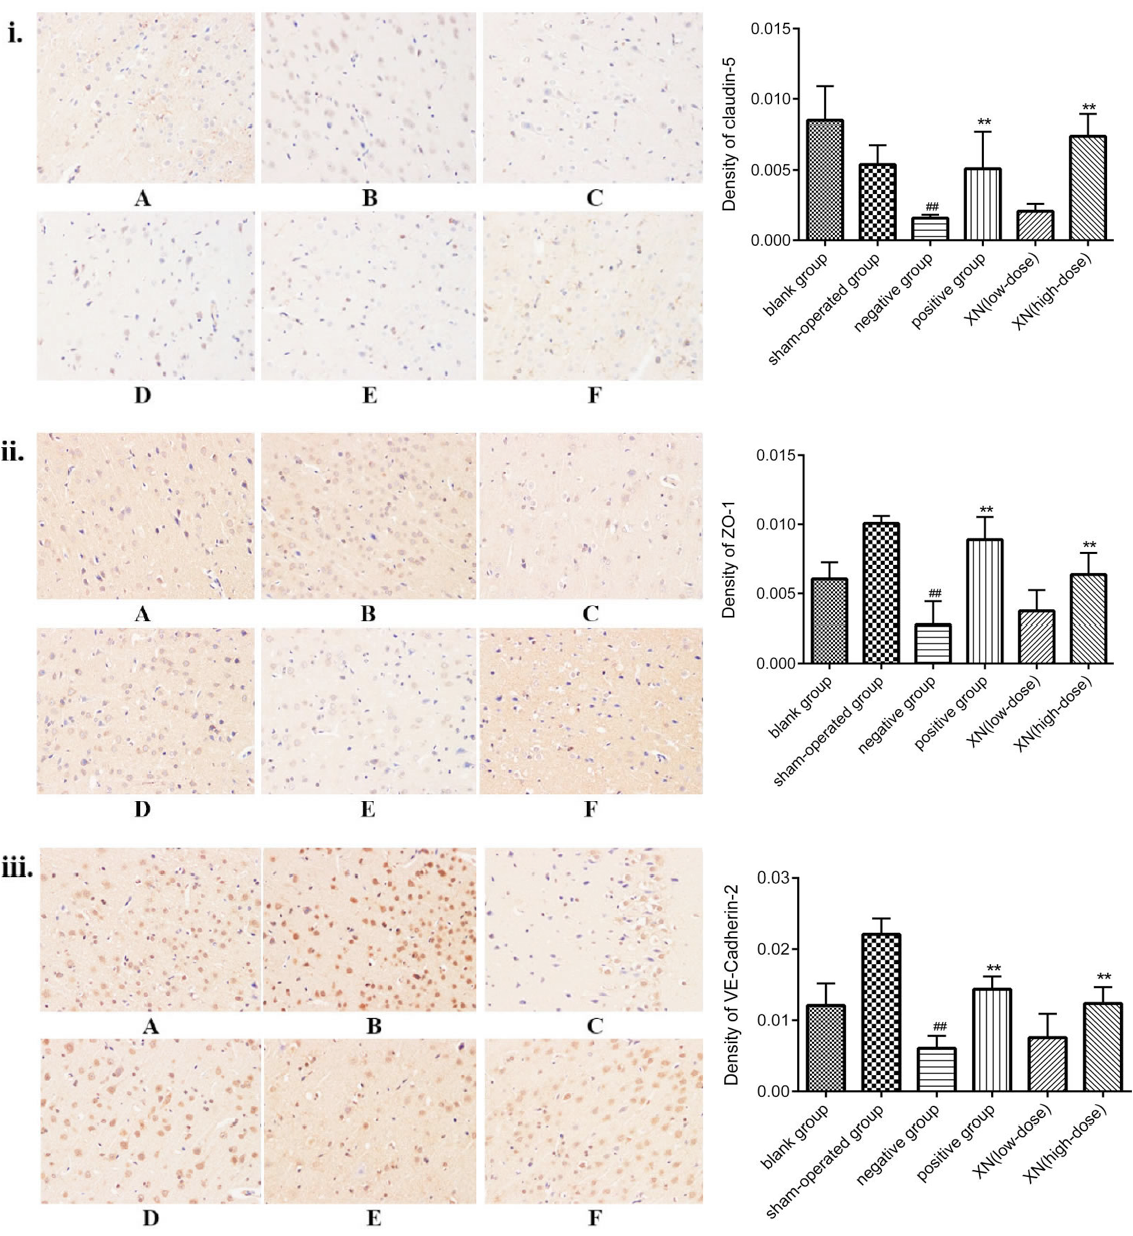
Expression alteration of claudin-5, ZO-1 and VE-cadherin protein by immunohistochemistry in ICH rat cortical regions in blank group (A), sham-operated group (B), model group (C), AGNH group (D), and XN-treated (low/high doses, E/F) groups. All images were taken at 400× magnification. (i) expression of claudin-5 protein in cortical regions of ICH rats; (ii) expression of ZO-1 protein in cortical regions of ICH rats; (iii) expression of VE-cadherin protein in cortical regions of ICH rats. The results are also expressed in bar graph showing density alteration of claudin-5, ZO-1 and VE-cadherin protein in cortical regions. Data represented as mean±SEM (#P<0.05, ##P<0.01, versus sham-operated group; *P<0.05, **P<0.01, versus model group); data analyzed from six independent experiments (n=6).
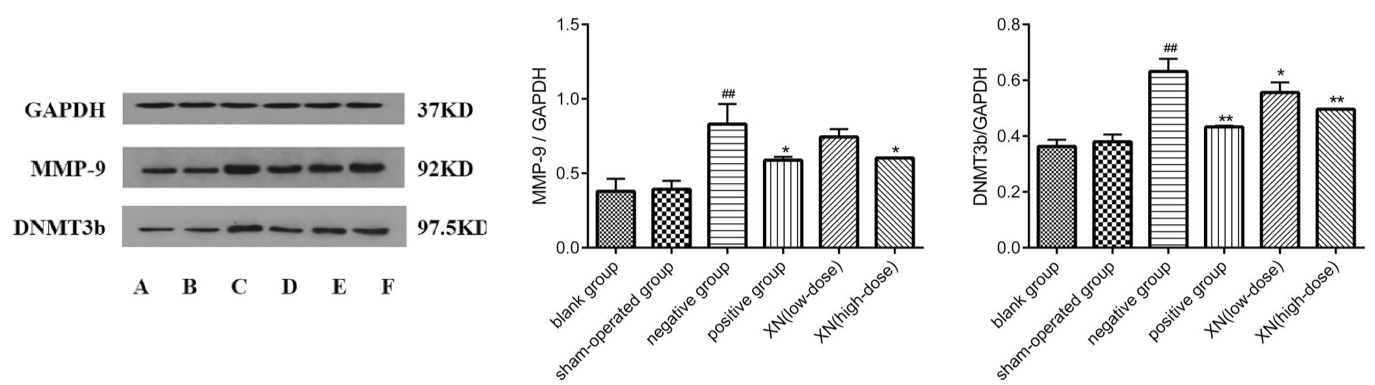
SDS-PAGE effect of XN on the expression of MMP-9 and DNMT3b in ICH rats. Western blot results showed expressions of MMP-9 and DNMT3b in blank group(A), sham-operated group (B), model group (C), AGNH group (D), and XN-treated (low/high doses, E/F) groups. Protein expressions are normalized with their respective glyceraldehyde 3-phosphate dehydrogenase (GAPDH) controls and the results are also represented in a bar graph showing MMP9 and DNMT3b band intensity, normalized with GAPDH band intensity. Data represent mean±SEM (#P<0.05, ##P<0.01, versus sham-operated group; *P<0.05, **P<0.01, versus model group); data analyzed from six independent experiments (n=6).
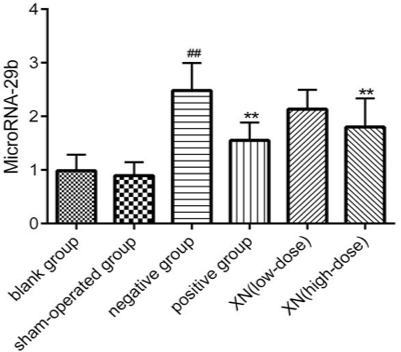
The effect of XN on the expression of microRNA-29b in ICH rats. Bar graph showing the change in microRNA-29b protein expression in the blank, sham-operated, model, AGNH group and XN-treated (low/high doses) groups. Data represented as mean±SEM (#P<0.05, ##P<0.01, versus sham-operated group; *P<0.05, **P<0.01, versus model group); data analyzed using six independent experiments (n=6).

Expression alteration of claudin-5, ZO-1 and VE-cadherin protein by immunohistochemistry in ICH rat hippocampus tissue in blank group (A), sham-operated group (B), model group (C), AGNH group (D), and XN-treated (low/high doses, E/F) groups. All images were taken at 400× magnification. (i) expression of Claudin-5 protein in hippocampus of ICH rats; (ii) expression of ZO-1 protein in hippocampus of ICH rats; (iii) expression of VE-cadherin protein in hippocampus of ICH rats. The results are also expressed in a bar graph showing the density alteration of claudin-5, ZO-1 and VE-cadherin protein in hippocampal tissue. Data are represented as mean±SEM (#P<0.05, ##P<0.01, versus sham-operated group; *P<0.05, **P<0.01, versus model group); data analyzed from six independent experiments (n=6).


