

Protective Effect of Buyang Huanwu Decoction on Diabetes-Induced Damage to Hippocampal Neurons by Regulating PI3K-AKT/Bcl-2 Pathway


Protective Effect of Buyang Huanwu Decoction on Diabetes-Induced Damage to Hippocampal Neurons by Regulating PI3K-AKT/Bcl-2 Pathway
Wei Cui1, Yanwei Du1, Lijuan Jiang1, Yan Wei1, Yuguo Li1, Wenfeng Zhang1* and Ling Zhang2*

Effect of BHD on PC12 cell viability, (A) and PC12 cell apoptosis (B). Apoptosis was detected by flow cytometry (C). Results are shown as the mean ± SD (n = 3); ** P<0.01, vs. the control group; ## P< 0.01, vs. the HG group. Con, control group; HG, 100 mmol/L high glucose group; BHD-H, 800 µg/mL BHD group; BHD-L, 400 µg/mL BHD group; Met, 2.0 mmol/L metformin group.

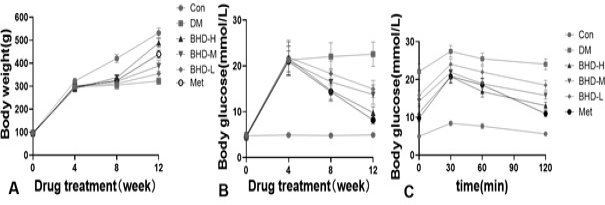
Effect of BHD on body weight (A), fasting blood glucose (B) and analysis of OGTT test in 8 weeks (C). Con, control group; DM, T2DM model group; BHD-H, 59.81 g/kg BHD group; BHD-M, 29.90 g/kg BHD group; BHD-L, 14.95 g/kg BHD group; Met, 89.25 mg/kg metformin group.

Effect of BHD on representative microscopical images of cerebral hippocampus (A), showing CA1 region from each group, (B) number of Bax, Bcl-2 (C), Bax/Bcl-2 (D), caspase-3 positive cells/field (E). Tissue sections of cerebral hippocampus CA1 region were stained with H & E and IHC (×200 magnification). ** P <0.01, vs. the control group; ## P < 0.01, vs. the DM group.

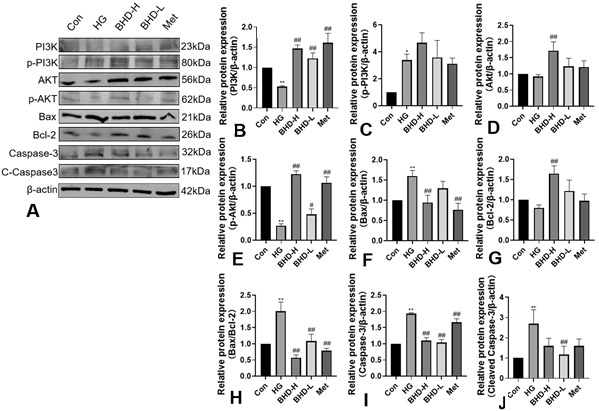
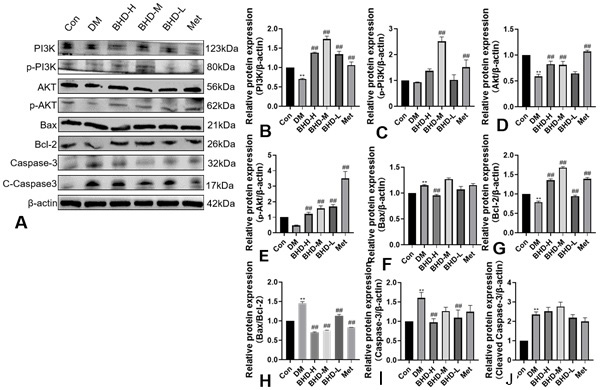
(A) BHD treatment inhibited STZ-induced apoptosis pathway in rats with DM. The density of PI3K, p-PI3K, AKT, p-AKT, Bax, Bcl-2, and Caspase-3 were measured by Western Blot. (B) Quantitative data of PI3K, (C) p-PI3K, (D) AKT, (E) p-AKT, (F) Bax, (G) Bcl-2, (H) Bax/Bcl-2, (I) Caspase-3, and (J) Cleaved Caspase-3 are presented. Data are shown as mean ± SD (n=3). ** P <0.01, vs. the control group; ## P < 0.01, vs. the DM group.


