

Production of Antibodies against Hepatitis C Virus Envelope Glycoprotein E2- A Potential Vaccine Against HCV Infection


Production of Antibodies against Hepatitis C Virus Envelope Glycoprotein E2- A Potential Vaccine Against HCV Infection
Gul Afshan1,2,*, Soumble Zulfiqar2, Sumaira Mehboob2, Muhammad Tahir Javed Khan1 and Abdul Rauf Shakoori2,*

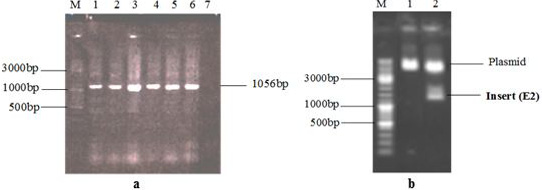
Agarose gel electrophoresis (a) PCR amplification of HCV3a E2 gene. Lanes 1-6, Amplified 1056bp E2 gene whereas lane 7 is E2 no template control. (b) Restriction analysis of pTG19-E2 with restriction enzymes EcoRI and BamHI. Lane 1, Single restriction of pTG19-E2 with restriction enzyme EcoRI. Lane 2, Restriction of pTG19-E2 with BamHI that cuts at both ends of the insert; 2.8kb digested vector releasing 1077bp band of E2 gene; Lane M, GeneRulerTMDNA ladder mix (Fermentas Cat # SM0331).
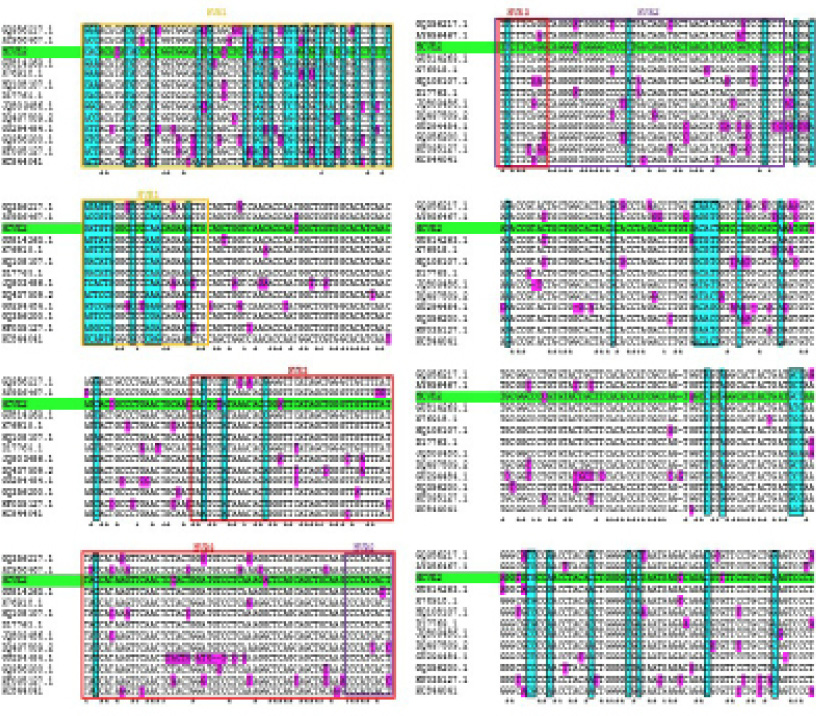
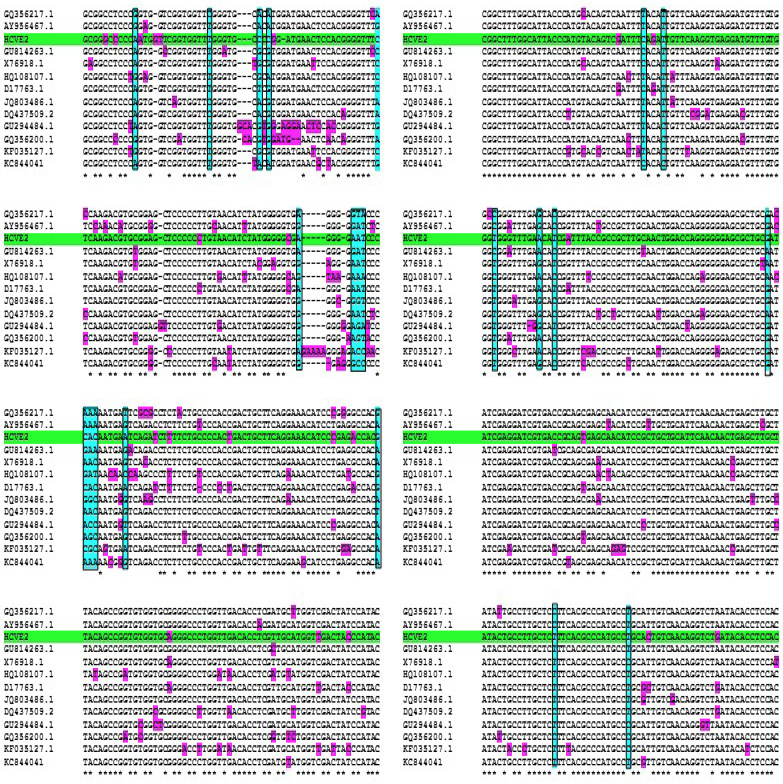
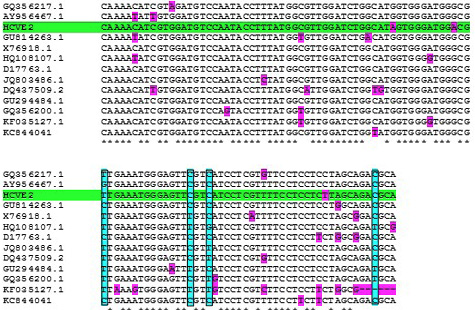
Multiple sequence alignment of HCV3a E2 (Green color) with already reported HCV3a E2 genomes of various countries on the basis of nucleotide sequence. Yellow box shows the HVR1; purple box shows the HVR2 and red box shows the HVR3. Blue color boxes shows general differences; Pink color boxes show specific differences; (*) shows nucleotide similarity among all the sequences.
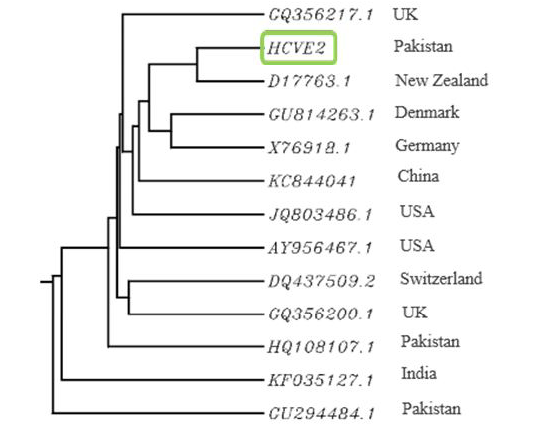
Rooted phylogenetic tree with branch length (UPGMA) of hepatitis C virus (HCV) genotype 3a isolates worldwide based on E2 nucleotide sequences.

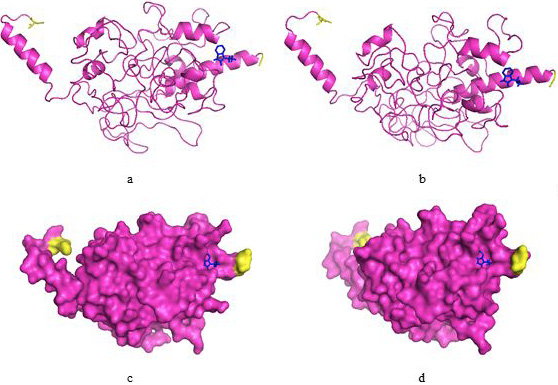
3D model of HCV3a E2 protein inferred through I-TASSER and COACH results. (a, b) Ribbon structure of E2 protein showing binding site residues in blue ball and stick. -NH2 and -COOH terminals are shown by yellow color; (c, d) Surface structure of E2 protein displaying two views.
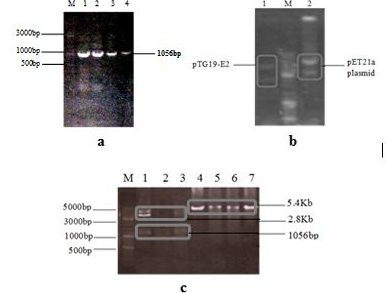
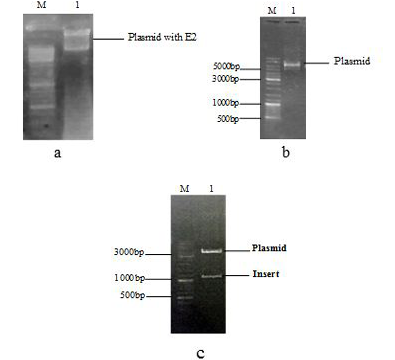
Cloning of HCV3a E2 gene with NdeI and HindIII restriction sites. (a) Lanes 1-4, Amplified gene E2 with NdeI and HindIII restriction sites. (b) Lane 1, Recombinant plasmid pTG19-E2; Lane 2, pET21a. (c) Lanes 1-3, Restricted pTG19-E2; Lanes 4-7, Restricted pET21a; Lane M, GeneRulerTMDNA ladder mix (Fermentas Cat # SM0331).

Construction of pET21a-E2 recombinant vector. (a) Lane 1, Isolated pET21a-E2 gene. (b) Lane 1, Single restriction of pET21a-E2 with NdeI. (c) Lane 1, Double restriction of pET21a-E2 with NdeI and HindIII restriction enzymes; Lane M, GeneRulerTMDNA ladder mix (Fermentas Cat # SM0331).
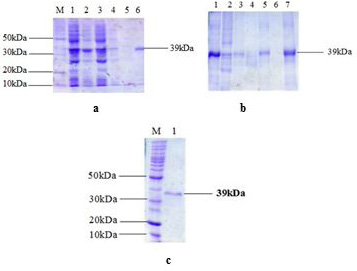
SDS-PAGE analysis. (a) HCV3a E2 protein expression in inclusion bodies. Lane 1, Uninduced E2 total cell lysate; Lane 2, Induced E2 total cell lysate; Lane 3, Uninduced E2 supernatant; Lane 4, Induced E2 supernatant; Lane 5, Uninduced E2 pellet; Lane 6, Induced E2 pellet. (b) Partial protein purification of HCV3a envelope glycoprotein E2 after fractional dialysis with urea. Lane 1, E2 protein expression; Lanes 2-7, Fractional dialysis with 6M, 4M, 3M, 2M, 1M and 0M urea, respectively. (c) HCV3a E2 purified protein at 39 kDa; Lane 1, E2 purified protein; Lane M, BenchMarkTM Protein ladder (Novex Cat # 10747-102).
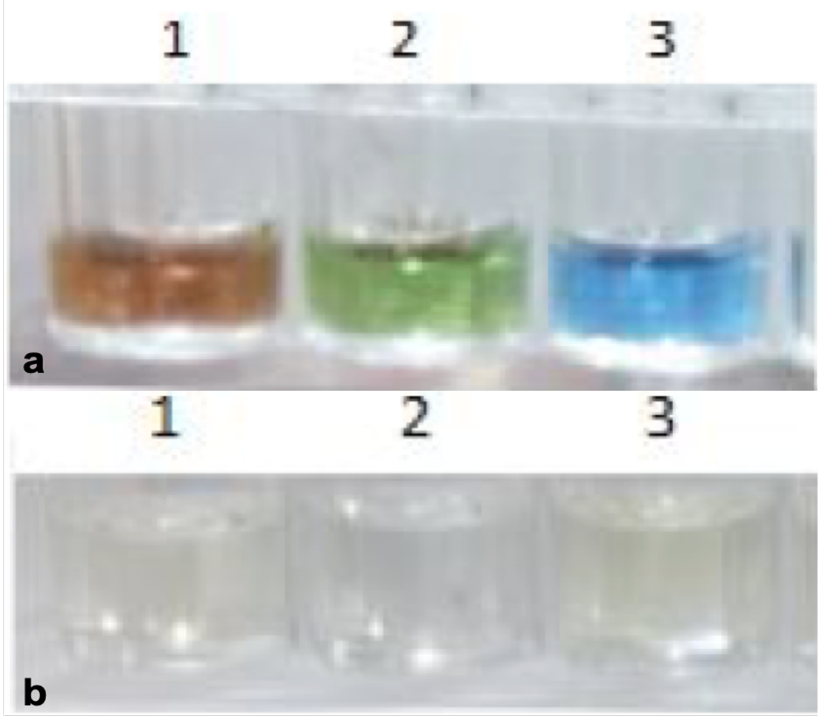
Confirmation of HCV E2 purified proteins through ELISA with HCV infected human sera. (a) Well 1 has positive, well 2 has negative and well 3 has E2 protein. (b) shows color change after adding stop solution.
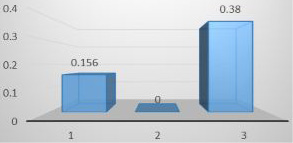
Analysis of ELISA of HCV3a E2 protein. Comparison of HCV3a positive control vs HCV3a E2 purified protein. Bar 1, HCV positive control; Bar 2, HCV negative control; Bar 3, HCV E2 purified protein.
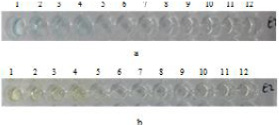
HCV3a E2 antibodies confirmation after ELISA. Wells 1-12 contain different dilutions ranging from 100% pure to 10 times serially diluted E2 antibodies. (a) Blue color after adding TMB substrate. (b) Color change from blue to yellow after adding 12.5% H2SO4 as stop solution.
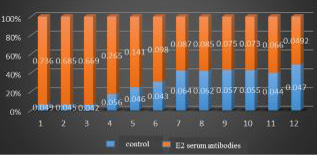
Comparison of control (preimmune sera) vs HCV3a E2 serum antibodies. Bars 1-12, Comparative analysis of preimmune sera with HCV3a E2 antibodies raised in response to E2 purified protein as antigen. The dilution ranges from 100% pure to 10 times serially diluted serum sample accordingly from bar 1 through 12.


