

Irrigation Stress to Wheat at Sensitive Growth Stages: Tri-trophic Effects and Implications for Aphid Control


Irrigation Stress to Wheat at Sensitive Growth Stages: Tri-trophic Effects and Implications for Aphid Control
Shahbaz Ahmed1, Mubeen Ahmad1, Muhammad Razaq1* and Farhan Mahmood Shah1,2*
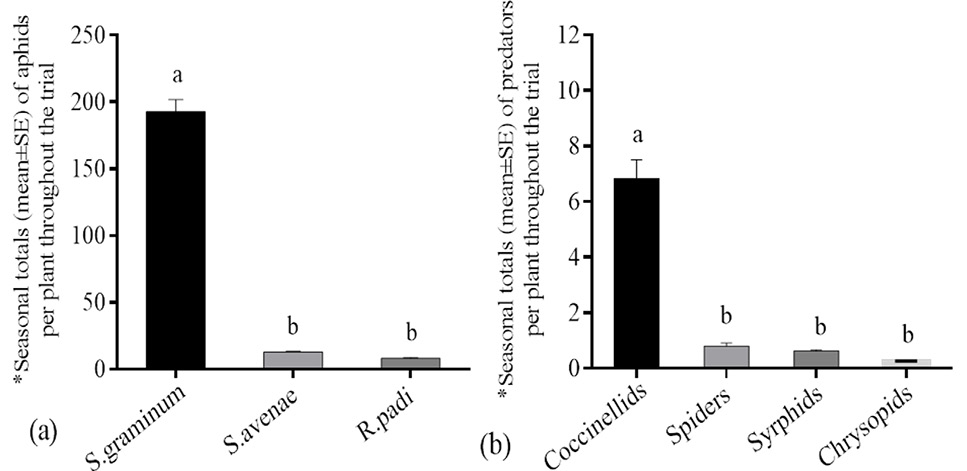
Total counts of wheat aphids (a) and natural enemies (b). The counts are based on data collection during 2019 from a wheat-trial, involving different stressed and unstressed stages of wheat crop as stress treatments. The field used for data collection was located at the University Farm in Multan, Pakistan. Bars topped with the same letter are not significantly different (P˃0.05; LSD test). *Total densities are the means of three replicates.

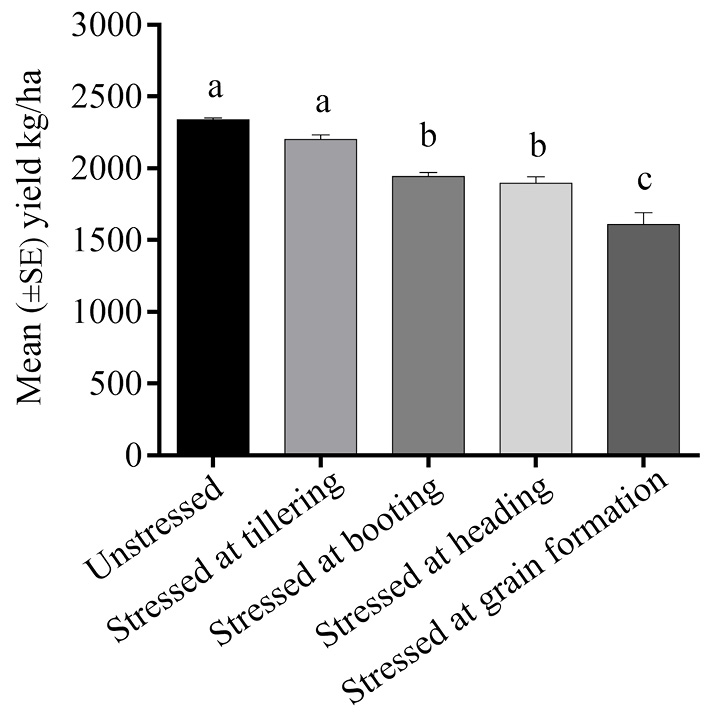
Wheat yield kg/ha from irrigation-stressed and unstressed wheat crop in the field at University farm in Multan, Pakistan, in 2019. Bars topped by the same letter are not significantly different (P˃0.05; LSD test).
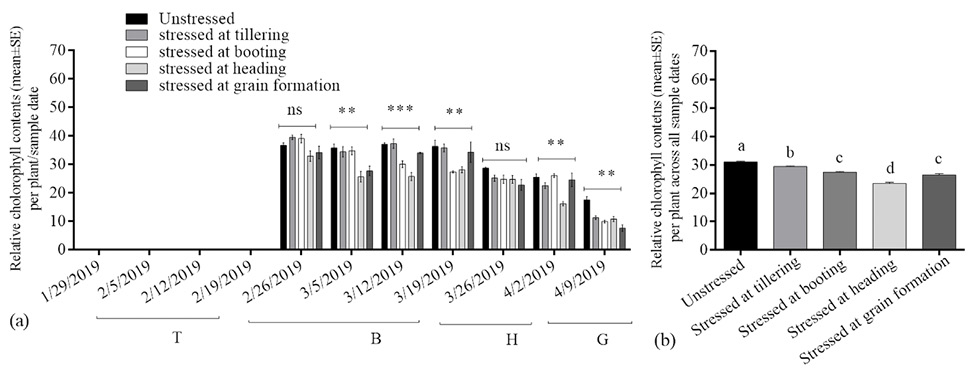
Mean chlorophyll contents per week (a); and their amount per season (b) per leaf from irrigation-stressed and unstressed wheat crop in the field at University farm in Multan, Pakistan, in 2019. Bars topped by the same letter are not significantly different (P˃0.05; LSD test). ns indicates non-significant difference. T: duration of tillering stage; B; duration of booting stage; H; duration of heading stage; G: duration of grain formation stage.

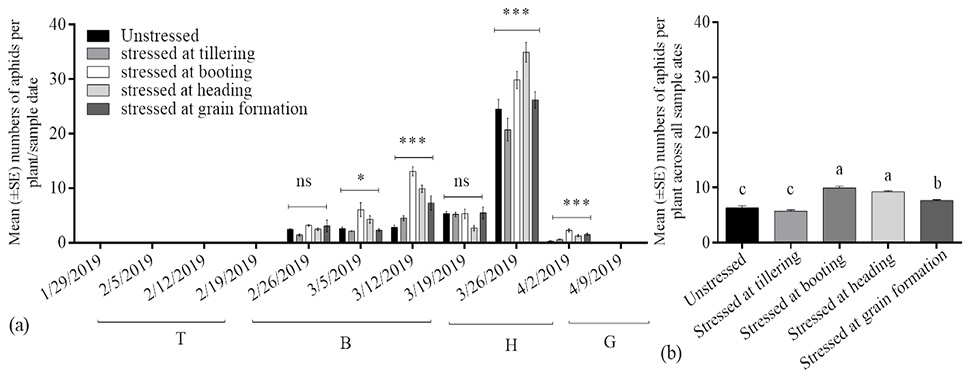
Aphid abundance per week (a); and their seasonal counts (b) per plant from irrigation-stressed and unstressed wheat crop in the field at University farm in Multan, Pakistan, in 2019. * and *** indicates significant difference at P<0.05 and P<0.001; ns indicates non-significant difference. Bars topped by the same letters are not significantly different (P˃0.05; LSD test). T: duration of tillering stage; B: duration of booting stage; H; duration of heading stage; G: duration of grain formation stage.

Predator abundance (a) and predator-prey ratio (b) per plant from irrigation-stressed and unstressed wheat crop in the field at University farm in Multan, Pakistan, in 2019. Predator data were pooled across species. Bars topped by the same letter are not significantly different (P˃0.05; LSD test).


