

Hepato-renal Toxicity of Patulin and its Modulation by Ginger (Zingiber officinale) in Rats


Hepato-renal Toxicity of Patulin and its Modulation by Ginger (Zingiber officinale) in Rats
Kadry A. El-Bakry1, Lamiaa E.M. Deef1*, Lotfy Z. Habbak1 and Samia S. El-Naeli2

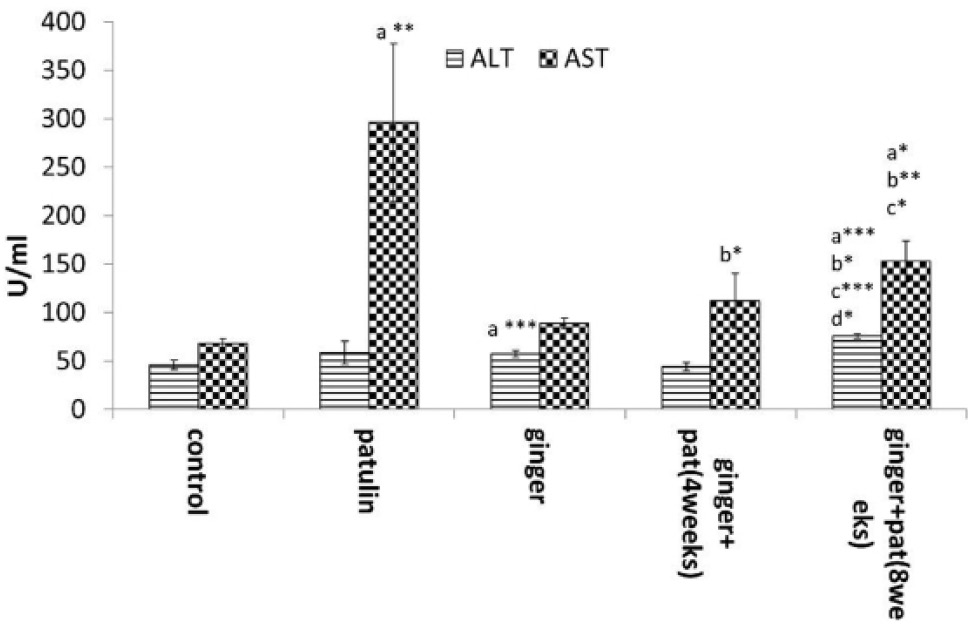
Serum alanine aminotransferase (ALT) and a separate aminotransferase (AST) activities U/ml in the experimental groups.
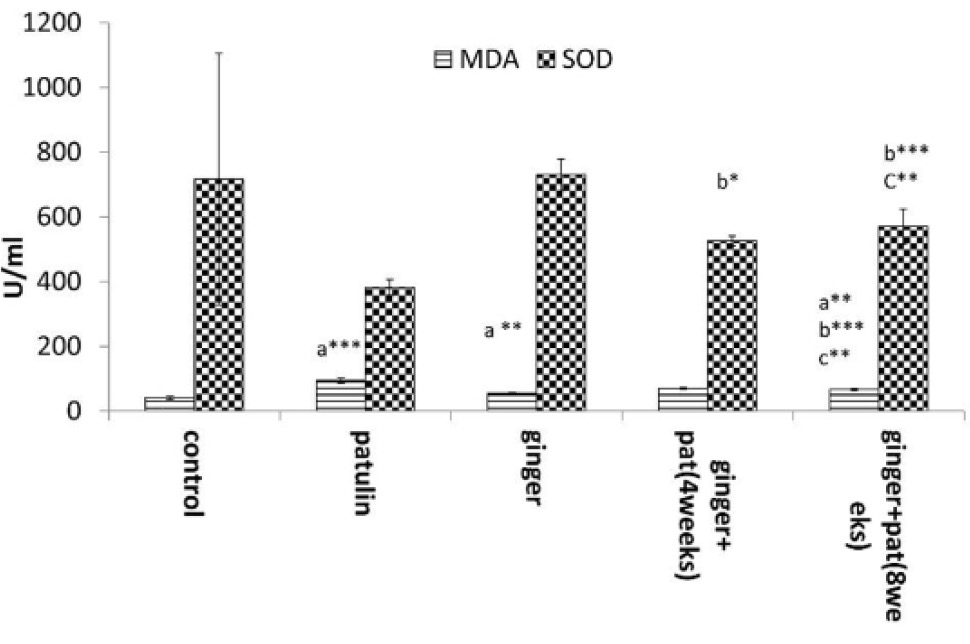
The hepatic superoxide dismutase (SOD) activity (U/ml) and malondialdehyde (MDA) (nM/ml) content in the experimental groups.
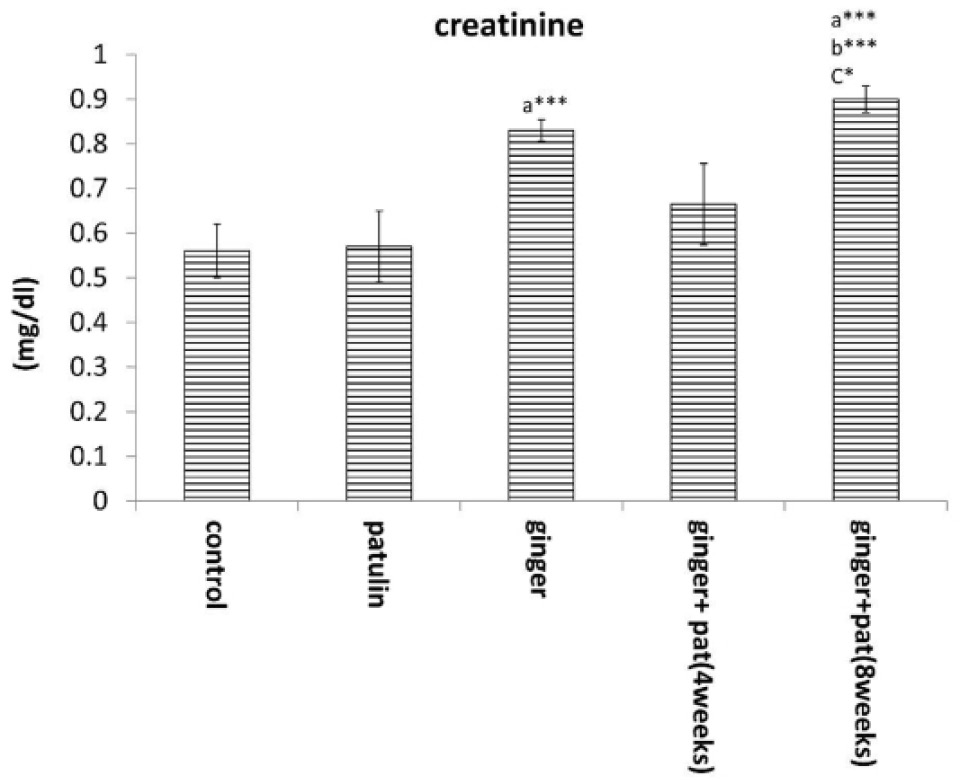
Mean of serum creatinine concentration (mg/dl) in the experimental groups.

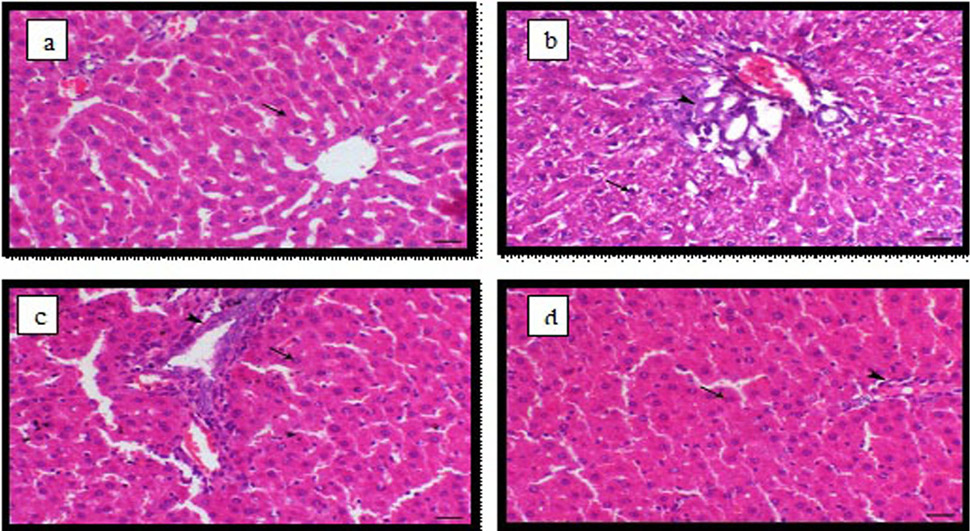
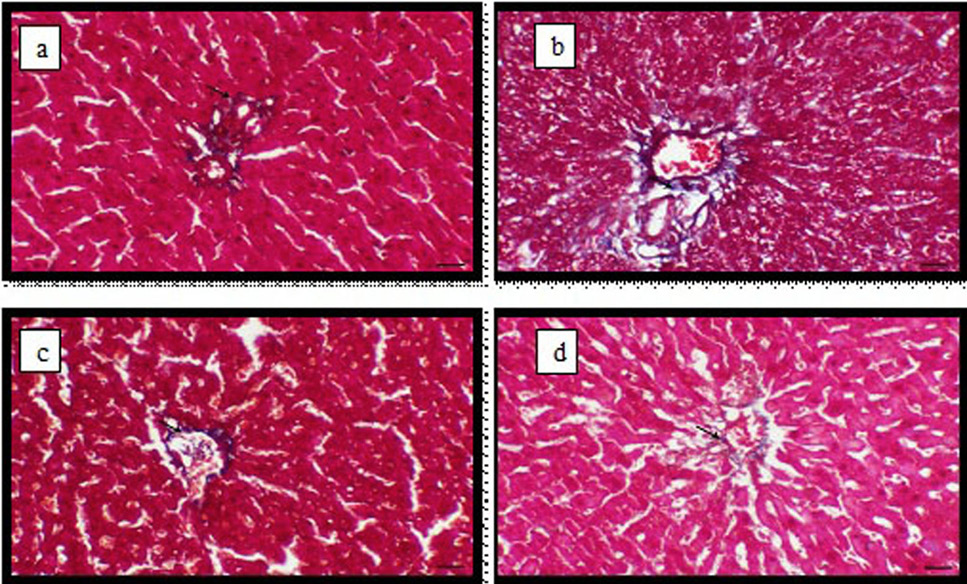
Light micrograph of liver, (a) control animals showing normal hepatocytes arranged in cords around the central vein (arrow); (b) PAT-treated animals showing periportal hepatic vacuolation with dark pyknotic nuclei (arrow) and bile duct proliferation (arrowhead); (c) PAT and ginger (4weeks) animal showing normals periportal hepatic cells (arrow) and mild hyperplasia of the lining epithelium of the bile duct (arrowhead) and (d) PAT and ginger animals (8 weeks) showing normal hepatic cells (arrow) and normal portal tissues (arrowhead), Haemotoxylin and Eosin stain, bar = 40 µm.

Light micrograph of liver, (a) control animals showing thin layer of periportal fibrous connective tissue (arrow); (b) PAT-treated animals showing increased the periportal fibrous connective tissue (arrow); (c) PAT and ginger (4weeks) animals showing thin layer of periportal fibrous connective tissue (arrow) and (d) PAT and ginger (8weeks) animals showing thin layer of periportal fibrous connective tissue (arrow), Masson’s trichrome staininig bar= 40 µm.

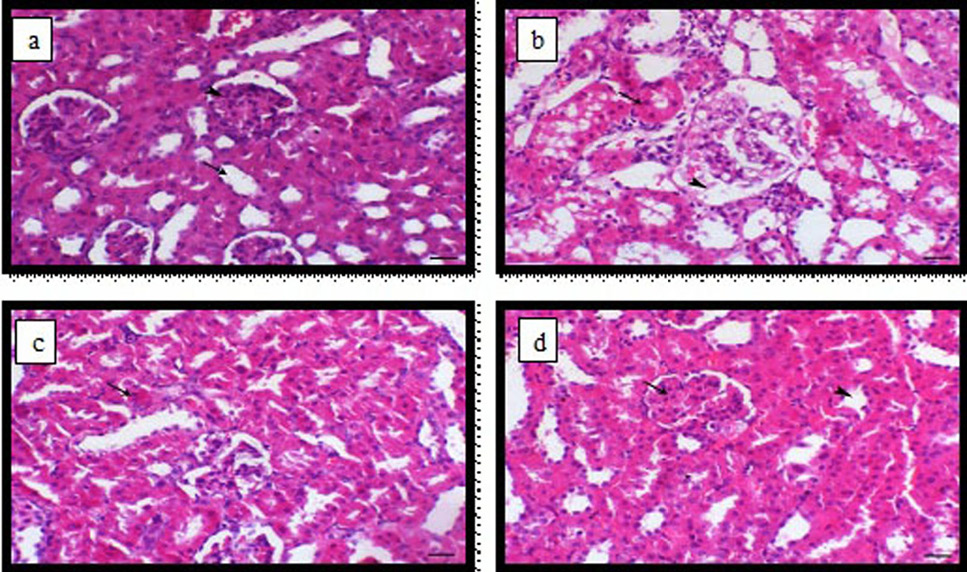
Light micrograph of kidney, (a) control animal showing normal renal glomeruli and tubules (arrow head and arrow respectively); (b) PAT-treated animal showing congestion of the glomerular tufts with oedema of the Bowman’s space (arrowhead) and degenerative changes within the renal tubular epithelium (arrow); (c) PAT and ginger-treated animal for 4 weeks showing mild to moderate degenerative changes within renal tubular epithelium (arrow) and (d) PAT and ginger treated animal for 8 weeks showing normal renal glomeruli and tubules (arrow and arrowhead respectively), Haemotoxylin and Eosin stain, bar= 40 µm.

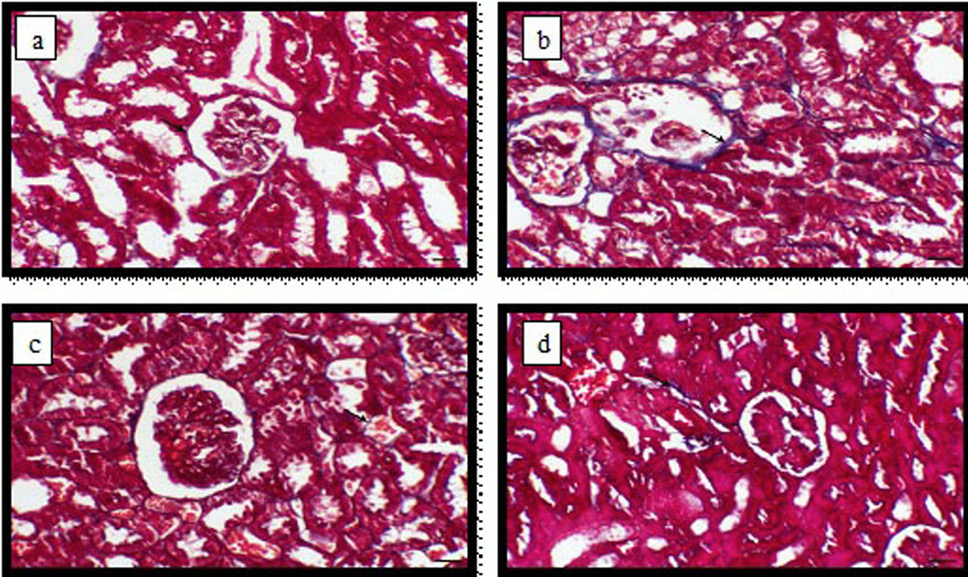
Light micrograph of kidney, (a) control animals showing thin layer of periglomerular and peritubular fibrous layer (arrow); (b) PAT -treated animals showing increased the thickness of the periglomerular and peritubular fibrous layer (arrow); (c) PAT and ginger -treated animals for 4 weeks showing thin periglomerular and peritubular fibrous layer (arrow) and (d) PAT and ginger -treated animal for 8 weeks showing thin perivascular layer of fibrous connective tissue (arrow), Masson’s trichrome stain, bar= 40 µm.


