

Hematological Indices, Nutrient Digestibility and Growth Performance of Catla catla Fingerlings Fed Citric Acid Supplemented Moringa oleifera Leaf Meal Based Diet


Hematological Indices, Nutrient Digestibility and Growth Performance of Catla catla Fingerlings Fed Citric Acid Supplemented Moringa oleifera Leaf Meal Based Diet
Majid Hussain1, Syed Makhdoom Hussain1,*, Razia Iqbal2, Arshad Javid3, Muhammad Mudassar Shahzad1,4 and Muhammad Zubair-ul-Hassan Arsalan1
1Fish Nutrition Lab, Department of Zoology, Government Collage University, Faisalabad
2Department of Zoology, University of Gujrat, Gujrat
3Department of Wildlife and Ecology, University of Veterniry and Animal Sciences, Lahore
4 Department of Zoology, Division of Science and Technology, University of Education Township Campus, Lahore
ABSTRACT
The study was conducted to investigate the effect of citric acid (CA) supplemented Moringa oleifera leaf meal (MOLM) based diets on hematological indices, nutrient digestibility and growth performance of Catla catla fingerlings. MOLM based diet was sub-divided into one control diet (0% CA) and five test diets, each supplemented with 1%, 2%, 3%, 4% and 5% CA, respectively. Chromic oxide as an inert marker was added in the diets to determine nutrient digestibility. The fingerlings were fed twice daily at the rate of 5 % of live wet body weight on their respective diets. Supplementation of CA in MOLM based diets significantly (p< 0.05) enhanced nutrient digestibility and growth performance of fingerlings as compared to control diet. Highest digestibility of crude protein (68.57%) was observed at 4% CA level, whereas highest digestibility of crude fat (72.23%) and gross energy (66.63%) was observed at 3% CA level. Fingerlings also showed maximum weight gain (WG), weight gain% (WG%), specific growth rate (SGR) and lower FCR value at 3% CA level. Hematological indices of fingerlings fed CA supplemented MOLM based diets were significantly (p< 0.05) improved as compared to control diet. Maximum number of RBC (2.98×106mm-3), WBC (7.91×103mm-3), PLT (66.59) and Hb (8.89 g/100ml), blood PCV (25.25%), MCHC (34.91%), MCH (55.88 pg) and MCV (187.67fl) were also found at 3% CA level. In conclusion CA at 3% level can be supplemented in MOLM based diet for improvement in nutrient digestibility, growth performance and hematological indices of C. catla fingerlings.
Article Information
Received 02 January 2017
Revised 24 July 2017
Accepted 04 May 2018
Available online 15 October 2018
Authors’ Contribution
MH collected data, compiled the results and performed analysis. SMH and RI supervised the research. RI help in Manuscript preparation. AJ interpreted the results. MMS performed feeding trials and collected the relevant data. MZHA compiled the results and performed chemical analysis.
Key words
Moringa, Citric acid, Growth, Nutrient digestibility, Hematological indices.
DOI: http://dx.doi.org/10.17582/journal.pjz/2018.50.6.2307.2315
* Corresponding author: drmakhdoom90@gmail.com
0030-9923/2018/0006-2307 $ 9.00/0
Copyright 2018 Zoological Society of Pakistan
Introduction
Global fish demand has been increased due to rapid increase in fish consumption and world population growth. The aquaculture expansion will help to meet the growing fish demand and relieve pressure on steadily declining capture fisheries (Tacon and Metian, 2013). Artificial feeds play major role in the successful intensive aquaculture and covers the major production cost of the system therefore improvement in the efficiency of aqua-feed is already a priority (Naylor et al., 2000; Borlongan and Satoh, 2001; Hussain et al., 2017). The essential nutrients required for fish are fatty acids, amino acids, minerals, vitamins and energy-yielding macronutrients. Diets given to the fish should supply required energy and all these essential nutrients and for proper nourishment and growth. The digestibility of nutrients present in diet affects aquaculture production and also influences the environment therefore available digestible energy and nutrients digestibility data of feed ingredients in fish diet is important for optimized feed formulation (NRC, 2011).
Fishmeal is an exceptional protein source in aqua-feed due to its high digestibility, palatability and excellent composition of essential amino acids (Olsen and Hasan, 2012). Annual fish oil and fishmeal production has not increased above 1.5 million tons per year since last 25 years therefore commercial aquaculture cannot continuously rely on limited marine pelagic fish stocks for fish oil and fishmeal supply (Turchini et al., 2009). In order to obtain economically sustainable, environment friendly and viable production researchers are evaluating unconventional protein sources predominantly from plant products such as leaves, seeds and other agricultural by-products due to their high protein contents (Richter et al., 2003; Abo-State et al., 2014).
Moringa oleifera is one of the potential protein sources for inclusion in aquaculture diets (Chiseva, 2006). Basically it is the most extensively cultivated plant species of genus Moringa, the only genus of family Moringaceae containing high crude protein (251 g/kg DM) in the leaves, with low content of tannins and other anti-nutritious compounds (Nouala et al., 2006). Because of the favorable amino acid profile and wide availability throughout the tropical and subtropical regions, moringa leaves and seeds can be regarded as a potential feed component of fish diet to make aquaculture production cost effective (Tagwireyi et al., 2014).
Efficiency of commercial fish farming can be determined from growth rate of fish which is very important index and depends upon number of factors. Some feeding trials conducted to determine the effect of citric acid (CA) acidified diets on growth and feed performance have shown encouraging responses (Sarker et al., 2005; Pandey and Satoh, 2008). CA enhances the phytase efficiency by providing an optimum gut pH which in turn increases the absorption of nutrients. CA also acts as antimicrobial agent and stimulates fish feed intake (Baruah et al., 2005; Shah et al., 2015).
Among various carp species of, C. catla, L. rohita and C. mrigala have high market value for their palatability. Even then, very minor work has been done for intensive farming of these species (Nandeesha et al., 2013). C. catla was selected in current study because of its ability of rapid growth, size, nutritional quality, taste, adaptability to climate and commercial importance in Pakistan (Wahab et al., 2002). Therefore the present study was conducted to investigate the effect of citric acid supplementation on hematological indices, growth performance and nutrient digestibility of C. catla fingerlings fed MOLM based diets.
Materials and Methods
Fish and experimental conditions
Experimental fish (C. catla) fingerlings were obtained from “Government Fish Seed Hatchery”, Faisalabad. Before starting the feeding trial, fingerlings were dipped in NaCl (5g/L) solution for specific time to make them free of ecto-parasites. The fingerlings were acclimatized in laboratory for 2 weeks time period in V-shape like water tanks particularly designed to collect fish fecal material. Throughout this time period fingerlings were fed once daily on basal diet to apparent satiation (Allan and Rowland, 1992). Physical parameters like temperature, dissolved oxygen, and pH were monitored on daily basis. Tap water was used during whole experiment.
Ingredients of feed and experimental diets formation
The ingredients of feed were procured from a commercial feed mill and their chemical composition was analyzed (AOAC, 1995) before the formulation of the test diets (Table I). The ingredients of feed were grinded finely to pass through (0.5 mm) mesh size. All Ingredients of feed (Table II) were mixed up for five minutes in a food-mixer and fish oil was added subsequently. Feed was sub-divided into one control (0%) 0g CA and five test diets, each having 5 kg weights supplemented with 1% (50g), 2% (100g), 3% (150g), 4% (200g) and 5% (250g) CA, respectively. 100 g feed per 85 ml of water was blended into the food-mixer to form suitable dough and pelleting machine was used to process this dough into pellets (Lovell, 1989).
Table I.- Ingredients composition (%) of diets.
|
Ingredients |
Test diet-I (control) |
Test diet-II |
Test diet-III |
Test diet-IV |
Test diet-V |
Test diet-VI |
|
MOLM |
35 |
35 |
35 |
35 |
35 |
35 |
|
Fish meal |
15 |
15 |
15 |
15 |
15 |
15 |
|
Soybean meal |
15 |
15 |
15 |
15 |
15 |
15 |
|
Wheat flour |
17 |
17 |
17 |
17 |
17 |
17 |
|
Rice polish |
8 |
8 |
8 |
8 |
8 |
8 |
|
Fish oil |
6 |
6 |
6 |
6 |
6 |
6 |
|
Vitamin premix |
1.0 |
1.0 |
1.0 |
1.0 |
1.0 |
1.0 |
|
Mineral premix |
1.0 |
1.0 |
1.0 |
1.0 |
1.0 |
1.0 |
|
Ascorbic acid |
1.0 |
1.0 |
1.0 |
1.0 |
1.0 |
1.0 |
|
Chromic oxide |
1.0 |
1.0 |
1.0 |
1.0 |
1.0 |
1.0 |
|
Citric acid level |
0 % |
1 % |
2 % |
3 % |
4 % |
5 % |
|
Total |
100.0 |
100.0 |
100.0 |
100.0 |
100.0 |
100 |
MOLM, Moringa leaf meal. Citric acid will be used at the expense of wheat flour.
Table II.- Analyzed composition of nutrients in MOLM based test diets.
|
Diets |
Crude protein (%) |
Crude fat (%) |
Gross energy (Kcal/g) |
|
|
Citric acid levels (%) |
||||
|
0 (Control diet) (Test diet I) |
29.81 |
4.47 |
2.92 |
|
|
1 (Test diet II) |
29.81 |
4.48 |
2.91 |
|
|
2 (Test diet III) |
29.81 |
4.48 |
2.91 |
|
|
3 (Test diet IV) |
29.81 |
4.47 |
2.92 |
|
|
4 (Test diet V) |
29.81 |
4.48 |
2.91 |
|
|
5 (Test diet VI) |
29.82 |
4.48 |
2.92 |
|
|
PSE |
0.05251095 |
0.04554192 |
0.02711457 |
|
|
p |
0.0055071 |
0.0107143 |
0.9978 |
|
Data are means of three replicates. PSE, pooled; l SE, √MSE/n (MSE, mean-squared error).
Feeding schedule and collection of sample
C. catla fingerlings were fed twice daily (8:00 am and 2:00 pm) on their respective diet @ of 5 % live wet body weight. Each test diet was used in three replicate and fifteen fingerlings were used in each replicate. After two hours feeding session, the unutilized diet from each tank was collected through the valves of tanks. The tanks were washed completely to remove diet particles and water was refilled in each tank. Three hours after the feeding session, feces were collected from each tank through fecal collection pipes using valves. Utmost care was done to avoid breakdown of fecal strings during fecal collection to make sure minimized nutrient leaching. Fecal material from each tank was oven dried at 60°C, completely grinded and stored in lab for chemical analysis. Fecal material (5g) was collected from each tank until the completion of 90 days feeding period.
Chemical analysis of feed and feces
The samples of feces, experimental diets and feed ingredients were homogenized separately by motor and pestle and were analyzed by standard procedures (AOAC, 1995). Crude protein (N × 6.25) was determined by micro kjeldahl apparatus; moisture by 12 h oven-drying at 105oC; crude fat using Soxtec HT2 1045 system through petroleum ether extraction method and gross energy by oxygen bomb calorimeter.
Estimation of chromic oxide
Chromic oxide as an inert marker was added in test diets to determine nutrient digestibility. Chromic oxide content after oxidation of the ash samples of feces and experimental diets with perchloric reagent was estimated by acid digestion method (Divakaran et al., 2002) through UV-VIS 2001 spectrophotometer at 350nm.
Digestibility calculation
ADC% (Apparent nutrient digestibility coefficients) for test diets were determined using standard formula (NRC, 1993):
ADC (%) = 100 – 100 × (% marker in diet ×
% minerals in faeces / % marker in faeces × %
minerals in diet)
Growth studies
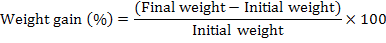
Fingerlings in each replicate were bulk weighed after the completion of experiment to determine the growth. Fish growth performance was determined using standard formulae:

Blood samples and hematological assay
Blood samples were taken from caudal vein by heparinized syringe and thereafter were taken to the Molcare Lab, Department of Biochemistry, University of Agriculture, Faisalabad, Pakistan for hematological analysis. Micro-hematocrit technique (Brown, 1980) was used to determined hematocrit by the help of capillary tubes. Red blood cells (RBC) and white blood cells (WBC) counts were determined with a haemo-cytometer with approved Neubauer counting chamber (Blaxhall and Daisley, 1973). Hemoglobin (Hb) concentration estimates were determined as described by Wedemeyer and Yastuke (1977). The following parameters were used to calculate: mean corpuscular hemoglobin concentration (MCHC); mean corpuscular hemoglobin (MCH) and mean cell volume (MCV) by using the following formulae:
MCHC = Hb/PCV × 100
MCV = PCV/RBC × 10
MCH = Hb/RBC × 10
Statistical analysis
At the end, growth performance, nutrient digestibility and hematology data were analyzed by one-way analysis of variance (Steel et al., 1996). Tukey’s Honesty Significant Difference Test was used to compare differences among treatments and considered significant at p<0.05 (Snedecor and Cochran, 1990). Statistical analysis was done using Co-Stat Computer Package (version 6.303, PMB 320, Monterey, CA, 93940 USA).
Table III.- Analyzed nutrients (%) in feces of C. catla fingerlings fed MOLM based diets.
|
Diets |
Crude protein (%) |
Crude fat (%) |
Gross energy (Kcal/g) |
|
|
Citric acid levels (%) |
||||
|
0 (Control diet) (Test diet I) |
16.31a |
2.09a |
1.72a |
|
|
1 (Test diet II) |
14.59b |
2.04a |
1.65a |
|
|
2 (Test diet III) |
11.80c |
1.51bc |
1.36b |
|
|
3 (Test diet IV) |
9.93d |
1.31d |
1.03c |
|
|
4 (Test diet V) |
9.96d |
1.34cd |
1.07c |
|
|
5 (Test diet VI) |
11.80c |
1.56b |
1.37b |
|
|
PSE |
0.17843972 |
0.03573933 |
0.02175699 |
|
|
p |
0.0000 |
0.0000 |
0.0000 |
|
Data are means of three replicates. PSE, pooled; l SE, √MSE/n (MSE, mean-squared error).
Table IV.- Apparent nutrients digestibility (%) of C. catla fingerlings fed MOLM based diets.
|
Diets |
Crude protein (%) |
Crude fat (%) |
Gross energy (Kcal/g) |
|
|
Citric acid levels (%) |
||||
|
0 (Control diet) (Test diet I) |
49.01d |
56.51c |
45.19c |
|
|
1 (Test diet II) |
54.56c |
57.70c |
47.31c |
|
|
2 (Test diet III) |
62.63b |
68.23b |
55.86b |
|
|
3 (Test diet IV) |
68.46a |
72.23a |
66.63a |
|
|
4 (Test diet V) |
68.57a |
71.79a |
65.49a |
|
|
5 (Test diet VI) |
63.13b |
67.52b |
56.19b |
|
|
PSE |
0.48523606 |
0.52493857 |
0.52480358 |
|
|
p |
0.0000 |
0.0000 |
0.0000 |
|
Data are means of three replicates. PSE, pooled; l SE, √MSE/n (MSE, mean-squared error).
Results
Tables II and III represent the nutrient percentage (crude protein, crude fat and gross energy) in test diets and feces. The result of nutrient digestibility % (Table IV) indicated that CA supplementation in MOLM based diets significantly (p< 0.05) enhanced the digestibility of crude protein, crude fat and gross energy compared to control diet. CA supplementation in MOLM based diets at 3% and 4% level showed significantly (p< 0.05) better crude protein, crude fat and gross energy digestibility compared to CA levels at 1%, 2% and 5%. Maximum digestibility of crude protein (68.57 %) was observed at 4% CA level followed by 3% CA level (68.46 %) in MOLM based diet. Maximum digestibility of crude fat (72.23) and gross energy (66.63) was observed at 3% CA level in MOLM based diet. Quadratic regression was used to estimate the effect of CA on various nutrient digestibility parameters. Value of R2 for crude protein digestibility (0.950), crude fat digestibility (0.850) and gross energy digestibility (0.800) revealed that more than 80 % of variation in above said parameters is explained by CA supplementation. Findings also revealed that optimum CA supplementation level is 3.59% for optimal crude protein digestibility (67.73%), optimum CA supplementation level is 3.68% for optimal crude fat digestibility (71.02%) and optimum CA supplementation level is (3.50%) for optimal gross energy digestibility (62.83). Regression curve revealed that crude protein digestibility of C. catla fingerlings was increased by increasing CA up to 4% level, further increase in CA% gradually decreased crude protein digestibility (Fig. 1).
Data for various growth parameters for C. catla fingerlings is presented in Table V. The results revealed that CA supplementation in MOLM based diets significantly (p< 0.05) enhanced overall growth performance of C. catla fingerlings as compared to fish fed on control diet. C. catla fingerlings showed significantly higher (p< 0.05) WG, WG% and SGR when fed 3% CA supplemented MOLM based diet. Significantly (p< 0.05) better FCR value (1.25) was also observed at 3% CA level in MOLM based diet. Quadratic regression was used to estimate the effect of CA on various growth performance parameters. Value of R2 for weight gain (0.701), weight gain% (0.701), FCR (0.838) and SGR (0.738) revealed that more than 70 % of variation in above said parameters is explained by CA supplementation. Findings also revealed that optimum level of CA supplementation was (3.14%) for WG, (3.15%) for WG%, (2.93%) for FCR and (3.09%) for SGR (Fig. 2).
Hematological parameters of C. catla fingerlings fed CA supplemented MOLM based diets significantly (p< 0.05) improved compared to control diet (Table VI). By increasing CA % in MOLM based diet, RBC, WBC, PLT and Hb also increased. Maximum number of RBC (2.98×106mm-3), WBC (7.91×103mm-3), PLT (66.59) and Hb (8.89 g/100ml), were observed in blood of fish fed 3% CA supplemented MOLM based diet. Fingerlings fed 2% CA supplemented MOLM based diet showed second best values for RBC (2.54×106mm-3), WBC (7.62×103mm-3), PLT (64.57), Hb (7.91g/100ml) compared to control and other CA supplemented diets. C. catla fingerlings fed 3% CA supplemented MOLM based diet also revealed significantly (p< 0.05) higher blood PCV (25.25%), MCHC (34.91), MCH (55.88 pg) and MCV (187.67fl) compared to control and other four CA supplemented diets.
Table V.- Growth performance of C. catla fingerlings fed MOLM based test diets.
|
Experimental diets |
Citric acid (%) |
Initial weight (g) |
Final weight (g) |
Weight gain (g) |
Weight gain (%) |
(Fish-1 day-1) g |
Feed intake |
FCR |
SGR |
|
Test diet-I (control diet) |
0 |
9.54 |
29.98a |
20.44d |
214.30d |
0.23d |
0.34ab |
1.50c |
1.27d |
|
Test diet-II |
1 |
9.55 |
30.94d |
21.39c |
223.95cd |
0.24c |
0.34ab |
1.45c |
1.31c |
|
Test diet-III |
2 |
9.54 |
32.05b |
22.51b |
236.05b |
0.25b |
0.33b |
1.33b |
1.35b |
|
Test diet-IV |
3 |
9.56 |
35.25a |
25.69a |
268.77a |
0.29a |
0.36a |
1.25a |
1.45a |
|
Test diet-V |
4 |
9.53 |
34.91a |
25.38a |
266.36a |
0.28a |
0.36a |
1.28ab |
1.44a |
|
Test diet-VI |
5 |
9.54 |
31.43c |
21.88c |
229.33bc |
0.24c |
0.35ab |
1.44c |
1.32bc |
|
PSE |
0.044 |
0.0774 |
0.1069 |
2.0523 |
0.0012 |
0.0047 |
0.0162 |
0.0068 |
|
|
P |
0.997 |
0.0000 |
0.0000 |
0.0000 |
0.0000 |
0.0072 |
0.0000 |
0.0000 |
|
Means within rows having different superscripts are significantly different at p< 0.05. Data are means of three replicates. PSE, pooled; SE, √MSE/n (MSE, mean-squared error).
Table VI.- Hematological parameters of C. catla fingerlings fed MOLM based test diets.
|
Diets |
RBC (106mm-3) |
WBC (103mm-3) |
PLT |
Hb (g/100ml) |
PCV (%) |
MCHC (%) |
MCH (pg) |
MCV (fl) |
|
|
Citric acid levels (%) |
|||||||||
|
0 (Control diet) (Test diet I) |
1.28d |
6.78d |
54.52d |
6.68d |
22.21d |
26.16e |
37.90f |
93.26f |
|
|
1 (Test diet II) |
1.90c |
7.14c |
61.32c |
7.25b |
23.20bc |
27.73d |
39.72e |
106.07e |
|
|
2 (Test diet III) |
2.54b |
7.62b |
64.57b |
7.91b |
25.09a |
32.26c |
42.19d |
185.17b |
|
|
3 (Test diet IV) |
2.98a |
7.91a |
66.59a |
8.89a |
25.25a |
34.91a |
55.88a |
187.67a |
|
|
4 (Test diet V) |
2.83ab |
7.78ab |
66.06a |
8.45ab |
23.48b |
33.84b |
53.82b |
182.66c |
|
|
5 (Test diet VI) |
1.73c |
7.24c |
61.78c |
7.52bc |
22.76c |
32.16c |
50.56c |
179.56d |
|
|
PSE |
0.07139 |
0.0654 |
0.0619 |
0.15192 |
0.0976 |
0.1083 |
0.0975 |
0.12777 |
|
|
P |
0.0000 |
0.0000 |
0.0000 |
0.0000 |
0.0000 |
0.0000 |
0.0000 |
0.0000 |
|
Data are means of three replicates. PSE, pooled; SE, √MSE/n (MSE, mean-squared error); WBC, white blood cell; RBC, red blood cell; PCV, packed cell volume; Hb, hemoglobin concentration; PLT, platelet; MCV, mean corpuscular volume; MCH, mean corpuscular hemoglobin; MCHC, mean corpuscular hemoglobin concentration.
Discussion
Acidified diets decrease the pH in the gastrointestinal tract, increase the hydrolysis of phytate which in turn release bound nutrients and minerals (Baruah et al., 2007; Lückstädt, 2008). Lower pH in gastrointestinal tract causes improved absorption of nutrients (Boling-Frankenbach et al., 2001). Present study also proved that CA supplementation in MOLM based diets significantly improved overall nutrient digestibility which in turn enhanced growth performance of C. catla fingerlings. Crude fat and gross energy digestibility were significantly higher at 3% CA level whereas crude protein digestibility was significantly higher at 4% CA level. Our results coincide with the findings of Baruah et al. (2007) who reported maximum nutrient digestibility at 3% CA inclusion in phytase treated diet. In contrary to our findings Hussain et al. (2015) reported significantly higher dry matter, crude protein, crude fat and gross energy with 5% CA inclusion level. Afzal et al. (2016) and Rabia et al. (2016) reported higher crude protein, crude fat and gross energy digestibility at 2% CA inclusion in phytase treated diet.
Study of growth is an important parameter of fish culture competence. Minute detail is known about acidifier use in diets of major carps (Asrar et al., 2016). The results of present study indicated that CA supplementation at 3% level in MOLM based diet significantly enhanced fish WG, WG%, SGR and lowered the FCR value. Our results are in line with the findings of Asrar et al. (2016) who also reported significantly (p<0.05) higher WG (352.65%), SGR (1.68%) and lower FCR (1.21) in C. mrigala fingerlings fed 3% CA supplemented canola meal based diet. Baruah et al. (2007) also reported better WG, SGR and FCR in L. rohita fingerlings fed 500 FTU kg-1 phytase treated diet supplemented with 3% CA level. In contrary to our results Afzal et al. (2016) reported higher WG and lower FCR at 2% CA level; whereas, Hussain et al. (2015) reported better WG, WG% and FCR at 5% CA level.
Hematological studies are necessary to access fish health and to check the quality of formulated diets (Schütt et al., 1997). Our results of hematological studies resembles with the study of Baruah et al. (2009) who revealed that dietary addition of CA at 3% level significantly (P <0.001) increased the blood Hb and Hct by 12.7 and 18.5 %, respectively. The results of present study revealed that CA addition in MOLM based diet had no adverse effects on fish health. Various hematological indices improved in fish blood due to diet acidification which is in agreement with Reda et al. (2016) who reported increased RBCs, WBCs, platelets, hemoglobin concentration, MCH and MCV counts in Oreochromis niloticus fed acidified diets. In contrary to our results Khajepour et al. (2011) revealed that diet acidification with CA had no significant (P>0.05) effect on WBCs, RBCs, MCV, MCH and MCHC. However, Hb concentration and Hct were significantly (P<0.05) higher at 3% CA level compared to control.
Conclusion
To conclude, acidification of MOLM based diets with CA significantly enhanced nutrient digestibility, growth performance and some hematological indices of fish compared to control diet. Best values of nutrient digestibility, growth performance and hematological parameters were observed at 3% CA level in MOLM based diet. So acidification at 3% CA level is recommended for production of cost effective MOLM based diets for C. catla fingerlings.
Statement of conflict of interest
Authors have declared no conflict of interest.
References
Abo-State, H., Hammouda, Y., El-Nadi, A. and Abo-Zaid, H., 2014. Evaluation of feeding raw moringa (Moringa oleifera Lam.) leaves meal in Nile tilapia fingerlings (Oreochromis niloticus) diets. Glob. Vet., 13: 105-111.
Afzal, M., Amanat, A., Shah, S.Z.H. and Hussain, S.M., 2016. Effect of acidification in a phytase sprayed sunflower meal based diet on growth and dietary nutrient digestibility performances of Labeo rohita juveniles. Pakistan J. Zool., 48: 1165-1169.
Allan, G.L. and Rowland, S.J., 1992. Development of an experimental diet for silver perch (Bidynus bidyanus). In: Austasia aquaculture magazine, 6th ed. AustAsia Aquaculture, East Victoria Park, W.A., pp. 39-40.
AOAC, 1995. Official methods of analysis, 15th Ed. Association of Official Analytical Chemists, Washington, D.C., USA, pp. 1094.
Asrar, M., Hussain, S.M., Tabassum, S., Hussain, I.H., Aslam, N., Arshsd, M., Shahzad, M.M., Hussain, M., Arsalan, M.Z. and Riaz, D., 2016. Effect of citric acid supplementation on growth parameters of Cirrhinus mrigala fingerlings fed canola meal based test diets. J. Biol. environ. Sci., 9: 381-389.
Baruah, K., Pal, A.K., Sahu, N.P., Debnath, D. and Yengkokpam, S., 2009. Dietary crude protein, citric acid and microbial phytase interacts to influence the hemato-immunological parameters of rohu, Labeo Rohita, juveniles. J. World Aquacul. Soc., 40: 824-831. https://doi.org/10.1111/j.1749-7345.2009.00304.x
Baruah, K., Pal, A.K., Sahu, N.P., Jain, K.K., Mukherjee, S.C. and Debnath, D., 2005. Dietary protein level, microbial phytase, citric acid and their interactions on bone mineralization of Labeo rohita (Hamilton) juveniles. Aquacul. Res., 36: 803-812. https://doi.org/10.1111/j.1365-2109.2005.01290.x
Baruah, K., Sahu, N.P., Pal, A.K., Jain, K.K., Debnath, D. and Mukherjee, S.C., 2007. Dietary microbial phytase and citric acid synergistically enhances nutrient digestibility and growth performance of Labeo rohita (Hamilton) juveniles at sub-optimal protein level. Aquacul. Res., 38: 109-120. https://doi.org/10.1111/j.1365-2109.2006.01624.x
Blaxhall, P.C. and Daisley, K.W., 1973. Routine haema-tological methods for use with fish blood. J. Fish Biol., 6: 771-781. https://doi.org/10.1111/j.1095-8649.1973.tb04510.x
Boling-Frankenbach, S., Snow, J., Parsons, C. and Baker, D., 2001. The effect of citric acid on the calcium and phosphorus requirements of chicks fed corn-soybean meal diets. Poult. Sci., 80: 783-788.
Borlongan, I. and Satoh, S., 2001. Dietary phosphorus requirement of juvenile milkfish, Chanos chanos (Forsskal). Aquacul. Res., 32: 26-32. https://doi.org/10.1046/j.1355-557x.2001.00003.x
Brown, B.A., 1980. Routine hematology procedures. In: Hematology: Principles and procedures. Lea & Febiger Publisher, pp. 71-112.
Chiseva, S., 2006. The growth rates and feed conversion ratios of fry fed conventional fry diets and Moringa oleifera supplemented diets. B. Sc. dissertation, Bindura University of Science Education, Zimbabwe.
Divakaran, S., Leonard, G.O. and Lan, P.F., 2002. Note on the methods for determination of chromic oxide in shrimp feeds. J. Agric. Fd. Chem., 50: 464-467. https://doi.org/10.1021/jf011112s
Hussain, S.M., Ahmad, N., Jabeen, F., Javid, A., Aslam, N., Hussain, M., Ahmad, S., Arsalan, M.Z., Riaz, D. and Shahzad, M.M., 2015. Effects of citric acid and phytase supplementation on nutrient digestibility and growth performance of Cirrhinus mrigala fingerlings fed on corn gluten (30%) meal based diets. Int. J. Biosci., 6: 82-91. https://doi.org/10.12692/ijb/6.7.82-91
Hussain, S.M., Hameed, T., Afzal, M., Javid, A., Aslam, N., Shah, S.Z.H., Hussain, M. and Shahzad, M.M., 2017. Growth performance and nutrient digestibility of Cirrhinus mrigala fingerlings fed phytase supplemented sunflower meal based diet. Pakistan J. Zool., 49: 1713-1724. http://dx.doi.org/10.17582/journal.pjz/2017
Khajepour, F., Hosseini, S.A. and Hoseini, S.M., 2011. Study on some hematological and biochemical parameters of juvenile beluga (Huso huso) fed citric acid supplemented diet. Glob. Vet., 7: 361-364.
Lovell, R.T., 1989. Nutrition and feeding of fish. Van Nostrand-Reinhold, New York, pp. 260. https://doi.org/10.1007/978-1-4757-1174-5
Lückstädt, C., 2008. Effect of organic acid containing additives in worldwide aquaculture-Sustainable production the non-antibiotic way. In: Acidifiers in animal nutrition. Context, Packington, UK, pp. 71.
Nandeesha, M.C., Sentilkumar, V. and Prabhu, P.A.J., 2013. Feed management of major carps in India, with special reference to practices adopted in Tamil Nadu. In On-farm feeding and feed management in aquaculture (eds. M.R. Hasan and M.B. New). FAO Fish. Aquacul. Tech. Pap. No., 583: 433-462.
Naylor, R.L., Goldburg, R.J., Primavera, J.H., Kautsky, N., Beveridge, M.C.M., Clay, J., Folke, C., Lubchenco, J., Mooney, H. and Troell, M., 2000. Effect of aquaculture on world fish supplies. Nature, 405: 1017-1024. https://doi.org/10.1038/35016500
Nouala F.S., Akinbamijo, O.O., Adewumi, A., Hoffman, S., Muetzel, S. and Becker, K., 2006. The influence of Moringa olifera leaves as substitute to conventional concentrate on the in vitro gas production and digestibility of groundnut hay. Livest. Res. Rural Develop., 18: Article #121. http://www.lrrd.org/lrrd18/9/noua18121.htm
NRC, 1993. Nutrient requirements of fish. National Research Council, National Academy Press, Washington, DC, pp. 114.
NRC, 2011. Nutritional requirements of fish and shrimp. National Research Council, National Acadamies Press, Washington.
Olsen, R.L. and Hasan, M.R., 2012. A limited supply of fishmeal: Impact on future increases in global aquaculture production. Trends Fd. Sci. Tech., 27: 120-128. https://doi.org/10.1016/j.tifs.2012.01.008
Pandey, A. and Satoh, S., 2008. Effects of organic acids on growth and phosphorus utilization in rainbow trout Oncorhynchus mykiss. Fish Sci., 74: 867-874. https://doi.org/10.1111/j.1444-2906.2008.01601.x
Rabia, S., Afzal, M. and Shah, S.Z.H., 2016. Nutrient digestibility performance by rohu (Labeo rohita) juveniles fed acidified and phytase pre-treated sunflower meal-based diet. J. appl. Anim. Res., 45: 331-335. https://doi.org/10.1080/09712119.2016.1190731
Reda, R.M., Mahmoud, R., Selim, K.M. and El-Araby, I.E., 2016. Effects of dietary acidifiers on growth, hematology, immune response and disease resistance of Nile tilapia, Oreochromis niloticus. Fish Shellf. Immunol., 50: 255-262.
Richter, N., Siddhuraju, P. and Becker, K., 2003. Evaluation of nutritional quality of moringa (Moringa oleifera Lam.) leaves as an alternative protein source for Nile tilapia (Oreochromis niloticus L.). Aquaculture, 217: 599-611. https://doi.org/10.1016/S0044-8486(02)00497-0
Sarker, S.A., Satoh, S. and Kiron, V., 2005. Supplementation of citric acid andmamino acid-chelated trace element to develop environment-friendly feed for red sea bream, Pagrus major. Aquaculture, 248: 3-11. https://doi.org/10.1016/j.aquaculture.2005.04.012
Schütt, D.A., Lehmann, J., Goerlich, R. and Hamers, R., 1997. Haematology of sword tail, Xiphophorus helleri. I: Blood parameters and light microscopy of blood cells. J appl. Ichthyol., 13: 83-89. https://doi.org/10.1111/j.1439-0426.1997.tb00106.x
Shah, S.Z.H., Afzal, M., Khan, S.Y., Hussain, S.M. and Habib, R.Z., 2015. Prospects of using citric acid as fish feed supplement. Int. J. Agric. Biol., 17: 1-8.
Snedecor, G.W. and Cochran, W.G., 1991. Statistical methods, 8th Ed. Iowa State University Press, Americans, USA, pp. 503.
Steel, R.G.D., Torrie, J.H. and Dickey, D.A., 1996. Principles and procedures of statistics, 3rd Ed. McGraw Hill international Book Co. Inc., New York, USA, pp. 336-352.
Tacon, A. and Metian, M., 2013. Fish matters: Importance of aquatic foods in human nutrition and global food supply. Rev. Fish. Sci., 21: 22-38. https://doi.org/10.1080/10641262.2012.753405
Tagwireyi, T., Mupangwa, J.F., Jepsen, J. and Mwera, P., 2014. The effect of feeding heat treated Moringa oleifera (lam) leaf meal on the growth performance of Oreochromis Niloticus (Lam) fry. UNISWA J. Agric., 17: 14-20.
Turchini, G., Torstensen, B. and Ng, W., 2009. Fish oil replacement in finfish nutrition. Rev. Aquacul., 1: 10-57. https://doi.org/10.1111/j.1753-5131.2008.01001.x
Wahab, M.A.M., Rahman, M. and Milstein, A., 2002. The effect of common carp, Cyprinus carpio (L.) and mrigal, Cirrhinus mrigala (Honil ton) as bottom feeders in Major-India carp poly-cultures. Aquacul. Res., 33: 547-556. https://doi.org/10.1046/j.1365-2109.2002.00654.x
Wedemeyer, G.A. and Yastuke, W.T., 1977. Clinical methods for the assessment of the effects of environmental stress on fish health. U.S. Fish Wildl. Serv. Tech. Pap., 89.
To share on other social networks, click on any share button. What are these?


