Growth and Yield Response of Turnip to Different Deficit Irrigation Levels and Sowing Dates under the Agro-Ecological Conditions of Khyber Pakhtuankhwa


Research Article
Growth and Yield Response of Turnip to Different Deficit Irrigation Levels and Sowing Dates under the Agro-Ecological Conditions of Khyber Pakhtuankhwa
Amjad Ali1, Awais Salman1, Gul Daraz Khan1, Aftab Ahmad Khan2, Sher Shah Hassan2*, Muhammad Arif Goheer2, Mahmood Alam Khan3 and Sajjad Ahmed3
1Faculty of Crop Production Sciences, The University of Agriculture-Peshawar, Khber Pakhtunkwa, Pakistan; 2Global Change Impact Studies Centre (GCISC), Ministry of Climate Change, Islamabad, Pakistan; 3Department of Agricultural Engineering, University of Engineering and Technology, Peshawar, KPK, Pakistan.
Abstract | Due to climate change, irrigated agriculture will take place under water-scarce conditions, at present and more so in the future. Inadequate water supply for irrigation will be the usual rather than the exception, and irrigation management will shift from emphasizing production per unit area towards maximizing the production per unit of water consumed. This field experiment was carried out to assess growth and yield responses of turnip to different deficit irrigation levels and sowing dates at Research Farm situated at The University of Agriculture, Peshawar. The experiment was laid out in Randomized Complete Block Design with a split-plot arrangement, using three replications. Irrigation levels (i.e. I1 (100%), I2 (90%), I3 (80%) and I4 (70%)) were used as main plot factor and two sowing dates i.e sowing date one (SD1) and sowing date two (SD2) were used as sub-plot factor. The soil moisture contents were determined through the gravimetric method. Results showed that different deficit irrigation levels and sowing dates significantly affected different growth parameters, yield, weight and harvest index of turnip. Maximum number of leaves per plant (19.16), leaf length (19.97 cm), leaf width (10.46 cm), plant height (39.27 cm), turnip length (17.24 cm), turnip diameter (7.84 cm), turnip yield (22.42 tons ha-1), turnip weight (256.62 gm) and harvest index (52.34 %) were recorded for I1. Maximum turnip length (18.09 cm), turnip diameter (7.69 cm), turnip yield (21.11 tons ha-1), turnip weight (304.22 gm) and turnip moisture content (93.62 %) were recorded for SD1. The interactive effect of different deficit irrigation levels with sowing dates were found significant for turnip length while maximum turnip length (19.79 cm) was recorded at the irrigation level of I1 with sowing SD1 and minimum turnip length (7.29) was were recorded for irrigation level of I4 with SD2. Any stress of irrigation ranges from 10 to 30 % significantly affected the growth like leaf length, its width and plant height.
Received | June 12, 2019; Accepted | March 13, 2020; Published | July 15, 2020
*Correspondence | Sher Shah Hassan, Global Change Impact Studies Centre (GCISC), Ministry of Climate Change, Islamabad, Pakistan; Email: shershah538@gmail.com
Citation | Ali, A., A. Salman, G.D. Khan, A.A. Khan, S.S. Hassan, M.A. Goheer, M.A. Khan and S. Ahmed. 2020. Growth and yield response of turnip to different deficit irrigation levels and sowing dates under the agro-ecological conditions of Khyber Pakhtuankhwa. Pakistan Journal of Agricultural Research, 33(3): 480-489.
DOI | http://dx.doi.org/10.17582/journal.pjar/2020/33.3.480.489
Keywords | Deficit irrigation, Split plot design, Irrigation levels, Soil moisture, Leaf length diameter height, Harvest index, Full irrigation
Introduction
The economy of Pakistan is mostly supported by agriculture. Around 68% of the population is involved in agriculture specifically or generally, in the production, handling and dissemination of major agriculture products. Agribusiness contributes around 18.9% of our Gross Domestic Products (GDP) by providing a living to the people of rural areas that is almost 68%. Out of the total cultivated area, almost 82 % or around 43.44 million acres are irrigated, while the remaining part, which is almost 9.78 million acres, is mostly dependent upon precipitation (Pakistan Economic Survey, 2017-18).
Turnip (Brassica Rapa) it belongs to the Cruciferous family. At the axil of the most elevated leaf, stem and branches of turnip originate and each branch ends in an inflorescence (Fehr et al., 1980; Chung et al., 2016). Globally, turnip is grown as a vegetable and for edible and industrial oil, which provides daily food intake in huge proportions in many regions of the world (Valle and Harmon, 1970; Soengas et al., 2011). In the year 2014 – 2015, the turnip was cultivated on 15, 167 hectares of area and the total share is 2.6 percent that gives total production of 262, 5070 tons in Pakistan. While in Khyber Pakhtunkhwa, the total share is 10 percent and the production is 18,890 kgha-1, which has a total share of 8 percent among all provinces (GoKP, 2016). Turnip trade is dominated by large winter supplies with smaller volumes supplied during summer. The winter supplies come from Punjab and to a lesser extent from Peshawar. In Khyber Pakhtunkhwa, turnip is extensively cultivated in Swat, mainly in Kalam and Malam Jabba. Swat supplies the crop in the early part of summer while in late summer is supplied from the other hilly areas particularly Mansehera and Parachinar (Khokhar, 2014). Turnips receive relatively good prices in the summer season and continue until the start of the regular supply season (Neilsen et al., 2008).
Sowing of fodder at optimum time produced higher green fodder and root yield whereas delayed sowing resulted in poor growth and yield (TİRYAKİOĞLU and Mevlüt, 2012). In turnip, crude protein levels contained in the root, leaf, dry matter per unit area-1 is higher as compared to forage grasses and cereals (Rao and Dao, 1987). The flesh of turnip is white, firm crisp and mildly sweet flavored, while the top is small, erect with cut leaves (Kumar et al., 2015). The Management Allowable Depletion of turnip is 20%, needs water frequently with an interval of 3 days. Furrow and basin irrigation are mostly used in common methods. In order to get an optimal yield, 300 – 350 mm of water should be applying seasonally. The crop coefficient values at different stages like the initial stage, crop developmental stage, mid-season stage and harvest stage is 0.50, 0.65, 1.08 and 1.00 respectively (Asao et al., 2005). The effect of five different sowing dates on three cultivars of Turnip gives significant results and give an optimal yield. (cv. Appin, York Globe and Green Globe), Comparison showed no differences among different sowing dates in thermal time (Collie and McKenzie, 1998).
Irrigating turnip to field capacity when plants wilted produced 41% higher leaf yields than no irrigated turnip (Afshar et al., 2012). Mustard (Brassica Juncea L.) and turnip produced higher leaf yields when irrigated at 25 kPa rather than at 50 or 75 kPa Soil Water Tension (Smittle et al., 1992). Water use rates increased quadratically with crop age and were higher with irrigation at 25 kPa than at 50 or 75 kPa soil Water Tension (Mazza and Miniati, 2018).
Due to Climate change and unpredicted rainfall conditions, Pakistan face problems in water availability that causes water deficit for irrigation purposes. To reduce the crop water requirement with reference to less evaporation from soil and plant surface (ETc) replaced with an alternative technique to delay the selected vegetable sowing. The delay by two weeks in the Rabi season expected to save enough water other than stressed conditions applied to the crop with no loss in yield. The delay in planting dates may prolong the crop period in the proposed study based on its significant effect. The purpose of the study is to determine the effect of different irrigation levels and sowing dates on the growth and yield parameters of turnip. The main aims of the study are i) The effect of deficit irrigation on growth and yield parameters of turnip, ii) The effect of sowing dates on growth and yield parameters of turnip and iii) The interactive effect of deficit irrigation and sowing dates on growth and yield parameters of turnip.
Study area
A field experiment was conducted to investigate the growth and yield responses of turnip to different deficit irrigation levels and sowing dates. The experiment was carried out at Research Farm situated at The University of Agriculture, Khyber Pakhtunkhwa, Peshawar Pakistan during the Rabi season 2016-2017. The site is located at 34.010 N and 71.280 E.
The climate of the area is similar to the interior of the sub-continent but in the region, precipitation does not follow the normal monsoon pattern. Instead, the area is characterized by long seasonal variation in rainfall and temperature. Peshawar is not a monsoon region, unlike other parts of Pakistan; however, rainfall occurs in both winter and summer. Due to western disturbances, the winter rainfall shows a higher record between the months of February and April. The highest amount of winter rainfall, measuring 236mm (9.3 in), was recorded in February 2007 while the highest summer rainfall of 402mm (15.8 in) was recorded in July 2010 during this month, a record-breaking rainfall level of 294mm (10.8 in) fell within a 24-hour period on 29 July 2010 the previous record was 187mm (7.4 in) of rain was recorded in April 2009. Winter rainfall levels are higher than that of summer. Based on a 30-year record, the average annual rainfall level was recorded as 400mm of rainfall (16 in) in Peshawar and the highest annual rainfall was recorded as in Kharif and Rabi seasons level of 904.5mm. The hottest month is that of June in which the temperature reaches 39˚C. January is the coldest month of the year in which the temperature drops to 0 ˚C at night. The winter rainfall is the result of cold fonts of air coming from the Hindu Kush region while summer rain is the result of the warm front of the Arabian sea (Shah et al., 2012).
Materials and Methods
Field preparation, layout and treatments
The experimental field was properly cultured and appropriately leveled before sowing for uniform application of water. For the improvement of soil and its physical properties, primary tillage was carried out to increases soil aeration and easy water penetration. A layout assigned to separate the area for various irrigation deficit levels and different sowing dates is shown in Figure 1.
SD: Sowing Dates; R: Replication; I: Irrigation.
The experiment was laid out in the Randomized Complete Block Design (RCBD) with split-plot arrangement with three replications. Four irrigation levels viz. 100%, 90%, 80% and 70% of irrigations in two different sowing dates (SD1 and SD2) The first sowing date in the study area was Nov 10 (SD1) while the second one was Nov 25 (SD2). The total area of the experimental field was 132 m2 having 12 main plots and 24 sub-plots, the area of each subplot was 2.4 m2, while the plant to plant distance was 20 cm and row to row distance was 40 cm.
Factor A: Irrigation levels
I1= 100 % of full irrigation; I2= 90 % of full irrigation; I3= 80 % of full irrigation; I4= 70 % of full irrigation.
Factor B: Sowing dates
SD1= Nov. 10; SD2= Nov. 25.
Bulk density and soil moisture content
To calculate bulk density, undisturbed soil samples were taken depth-wise with the help of core sampler from the research site. The soil samples were placed in the oven at 1050 C for 24 hours. The oven-dry samples were weighted and bulk density was determined by using the following formula (Equations 1, 2) (James, 1993).
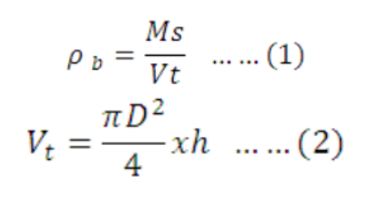
Where;
ρb is bulk density (g cm-3), Ms is the mass of oven-dried soil (g) and Vt is the total volume of soil sample (cm3). D is the diameter of the sampling ring (cm) and h is the height of the ring (cm).
The moisture content of the soil was determined through the gravimetric method. Soil samples were taken from two depth ranges i.e. 0 – 30 and 30 – 60cm. The samples were dried in an oven by keeping it for 24 hours at 1050 C. Soil moisture content percentage was calculated on volume basis suning the Equations 3 and 4 (Villholth et al., 1998);
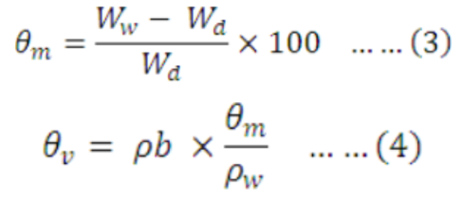
Where;
θm is soil moisture on a dry weight basis (%), Ww is the wet weight of soil sample (g) and Wd is oven-dry weight of soil (g). θv is soil moisture content on a volume basis (%), ρw is the density of water (g cm-3) and ρb is bulk density of soil (g cm-3).
Irrigation and volume of water needed
Based on the moisture contents required, the maximum available water in the root zone and the water applied was determined separately. The following formula (Equations 5, 6) were used to calculate the maximum available water and applied water in the root zone, (James, 1993):
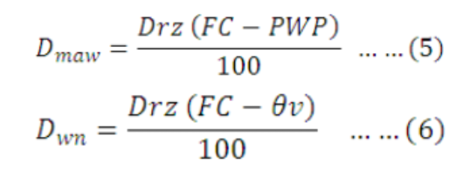
Where;
Dmaw is depth of maximum water available (mm), Drz is depth of root zone (mm), FC is field capacity on a volume basis (%) and PWP is permanent wilting point on volume basis (%). Dwn is the depth of water needed in the root zone (mm), Drz is root zone depth (mm), FC is field capacity on a volume basis (%) and θv is moisture content on volume basis (%).
The plots were irrigated through the volumetric method. In this method, irrigation was applied on a volume basis to each plot and the volume of water applied was obtained from cubic meter. To calculate the total volume of water needed per subplot the following formula (Equation 7) was used;
Where;
V is the total volume required per plot (m3), A is area of the plot (m2) and Dwn is depth of water needed (mm).
Data collection
The data on the parameters of were the number of leaves per plant, plant height, leaf length, leaf width, root yield, root length, root weight, root diameter, moisture content, and Harvest index were collected from the each treatment.
Number of leaves, leaf length, leaf width and plant height: At maturity level, leaves of five plants were randomly selected from each subplot. The average number of leaves per plant was then calculated. From each subplot in each replication, five plants were selected randomly and leaf length (cm) was measured. The plant height of each selected five plants from each subplot was recorded at full maturity of crop after harvesting. The plant height of turnip was measured from the base of the tip of the plant to the shoot of a leaf the plant. Plant height was calculated randomly and the average was taken. The height was measured in centimeters.
Root length, diameter, weight and yield: After harvesting of the crop, five turnip plants were randomly selected from each subplot and turnip length was measured. The diameter (cm) of selected five turnip was also taken after harvesting of the crop. For the measurement of turnip weight (g), five randomly selected turnips were weighted and the average weight was then calculated from that values. The yield (tons/ha) of all harvested turnip per subplot was calculated.
Turnip moisture content and harvest index: Turnip moisture content was measured from five randomly selected turnips from each subplot. The turnip moisture content was measured using equation 8 after drying the turnip in the oven, at 700 C for 72 hours.
Where;
M is turnip moisture content (%), Ww is wet weight of turnip (g) and Wd is oven-dry weight of turnip (g).
Harvest index was calculated from the following relationship;
Statistical analysis
The data were analyzed by using Statistix 8.1 software and analysis of variance techniques appropriate for randomized complete block design were applied. Least Significant Difference (LSD) test was applied to find significant differences among the treatments (Steel and Torrie, 1980).
Results and Discussion
The data collected on soil moisture, vegetative growth and yield and yield components for all the threatments (Irrigations levled and sowing dates) was statictically analysed. The detailed results were discussed below.
Number of leaves per plant (No)
The effect of sowing dates and the interactive effect of both irrigation and sowing dates found to be non-significant on the number of leaves per plant of turnip crop as shown in Figure 2a. Statistically, the maximum number of leaves per plant 19.16 was observed at 100 % of full irrigation (I1), while the minimum number of leaves 14.50 was observed at 70 % of full irrigation (I4). With the increase level of deficit irrigation, a vital role-played by moisture on the life of leaf at the rate of leaf initiation in the reduction in the number of leaves per plant. The findings of the present study showed similarities with the findings of Biswas et al. (2010) and Kaleri et al. (2016).
Leaf length (Cm)
Leaf length was significantly affected by different deficit irrigation levels while sowing dates and the interaction of both irrigation and sowing dates have a non-significant effect on leaf length of turnip as shown in Figure 2b. The mean data indicates that at 100 % of full irrigation (I1), we’re having a higher value of leaf length (19.97 cm), while the lowest value of leaf length (15.69 cm) recorded at 70 % of full irrigation (I4). Leaf length reductions due to deficit irrigation was also reported by Lanari et al. (2015). His results show that leaf number, shoot elongation and leaf area could be affected by the reduction in the availability of water up to 40 % of daily evapotranspiration and it could be a limiting factor for shoot and leaf growth Rowe and Neilsen (2016) also noted significant decrease in leaf length due to decrease in irrigation water availability.
Leaf width (cm)
The effect of irrigation was found significant for leaf width of turnip, but the effect of sowing dates was found non-significant for leaf width of turnip. The interactive effect of both irrigation and sowing dates were also found non-significant for leaf width of turnip. Mean data as shown in Figure 3a indicates that maximum leaf width (10.46 cm) was recorded for 100 % of full irrigation (I1) and the minimum value of leaf width (7.20 cm) was observed for 70 % of full irrigation (I4). A decrease of 37 % was recorded between 100 % of full irrigation (I1) and 70 % of full irrigation (I4) in leaf width of turnip crop. The water stress significantly reduced leaf width due to the reduced cell division. The findings of the current study are in similarities with the findings of Guendouz et al. (2016) and Romero et al. (2004).
Plant height (cm)
The data regarding plant height (cm) of turnip as affected by different deficit irrigation levels and sowing dates is shown in Figure 3b. The interactive effect of both irrigation and sowing dates and the effect of sowing dates were found non-significant for plant height of turnip. Results show that at 100 % of full irrigation (I1) maximum plant height (39.27 cm) was recorded but at 70 % of full irrigation (I4) minimum value of plant height (34.45 cm) recorded. The results show similarities with the finding of Zheng et al. (2013) and Nouri et al. (2016) who observed that water-stressed condition can cause a reduction in plant height. Cell wall synthesis, expansion of cell wall and the effect of cell division can cause a decrease in plant growth (Schuppler et al., 1998). The shorter plant height could be due to lower cell division and lower expansion of cell wall and this is mainly due to the reduction in the amount of Readily Available Water, so the plants start exerting more pressure to draw water when stress condition is applied.
Turnip length (cm)
Figure 4a shows the length of turnip as affected by different deficit irrigation levels and sowing dates. The table shows that the highest turnip length (17.24 cm) was obtained at 100 % of full irrigation (I1), while the lowest root length (11.34 cm) as affected by irrigation levels is recorded for 70 % of full irrigation (I4). Similarly, sowing dates also have a significant effect on the length of turnip, the highest value of turnip length (18.09 cm) was obtained at sowing date one (SD1), while the lowest length of turnip (10.95 cm) was recorded for sowing date two (SD2). Moreover, the interaction of both irrigation and sowing dates also changed the length of turnip, the maximum turnip length (19.79 cm) was obtained at 100 % of full irrigation (I1) with the interaction of sowing date one (SD1) and the minimum turnip length data (7.10 cm) was recorded at 80 % of full irrigation (I3) with the interaction of sowing date two (SD2). The results of the current study are correlated with the results of TİRYAKİOĞLU and Mevlüt (2012) who observed that delaying in sowing time could cause a decrease in root length.
Turnip diameter (cm)
The effect of irrigation and sowing dates were found significant for the diameter of turnip, while the interactive effect of both irrigation and sowing dates was found non-significant for the diameter of turnip as shown in Figure 4b. Results show that at 100 % of full irrigation (I1) the maximum value of turnip diameter (7.84 cm) was recorded. The minimum value for turnip diameter (6.42 cm) was obtained at 70 % of full irrigation (I4). Different sowing dates have also a significant effect on the diameter of turnip, a maximum value of turnip diameter (7.69cm) was observed for sowing date one (SD1), while the minimum value of turnip diameter (6.57 cm) was recorded for sowing date two (SD2).
According to Ashraful et al. (2013), sowing dates have a significant effect on the diameter of root. The diameter of the root could be progressively decreased with the advance of the sowing date. The findings of the present study are in consequence with the findings of Bazai et al. (2015) who studied the effect of trickle and furrow irrigation on yield of turnip.
Turnip yield (t/ha)
Results show that there was a significant effect of different irrigation levels and sowing dates on total turnip yield, whereas the interactive effect of both the irrigation and sowing dates found non-significant for a total yield of the turnip. Table 1 shows that at 100 % of full irrigation (I1) maximum turnip yield (22.42 tons ha-1) was recorded, however, at 70 % of full irrigation (I3) minimum turnip yield (13.85 tons ha-1) was obtained. The maximum turnip yield was recorded for sowing one (SD1) and was (21.11 tons ha-1), while the minimum turnip yield (14.81 tons ha-1) was recorded for sowing date two (SD2).
Table 1: Mean values of Turnip Yield (tons ha-1) as affected by different irrigation levels and sowing dates.
| Irrigation level | Sowing dates | Mean | |
|
SD1 |
SD2 |
||
|
I1 |
26.05 | 18.78 | 22.42 |
|
I2 |
22.49 | 14.93 | 18.71 |
|
I3 |
20.40 | 13.33 | 16.86 |
|
I4 |
15.50 | 12.21 | 13.85 |
| Mean | 12.11 | 14.81 | |
LSD value at 5% level of significance for irrigation= 3.16; for sowing date= 3.38.
The findings of the current study are similar to the findings of Carvalho et al. (2014), their results show that deficit irrigation can decrease yield to a greater extent. The findings of the present study can also be correlated to the observation of Kashyap and Panda (2003) who stated that due to the reduction in the availability of water, fresh tuber yield reduced considerably. Similarly, the results of the study are consistent with the result of Uikey et al. (2015) who observed that reduction in total root yield in late sown crop could be due to lesser yield attributes viz. number of leaves and leaf area and poor translocation of photosynthetic towards the roots. Higher yield in early sowing could be due to the cumulative effects of a greater number of leaves, higher plant height and higher leaf area.
Turnip weight (g)
Table 2 shows the results of turnip weight affected by deficit irrigation levels and sowing dates. Results show that the interactive effect of both sowing dates and irrigation were found non-significant for turnip weight. The highest turnip weight (256.62 gm) was observed for full irrigation (I1) while the lowest turnip weight (188.32 gm) was recorded for 70 % of full irrigation (I4). Similarly, turnip weight (gm) was significantly affected by sowing dates. High turnip weight (304.22 gm) was recorded for sowing date one (SD1) and the lowest turnip weight (134.50 gm) was observed for sowing date two (SD2). The results of the present study are inconsistent with the findings of Lavanya et al. (2017) and Onder et al. (2005).
Table 2: Mean values of Turnip Weight (gm) affected by different irrigation levels and sowing dates.
| Irrigation level | Sowing dates | Mean | |
|
SD1 |
SD2 |
||
|
I1 |
328.37 | 184.87 | 256.62 |
|
I2 |
308.47 | 141.87 | 225.13 |
|
I3 |
296.67 | 118.07 | 207.37 |
|
I4 |
283.37 | 93.27 | 188.32 |
| Mean | 304.22 | 134.50 | |
LSD value at 5% level of significance for irrigation: 38.97; for sowing date: 24.83.
Turnip moisture content (%)
Sowing dates have a significant effect on the moisture content of turnip, while irrigation and the interactive effect of both irrigation and sowing dates have a non-significant effect on turnip moisture content (Table 3). The highest turnip moisture content value (93.62 %) was recorded for sowing date one (SD1), while the lowest value of turnip moisture content (93.08 %) was recorded for sowing date two (SD2). The findings of the present study showed resemblances with the findings of El-Sherbeny et al. (2012) and Yücel (1992).
Table 3: Mean values of turnip moisture content (%) affected by different irrigation levels and sowing dates.
| Irrigation level | Sowing dates | Mean | |
|
SD1 |
SD2 |
||
|
I1 |
93.80 | 93.42 | 93.61 |
|
I2 |
93.34 | 93.14 | 93.24 |
|
I3 |
93.64 | 92.99 | 93.32 |
|
I4 |
93.71 | 92.79 | 93.25 |
| Mean | 93.62 | 93.08 | |
LSD value at 5 % of significance for sowing Dates: 0.50
Harvest index (%)
A significant effect of irrigation levels was found on harvest index of turnip crop while sowing dates and the interaction of both irrigation and sowing dates showed a non-significant effect (Table 4). The maximum harvest index (52.34 %) was recorded for 100% of full irrigation (I1) while the minimum harvest index (35.30 %) was observed for 70% of full irrigation (I4). The difference in harvest index of turnip crop between 100% of full irrigation and 70% of full irrigation was 13.68 percent. Due to high dry matter accumulation of the crop the harvest index decreases with the increase in the stress level of irrigation. Such a trend has also been observed for tomato in other studies (Birhanu and Tilahun, 2010).
Table 4: Harvest Index (%) of Turnip crop as affected by different irrigation levels and sowing dates.
| Irrigation level | Sowing dates | Mean | |
|
SD1 |
SD2 |
||
|
I1 |
52.07 | 52.61 | 52.34 |
|
I2 |
47.97 | 47.67 | 47.82 |
|
I3 |
40.55 | 40.04 | 40.29 |
|
I4 |
39.37 | 31.24 | 35.30 |
| Mean | 42.89 | 44.99 | |
LSD value at 5 % of significance for irrigation: 4.14.
The overall results showed that any stress of irrigation ranging from 10 to 30% significantly affected the growth like leaf length, width, and plant height. Only 10% of irrigation reduction did not affect the number of leaves per plant. It also did not affect turnip length and diameter, whereas irrigation reduction of 20% and 30% significantly affected turnip length and diameter. The 10% and 20% of irrigation stress did not affect the individual turnip weight while 30% irrigation affectedturnip weight as well. As far as the yield per ha is concerned, it wassignificantly affected by any irrigation stress used in the experiment. As far as sowing dates is concerned, growth parameters like leaf length, width and plant height are not affected by sowing dates. Sowing dates SD1 did not affect the leaf length, width and Plant height while Sowing dates SD2 significantly affected turnip length, turnip diameter, individual turnip weight and yield per ha. The interaction of I4SD1 affected turnip length significantly while the interaction of I2SD1, I3SD1 did not affect turnip length. The interaction of I3SD2 and I4SD2 also significantly affected turnip length.
Conclusions and Recommendations
Choosing the most appropriate irrigation level and sowing date ever remined one of the key concerns in crop management inorder to optimize crop growth and productivity. This study provides new information about the effect of different irrigation levels and sowing dates on yield and yield components of turnip under the agro-ecologicl conditions of Peshawar, Khyber Pakhtunkhwa. The study reported that delay in sowing have significantly reduced the turnip yields. Similarly, even a 10% reduction in full irrigation have significant effect on the productivity. The study necessaies the need of early sowing in the month of November with full irrigation levels.
Authors Contribution
Amjad Ali and Awais Salman: Experimental plot designing and Data Collection.
Gul Daraz Khan: Methodology, Supervision and Data Analysis.
Aftab Ahmad Khan: Data Analysis and collection.
Sher Shah Hassan: Draft and review writing and editing, Correspondence with journal.
Muhammad Arif Goheer: Proof Reading, Manuscript structuring and reviewing.
Mahmood Alam Khan and Sajjad Ahmed: Draft writing.
Conflict of interest
The authors have declared no conflict of interest.
References
Afshar, R.K., M. Chaichi, H. Moghadam and S. Ehteshami. 2012. Irrigation, phosphorus fertilizer and phosphorus solubilizing microorganism effects on yield and forage quality of turnip (Brassica rapa L.) in an arid region of Iran. Agric. Res., 1(4): 370-378. https://doi.org/10.1007/s40003-012-0039-1
Asao, T., H. Kitazawa, K. Washizu, T. Ban and M. Pramanik. 2005. Effect of different nutrient levels on anthocyanin and nitrate-N contents in turnip grown in hydroponics. J. Appl. Hortic, 72(2): 87-89.
Ashraful, K., A. Ali, M. Waliullah, M.M-U. Rahman and A. Rashid. 2013. Effect of spacing and sowing time on growth and yield of carrot (Daucus carrota L.). Int. J. Sustainable Agric., 5: 29-36.
Bazai, N.A., M. Tahir, M. Zhu, L. Shah and A. Ali. 2015. Effect of trickle and furrow irrigation methods with water saving and turnip yield. Acad. Res. J. Agric. Res., 3(6): 121-127.
Birhanu, K. and K. Tilahun. 2010. Fruit yield and quality of drip-irrigated tomato under deficit irrigation. Afr. J. Food, Agric., Nutr. Dev., 10(2): Pages. https://doi.org/10.4314/ajfand.v10i2.53356
Biswas, S., A. Khair and P. Sarker. 2010. Yield of onion and leaf purple blotch incidence as influenced by different levels of irrigation. Agric. Trop. Subtrop., 43: 2.
Carvalho, D., A. Domínguez, D.O. Neto, J. Tarjuelo and A. Martínez-Romero. 2014. Combination of sowing date with deficit irrigation for improving the profitability of carrot in a tropical environment (Brazil). Sci. Hortic., 179: 112-121. https://doi.org/10.1016/j.scienta.2014.09.024
Chung, I.M., K. Rekha, G. Rajakumar and M. Thiruvengadam. 2016. Production of glucosinolates, phenolic compounds and associated gene expression profiles of hairy root cultures in turnip (Brassica rapa ssp. rapa). 3 Biotech, 6(2): 175. https://doi.org/10.1007/s13205-016-0492-9
Collie, B. and B. McKenzie. 1998. Dry matter accumulation of three turnip (Brassica campestris L.) cultivars sown on five dates in Canterbury. Pap. Present. Proc. Agron. Soc. N. Z.
El-Sherbeny, S.E., S. Hendawy, A. Youssef, N. Naguib and M. Hussein. 2012. Response of turnip (Brassica rapa) plants to minerals or organic fertilizers treatments. J. Appl. Sci. Res., 8(2): 628-634.
Fehr, W.R., H.H. Hadley, R.K. Downey, A.J. Klassen and G.R. Stringam. 1980. Rapeseed and Mustard. ACSESS Publ.
GoKP. 2016. Ministry of food and agriculture (Economic Wing). http://kp.gov.pk/uploads/2018/05/CROP_STATISTICS_2015-16.pdf. Accessed on November 19, 2018.
Guendouz, A., N. Semcheddine, L. Moumeni and M. Hafsi. 2016. The effect of supplementary irrigation on leaf area, specific leaf weight, grain yield and water use efficiency in durum wheat (Triticum durum Desf.) cultivars. Ekin. J., 2(1): 82-89.
James, L.G., 1993. Principles of farm irrigation system design. Krieger Publishing Company, Washington DC, USA.
Kaleri, A.H., A.A. Kaleri, G.A. Kaleri, N.A. Wahocho, S. H. Kaleri, M.K. Kaleri, A.A. Kaleri, S.H. Kaleri and S.Y. Rajput. 2016. Effect of sowing dates on the growth and yield of lettuce (Lactuca Sativa). Int. J. Info. Res. Rev., 03(07): 2617-2619.
Kashyap, P. and R. Panda. 2003. Effect of irrigation scheduling on potato crop parameters under water stressed conditions. Agric. Water Manage., 59(1): 49-66. https://doi.org/10.1016/S0378-3774(02)00110-5
Khokhar, M.K., 2014. Production status of major vegetables in Pakistan, their problems and suggestions. Agric. Corner, pp. 9.
Kumar, G., M. Singh, R. Kumar, R. Yadav, C. Datt, K. Paul and A. Chauhan. 2015. Yield and quality of fodder turnip as affected by nitrogen application and weed management during lean period. Indian J. Anim. Nutr, 32(1): 57-62.
Lanari, V., O. Silvestroni, A. Palliotti, A. Green and P. Sabbatini. 2015. Plant and leaf physiological responses to water stress in potted ‘Vignoles’ grapevine. HortSci., 50(10): 1492-1497. https://doi.org/10.21273/HORTSCI.50.10.1492
Lavanya, A.V.N., V.S. Vani, P.S.S. Reddy and P. Shashikala. 2017. Root yield of radish as affected by sowing dates and spacing. Int. J. Pure Appl. Biosci., 5(4): 1780-1784. https://doi.org/10.18782/2320-7051.5743
Mazza, G. and E. Miniati. 2018. Cole Crops. Anthocyanins Fruits, Vegetables Grains. pp. 283–297. https://doi.org/10.1201/9781351069700
Ministry of Finance, 2017. Pakistan economic Survey 2017-18” Ministry of Finance Government of Pakistan http://www.finance.gov.pk/survey/chapters_18/Economic_Survey_2017_18.pdf (accessed on 20 February, 2019).
Neilsen, J., B. Rowe and P. Lane. 2008. Vegetative growth and development of irrigated forage turnip (Brassica rapa var. rapa). Grass Forage Sci., 63(4): 438-446. https://doi.org/10.1111/j.1365-2494.2008.00651.x
Nouri, A., A. Nezami, M. Kafi and D. Hassanpanah. 2016. Growth and yield response of potato genotypes to deficit irrigation. Int. J. Plant Prod., 10(2).
Onder, S., M.E. Caliskan, D. Onder and S. Caliskan. 2005. Different irrigation methods and water stress effects on potato yield and yield components. Agric. Water Manage., 73(1): 73-86. https://doi.org/10.1016/j.agwat.2004.09.023
Pakistan Economic Survey, (2017-18).” Ministry of Finance Government of Pakistan, 2018. http://www.finance.gov.pk/survey/chapters_18/Economic_Survey_2017_18.pdf (accessed on 20 March 2019)
Rao, S. and T. Dao. 1987. Soil Water Effects on Low-Temperature Seedling Emergence of Five Brassica Cultivars 1. Agron. J., 79(3): 517-519. https://doi.org/10.2134/agronj1987.00021962007900030023x
Romero, P., J.M. Navarro, F. García and P.B. Ordaz. 2004. Effects of regulated deficit irrigation during the pre-harvest period on gas exchange, leaf development and crop yield of mature almond trees. Tree Physiol., 24(3): 303-312. https://doi.org/10.1093/treephys/24.3.303
Rowe, B.A. and J.E. Neilsen. 2016. Effects of irrigating forage turnips Brassica rapa var. rapa cv. Barkant during different periods of vegetative growth 3. Irrigation water use efficiency, evapotranspiration and effective use of water. Crop Pasture Sci., 67(8): 864-871. https://doi.org/10.1071/CP14363
Schuppler, U., P.-H. He, P.C. John and R. Munns. 1998. Effect of water stress on cell division and Cdc2-like cell cycle kinase activity in wheat leaves. Plant Physiol., 117(2): 667-678. https://doi.org/10.1104/pp.117.2.667
Shah, S.S.A., S. Nisa, A. Khan, Z. Rahman and S.M.A. Shah. 2012. Trends and variability in climate parameters of Peshawar district. Sci., Tech. Dev., 31: 341-347.
Smittle, D.A., W.L. Dickens, J.R. Stansell and E. Simonne. 1992. Irrigation regimes affect leaf yield and water turnip use by mustard. HortSci., 27(4): 308-310. https://doi.org/10.21273/HORTSCI.27.4.308
Soengas, P., M.E. Cartea, M. Francisco, M. Lema and P. Velasco. 2011. Genetic structure and diversity of a collection of Brassica rapa subsp. rapa L. revealed by simple sequence repeat markers. J. Agric. Sci., 149(5): 617-624. https://doi.org/10.1017/S002185961100013X
Steel, R.G.D. and H.J. Torrie. 1980. Principles and procedures of statistics. MC-Graw Hill book Co. Inc. New York.
Tiryakioğlu, H., and T. Mevlüt. 2012. Effects of different sowing and harvesting times on yield and quality of forage turnip (Brassica rapa L.) grown as a second crop. Turk. J. Field Crops, 17(2): 166-170.
Uikey, V., N.K. Chopra, N. Chopra, R. Kumar and T. Yadav. 2015. Influence of sowing time and level of nitrogen application on yield and chemical constituents of turnip (Brassica compestris var. rapa L.) fodder. Indian J. Anim. Nutr., 32(3): 351-353.
Valle, G.D. and S. Harmon. 1970. Influence of seeding rate, source and level of nitrogen on yield, color, leaf blade weight, and nitrogen content of turnip greens. J. Am. Soc. Hortic. Sci., 95: 62-64.
Villholth, K. G., Jensen, K. H., & Fredericia, J. (1998). Flow and transport processes in a macroporous subsurface-drained glacial till soil I: Field investigations. J. Hydrol., 207(1-2): 98-120.
Yücel, S., 1992. Relationships between sugar beet yield and quality and climatic factors in Turkey. Pap. Present. Winter Cong. Winterkongress.
Zheng, J., G. Huang, J. Wang, Q. Huang, L.S. Pereira, X. Xu and H. Liu. 2013. Effects of water deficits on growth, yield and water productivity of drip-irrigated onion (Allium cepa L.) in an arid region of Northwest China. Irrig. Sci., 31(5): 995-1008. https://doi.org/10.1007/s00271-012-0378-5
To share on other social networks, click on any share button. What are these?