

Genetic Diversity Comparison of Pampus minor between Chinese and Malaysian Populations Inferred from mtDNA Cytb


Genetic Diversity Comparison of Pampus minor between Chinese and Malaysian Populations Inferred from mtDNA Cytb
Yuan Li1, Liyan Zhang2, Karhoe Loh3, Ji Feng1, Xinqing Zheng1, Puqing Song1 and Longshan Lin1,*
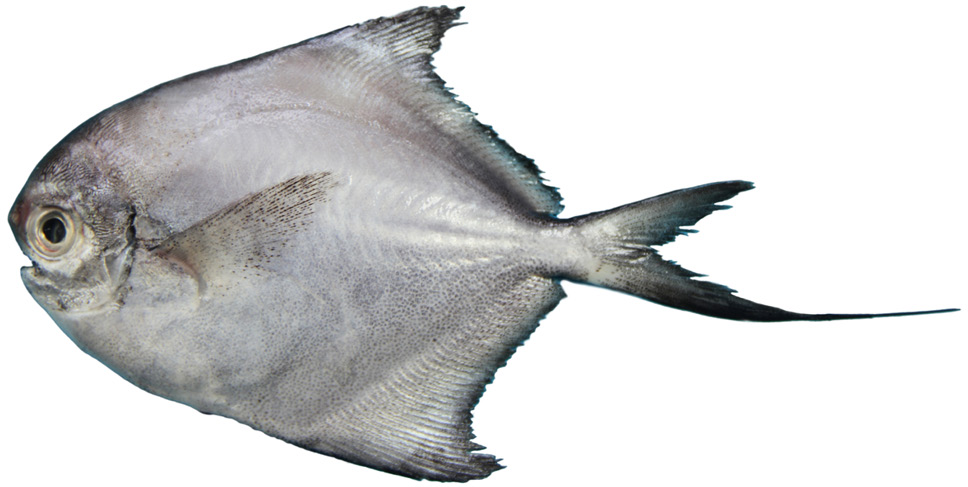
Pampus minor Liu and Li, 1998.
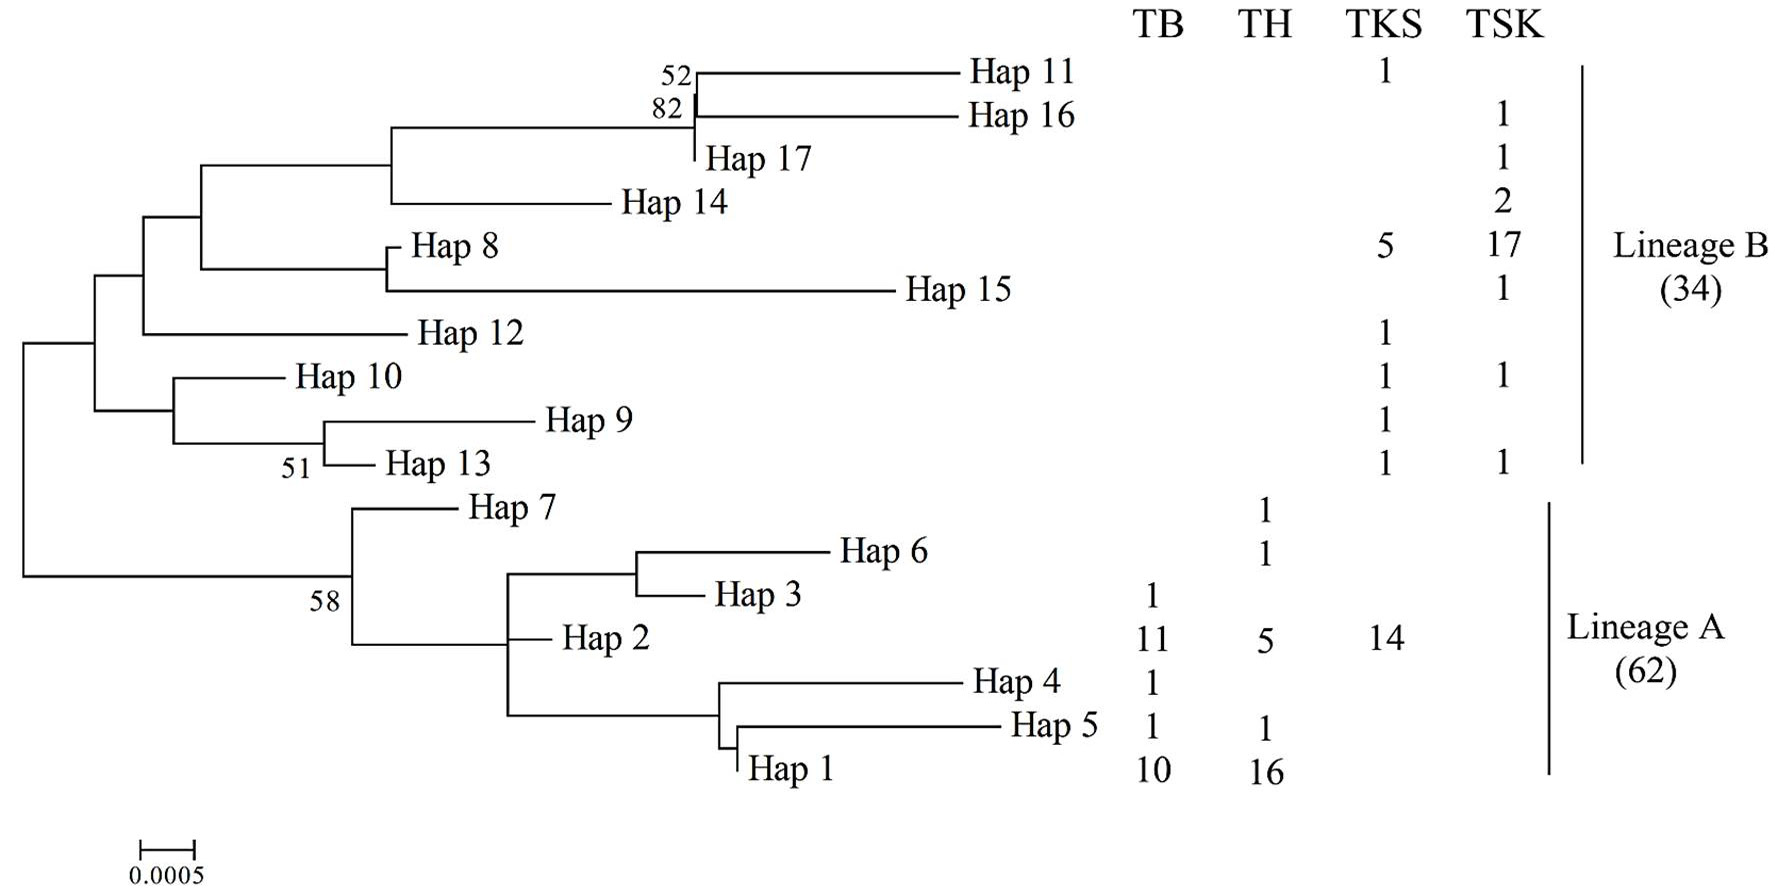
NJ tree of Cytb haplotypes of P. minor. Bootstrap supports >50 in 1,000 replicates.
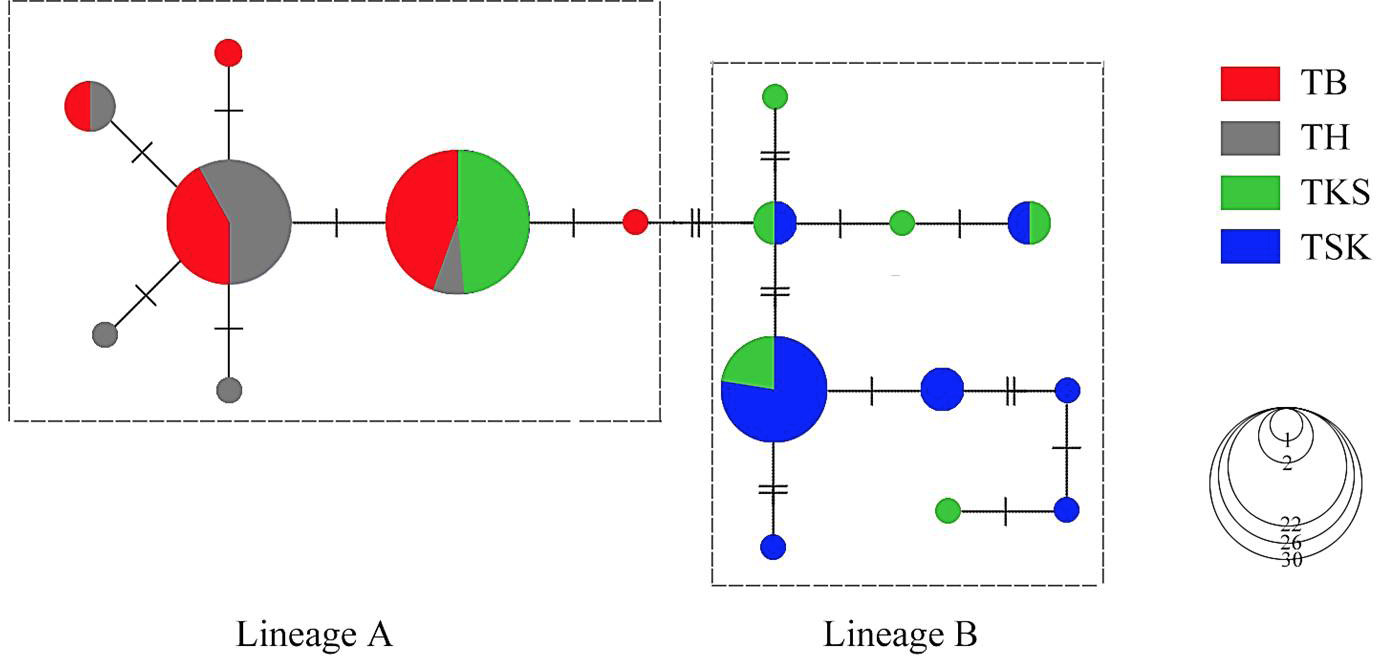
Unrooted minimum spanning tree depicting the genetic relationship among the Cytb haplotypes of P. minor. Circle sizes are proportional to the haplotype frequency. Perpendicular tick marks on the lines joining the haplotypes represent the number of nucleotide substitutions.
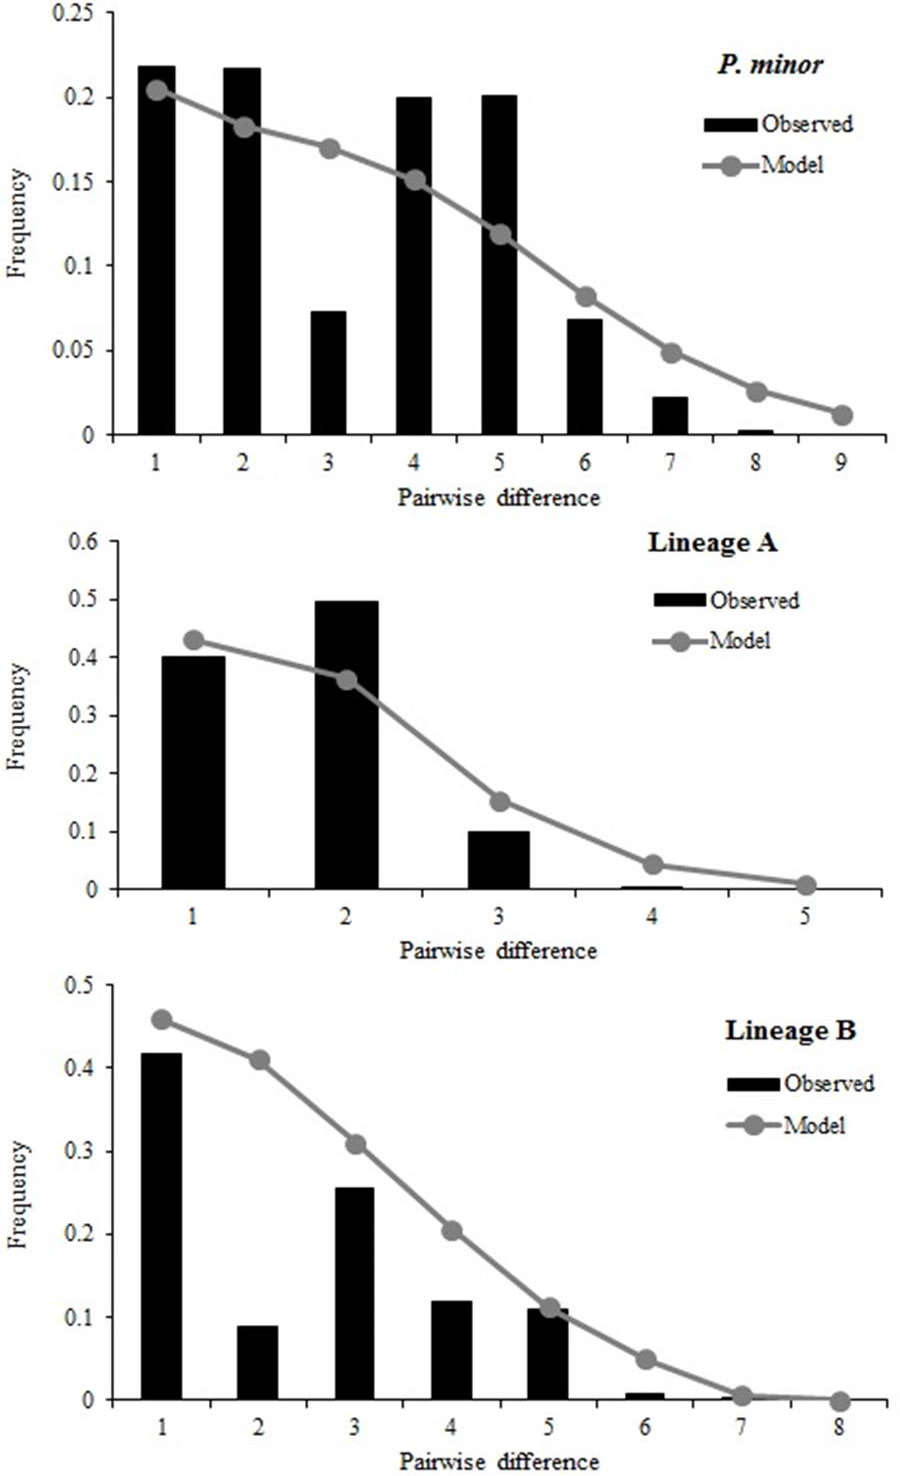
Mismatch distributions of Cytb haplotypes of P. minor.
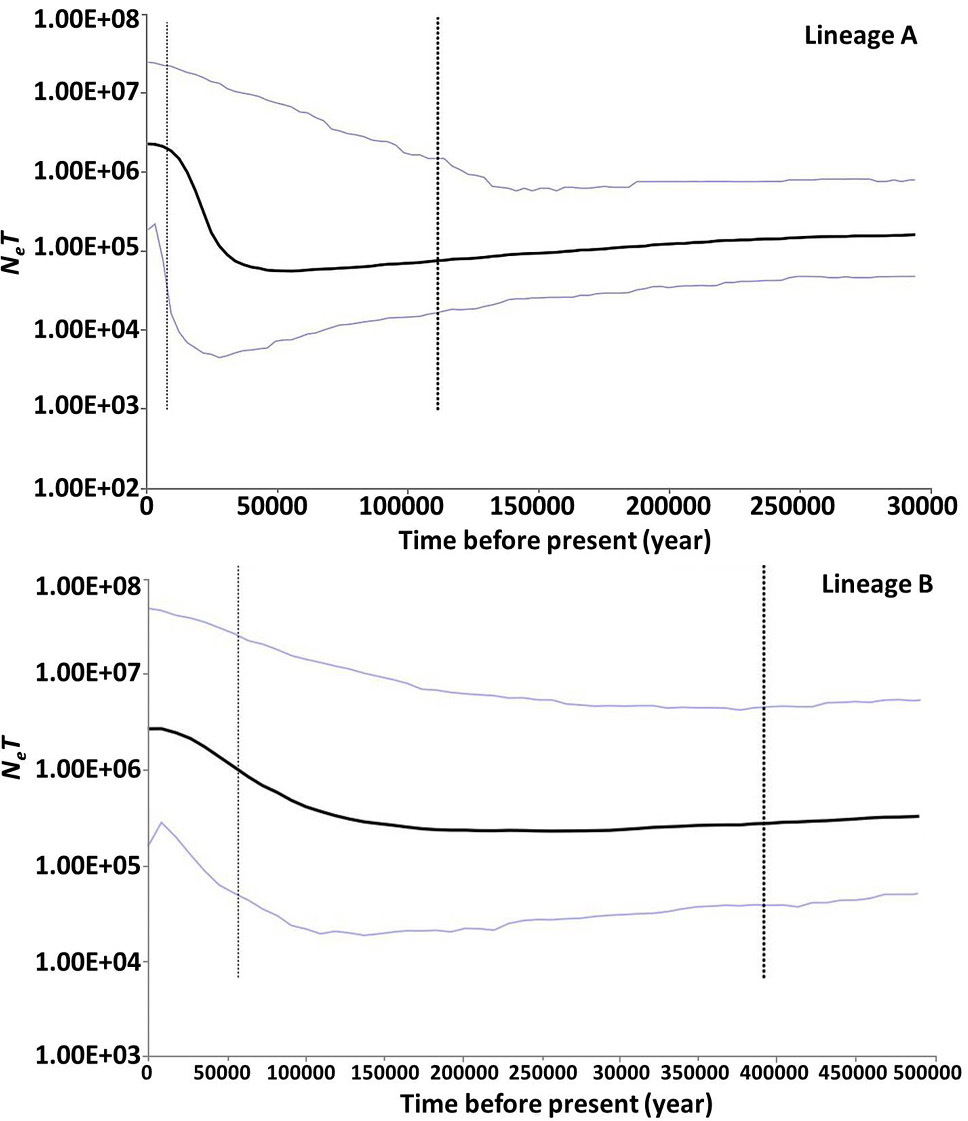
Bayesian skyline plots showing NefT (Nef, effective population size; T, generation time) changes over time for P. minor based on Cytb sequences. The upper and lower limits of the blue line represent the 95% confidence intervals of highest posterior densities (HPD) analysis. The black line represents median estimates of NefT.


