

Expression Analysis of Apocheima cinerarius Ershoff from Different Geographical Populations through Illumina RNA-seq


Expression Analysis of Apocheima cinerarius Ershoff from Different Geographical Populations through Illumina RNA-seq
Lei Wang1, Lu Yang2, Lei Luo1, Yaqi Gao1*, Jian Gao1 and Ping Liu1
1Institute of Mordern Forestry, Xinjiang Academy of Forestry, Urumqi 830000, China
2Xinjiang Academy of Forestry, Urumqi 830000, China
ABSTRACT
This study elucidated the differences between Apocheima cinerarius Ershoff (1874) populations from various geographic regions (southern and northern Xinjiang) based on morphological features, biological characteristics, and gene expression, thus providing a theoretical basis for the genetic manipulation of A. cinerarius. Illumina RNA-Seq was used to perform massive sequencing of 18 cDNA samples derived from male adults, female adults, and pupa of A. cinerarius in southern and northern Xinjiang. We extracted total RNA from 18 samples and synthesized cDNA via reverse transcription. Then, Illumina sequencing was performed and unigenes were identified after assembly and clustering. The resulting unigenes were then compared to homologous sequences using NCBI-NR, Swiss-Prot, KOG, Pfam, eggNOG, KEGG, COG, and GO for functional annotation and classification. Some differences in the regularity of distribution and the time of eclosion of the pupa were detected between the southern and the northern populations. We obtained 142.65 Gb of data from transcriptome sequencing and recovered 70,397 unigenes through a de novo assembly. In total, 2089, 2420, and 6286 differentially expressed genes were gained from comparing groups of male adults, female adults, and pupa of A. cinerarius, respectively. In addition, 27715 SSR markers were obtained and the SNP site was identified. The results revealed the differences between A. cinerarius in southern and northern Xinjiang, enriches the genetic information of A. cinerarius, and accelerates research aimed at addressing the regularity of genetic variations.
Article Information
Received 28 February 2019
Revised 30 June 2019
Accepted 14 March 2020
Available online 18 May 2020
Authors’ Contribution
Gao and LY conceived and designed the research. LW performed the experiments. LL contributed new analytical tools. JG and PL analyzed the data. LW and LY wrote the paper.
Key words
Apocheima cinerarius, RNA-Seq, geographical population, differentially expressed gene
DOI: https://dx.doi.org/10.17582/journal.pjz/20191108031157
* Corresponding author: gyq611003@163.com
0030-9923/2020/0005-1849 $ 9.00/0
Copyright 2020 Zoological Society of Pakistan
Introduction
Paleacrita vernata (Lepidoptera: Geometridae) is a common pest of orchards, shade trees, and shelter belts in northern China (especially Xinjiang), southeast Russia, and Central Asia (Liu et al., 2014). Apocheima cinerarius Ershoff (1874) causes damages mainly to elaeagnus angustifolia, poplar, willow, locust tree, mulberry, etc. The outbreaks can result in serious defoliation, and continued attacks may damage forest landscapes and destroy the regional ecological balance (Furniss and Carolin, 2015; Millar et al., 1990). Adult insects emerge from pupation chambers in the soil in early spring. Males have wings but females are wingless. After emergence, they climb up the trunk from different directions to mate. Eggs are commonly laid in bark crevices. The larvae emerge around the time of bud swelling in May, develop on the foliage, and then drop to the ground. They construct cells and overwinter in the soil, and pupation occurs in late winter thus completing the life cycle of A. cinerarius (Ives and Wong, 1988).
Molecular phylogeny and genetic analysis studies have shown the genetic differentiation among different geographical populations of A. cinerarius. Diverse environmental factors cause a wide spectrum of changes in plants, including the expression of a large amount of genes (Chinnusamy et al., 2007; Bhatnagar-Mathur et al., 2008). Knowledge and understanding of the genetic expression between populations that are separated by geographical distances is essential to obtain insights into the spatial distribution and geographical genetic diversity of the species (Wang and Li, 2012). Levin et al. (2012) and Gray et al. (2015) reported that populations in different geographical regions may show differences in morphological, genetic, and biological aspects. Lou et al. (2015) reported sequence variability among a mouse pinworm and Aspicularis tetraptera from laboratory mice in different provinces in China. Changes in their life cycles and habits, including biological characteristics such as feeding and interaction with new host plants, may result in genetic variation and differentiation when insects move to a new environment to expand their distribution range. Studies on the diversity of A. cinerarius in different geographic populations are sparse. Xie et al. (2014) reported the prevalence and life habits of A. cinerarius, and Qing et al. (2016) studied the biological characteristics of A. cinerarius; however, the genetic hereditary variability of this insect has not been reported previously (Zhang et al., 2011).
RNA-seq technology has been efficient in generating enormous amounts of sequence data that represent expressed genes and this technology has allowed us to quantitate gene expression levels in particular organs, tissues, or cells under different treatments or conditions (Asmann et al., 2008; Mardis, 2008). It has the characteristics of quantitative standard, high repeatability and wide detection range, and is broadly applied in the transcriptome analysis of humans (Pan et al., 2008), crops (Severin et al., 2010; Wei et al., 2011), agricultural pests (Xu et al., 2012) and other model organisms (Filichkin et al., 2010; Chen et al., 2012). This technology has also allowed the identification of transcription factors (Denoeud et al., 2008), selective shears (Wang et al., 2008), polymorphism of mononucleic acids, and gene fusion (Maher et al., 2009). Gene transcripts can be profiled by a number of techniques aimed at isolating differentially expressed genes (DEGs), such as serial analysis of gene expression (Velculescu et al., 1995), microarray (Schena et al., 1995; Lockhart et al., 1996), and cDNA libraries (Boguski et al., 1994). RNA-seq is used for unbiased quantification of gene expression at the genome level (Mortazavi et al., 2008; Hurd and Nelson, 2009), and provides a profound and precise measurement compared to microarray or other traditional methods to measure gene expression levels (Wang et al., 2009).
In this study, the differences among A. cinerarius in various geographic populations were studied based on morphology, biology, and gene expression. The results provide a molecular basis for the functional analysis of gene expression and provide an important reference for genetic variability, which can be used to strategize the control of A. cinerarius.
Materials and methods
A. cinerarius collection
There were 9 samples of A. cinerarius including 3 male adults, 3 female adults and 3 pupas in southern Xinjiang derived from seven villages, Tower Kyrgyz Hong Township, Shule County of Kashgar. Then, 9 samples of A. cinerarius including 3 male adults, 3 female adults and 3 pupas in north Xinjiang were collected from Wuyun Village, Jiuyun Town of Fukang. Pupae of A. cinerarius were collected by digging in the forest as they are partially buried in the soil. The A. cinerarius were collected from southern and northern Xinjiang, and the male adults, female adults and pupas collected were all at the same level of developmental in southern and northern Xinjiang.
Northern Xinjiang: Fukang is located at the north foot of Boguda Peak and the southeast edge of Junggar Basin, and between the north latitude 43.45’~45.29’ and east longitude 87.46’~88.44’. The annual average maximum and minimum temperatures are 8.8-5.3°C, the average precipitation is 164 mm. Southern Xinjiang: Kashgar is seated at the southwest corner of Xinjiang. It is situated at the north foot of the Mir Plateau and the central Asian hinterland of Tarim Basin, and between the north latitude 39.25’~39.35’ and east longitude 75.56’~76.04’. The annual mean maximum and minimum temperatures are 14-6.1°C, the average annual precipitation is 74.06 mm.
Investigation of morphological and biological characteristics of A. cinerarius
Observations of pupae and adults of A. cinerarius from south and north Xinjiang were performed at each developmental stage and the morphological characteristics were described. The biological characteristics were observed by field investigations and fixed-point system observations, describing regularity in distribution and the time of eclosion of the pupa.
RNA isolation and quantification
RNA degradation and contamination were determined by resolving on 1% agarose gels. RNA purity was checked using the Nano Photometer spectrophotometer (IMPLEN, CA, USA). RNA concentration was measured utilizing RNA Assay Kit in 2.0 Flurometer (Life Technologies, CA, USA). RNA integrity was assessed employing the RNA Nano 6000 Assay Kit in the Agilent Bioanalyzer 2100 system (Agilent Technologies, CA, USA).
Library preparation and sequencing
Sequencing libraries were generated using NEBNext®Ultra™, RNA Library Prep Kit for Illumina (NEB, USA) and index codes were added to attribute sequences to each sample. A total amount of 3 μg RNA per sample was used as input material for the RNA sample. mRNA was purified from total RNA using poly-T oligo-attached magnetic beads. Fragmentation was carried out by using divalent cations under elevated temperature in NEBNext First Strand Synthesis Reaction Buffer (5×). First strand cDNA was synthesized with random hexamer primer and M-MuLV Reverse Transcriptase (RNase H-). Second strand cDNA synthesis was subsequently performed using DNA Polymerase I and RNase H. Remaining overhangs were converted into blunt ends via exonuclease/polymerase activities. After adenylation of 3’ ends of DNA fragments, NEBNext Adaptor with hairpin loop structure were ligated to prepare for hybridization. In order to select cDNA fragments of preferentially 150~200 bp in length, the library fragments were purified with AMPure XP system (Beckman Coulter, Beverly, USA). Then, 3 μl USER Enzyme (NEB, USA) was used with size-selected, adaptor-ligated cDNA at 37°C for 15 min followed by 5 min at 95°C before polymerase chain reaction (PCR). Then, PCR was performed with Phusion High-Fidelity DNA polymerase, Universal PCR primers and Index (X) Primer. Finally, PCR products were purified (AMPure XP system) and library quality was assessed on the Agilent Bioanalyzer 2100 system. The concentration of the library was detected in Qubit2.0, and insert size was measured with Agilent 2100, effective concentration of library was accurately quantified by quantitative PCR, high-throughput sequencing was conducted by Illumina Hiseq.
Quality control of sequencing data and assembly
The trimming adapter sequences were removed, and low-quality reads were filtered with the software. Thus, raw sequences were transformed into clean tags after data processing. Trinity assembly software was utilized for the sequence assembly (Grabherr et al., 2011).
Statistical analysis of differential gene expression
Simple sequence repeat (SSR) was detected among the unigenes with length > 1,000 bp by using the software MISA. The comparisons between reads and unigene sequences were made using the STAR software (Dobin et al., 2013) aiming at RNA-Seq analysis in each sample. The single nucleotide polymorphism (SNP) site was identified through the GATK software (McKenna et al., 2010), specifying SNP calling process of RNA -Seq.
Functional annotation of unigenes
The unigene sequences were aligned with NR (Deng et al., 2006), Swiss-Prot (Apweiler et al., 2004), Gene Ontology (GO) (Ashburner et al., 2000), Clusters of Orthologous Groups (COG) (Tatusov et al., 2000), Eukaryotic Ortholog Groups (KOG) (Koonin et al., 2004), eggnog (Huerta-Cepas et al., 2016) and Kyoto Encyclopedia of Genes and Genomes (KEGG) (Kanehisa et al., 2004) databases by using the BLAST software (Altschul et al., 1997). The result of KEGG Orthology of unigenes was obtained by KOBAS 2.0 software (Xie et al., 2011). Then, the amino acid sequences of unigenes were obtained, the annotation information of unigenes compared with Pfam database (Eddy, 1988) was acquired by HMMER software (Finn et al., 2014).
Results
Description of morphological and biological characteristics
The body length is 10-15 mm and the wingspan extends from 28-37 mm. The color of the tentacle is yellow with feathery shape. The chest has long grey hairs in male adult A. cinerarius; the wing is vestigial, the body length is 10-15 mm, the shape of the tentacle is filiform, the color of the ommateum is black, the color of the body is taupe, the foot is slender in female adult A. cinerarius; the body length ranged from 10-15 mm, the color of the body was yellow at the preliminary stage of growth. After 2-3 days, the color of the tail turns primarily reddish-yellow, the head color becomes reddish-yellow, the shell of the pupa becomes hard, and the tail can sway when touching in A. cinerarius pupae.
The distribution density of pupae in south Xinjiang significantly increased from the base of the tree trunk to the exterior in the horizontal direction, while the distribution was in contrast in south Xinjiang. Eclosion of the pupae in south Xinjiang occurred in early February, when the soil temperature was between 0-6°C and the soil moisture was between 0-70%, while in north Xinjiang it occurred in late march, when then the range of soil temperature was also 0–6°C and the soil moisture was between 0 and 100%.
Illumina sequence data and assembly
A total of 142.65 Gb of clean data was obtained after the quality control of raw reads derived from sequencing 18 libraries. The percentage of Q30 base (the error rate of sequencing < 1%) was not less than 89.41% in each sample (Table I), suggesting the high accuracy of the sequencing data. Sample GC content was in the range of 45.15% to 47.83%.
Using the Trinity de novo assembly program, next-generation short-read sequences were assembled into 152,764 transcripts with a mean length of 1731.33 bp. The transcripts were subjected to cluster and assembly analyses. Finally, we harvested a total of 70,397 unigenes with an average length of 1415.13 bp, which included 31,441 unigenes (44.66%) with lengths greater than 1000 bp (Table II). These results showed that the throughput and sequencing quality was high enough for the following analyses. Clean reads from each library was matched to the Unigene library acquired by assembly. The results demonstrated that almost 70% was compared (Table III), indicating the high utilization rate of the assembled data.
SSR development and analysis
We detected SSRs among >1,000 bp putative unigene sequences using the MISA program (Table IV). SSRs were identified from 27,715 putative unigene sequences, which represent about 88.15% of the analyzed unigenes (31,441). SSRs with mononucleotide, dinucleotide, trinucleotide, tetra nucleotide, pentanucleotide and hexanucleotide repeats comprised about 72.90%, 10.33%, 7.34%, 0.28%,
Table I. Description of RNA-Seq libraries.
|
Samples of Apocheima cinerarius |
Number |
Read number |
Base number |
GC content (%) |
Cycle Q30 (%) |
|
Male adult in southern Xinjiang |
T01 |
31,006,271 |
9,229,142,626 |
46.31% |
91.69% |
|
T02 |
28,240,935 |
8,413,746,148 |
46.53% |
91.18% |
|
|
T03 |
28,777,075 |
8,569,851,414 |
46.22% |
91.25% |
|
|
Female adult in southern Xinjiang |
T04 |
29,041,799 |
8,681,262,116 |
45.21% |
92.74% |
|
T05 |
28,993,737 |
8,647,367,442 |
45.98% |
92.75% |
|
|
T06 |
28,358,383 |
8,474,283,590 |
45.72% |
92.86% |
|
|
Male adult in northern Xinjiang |
T07 |
30,117,159 |
8,962,026,470 |
45.93% |
91.69% |
|
T08 |
27,108,078 |
8,069,738,742 |
45.15% |
91.48% |
|
|
T09 |
28,924,416 |
8,609,985,720 |
45.30% |
91.75% |
|
|
Female adult in northern Xinjiang |
T10 |
24,509,994 |
7,300,101,106 |
46.92% |
92.75% |
|
T11 |
22,494,958 |
6,683,581,962 |
45.93% |
92.45% |
|
|
T12 |
25,445,678 |
7,581,664,936 |
47.21% |
92.44% |
|
|
Pupa of Apocheima cinerarius in northern Xinjiang |
T13 |
25,435,430 |
7,562,204,490 |
45.94% |
91.12% |
|
T14 |
27,446,962 |
8,173,526,222 |
45.45% |
91.00% |
|
|
T15 |
24,877,330 |
7,413,461,230 |
45.66% |
90.48% |
|
|
Pupa in southern Xinjiang |
T16 |
21,376,667 |
6,376,388,892 |
47.47% |
89.56% |
|
T17 |
23,025,654 |
6,859,832,716 |
47.83% |
89.44% |
|
|
T18 |
23,578,029 |
7,036,945,558 |
47.72% |
89.41% |
0.04% and 0.11% of the SSRs, respectively. In addition, 2495 putative unigenes with compound SSRs were also identified. Overall, mono-, di- and tri-nucleotide SSRs had an A and T preference. Tetra-, penta- and hexa-nucleotide SSRs were only present in small numbers in the obtained transcriptome sequences from the two A. cinerarius varieties in southern and northern Xinjiang, and their base patterns were quite complex and were not subjected to detailed analysis. These SSR will serve as the basis for future marker development for A. cinerarius.
Table II. Length distribution of assembled transcripts and unigenes.
|
Gene length |
Transcript number |
Unigene number |
|
200-300 |
12,083 |
9,661 |
|
300-500 |
18,598 |
12,101 |
|
500-1000 |
34,398 |
17,194 |
|
1000-2000 |
40,766 |
15,420 |
|
2000+ |
46,919 |
16,021 |
|
Total number |
152,764 |
70,397 |
|
Total length |
264,484,215 |
99,621,103 |
|
N50 length |
2,677 |
2,411 |
|
Mean length |
1731.33 |
1415.13 |
SNP analysis
The single nucleotide polymorphism (SNP) site was identified by STAR and GATK software. Based on the number of alleles in the SNPs, they were divided into homozygous SNPs loci (only one allele) and heterozygous SNPs loci (two or more allele). The proportion of heterozygous SNPs in different species is diverse. The results indicated that the mean proportion of heterozygous SNPs to all SNPs among male adults (34.95%, 45.70%) and female adults (27.21%, 43.64%) of A. cinerarius between southern and northern Xinjiang were evidently different (Table V). A comparison of the mean proportion of A. cinerarius pupae (83.37%, 82.18%) between south and north Xinjiang showed no difference. However, the differences in the proportion were statistically significant between the male and female adults.
Functional annotation of unigenes
For validation and annotation of the assembled unigenes, sequence similarity searches were conducted in the COG, GO, KEGG, KOG, Pfam, Swiss-Prot, eggnog, and the NR protein databases with an E-value threshold of 10−5. The results indicated that out of 70,397 unigenes, 9,882 (14.04%), 17,102 (24.29%), 13,889 (19.73%), 20,355 (28.91%), 23,001 (32.67%), 17,520 (24.89%), 28,954 (41.13%) and 29,563 (41.99%) unigenes showed significant similarity to known proteins in the COG, GO, KEGG, KOG, Pfam, Swiss-Prot, eggNOG and NR databases, respectively. Together, 30,539 (49.2%) unigenes showed similarity to known proteins in these eight databases (Table VI).
Table III. Summary of Illumina reads mapping to A. cinerarius reference genome.
|
Samples of A. cinerarius |
Clean reads |
Mapped reads |
Mapped ratio |
|
Male adult in southern Xinjiang |
31,006,271 |
23,010,150 |
74.21% |
|
28,240,935 |
20,546,822 |
72.76% |
|
|
28,777,075 |
20,749,701 |
72.10% |
|
|
Female adult in southern Xinjiang |
29,041,799 |
21,428,127 |
73.78% |
|
28,993,737 |
20,911,044 |
72.12% |
|
|
28,358,383 |
20,728,649 |
73.10% |
|
|
Male adult in northern Xinjiang |
30,117,159 |
22,073,265 |
73.29% |
|
27,108,078 |
19,555,129 |
72.14% |
|
|
28,924,416 |
20,891,589 |
72.23% |
|
|
Female adult of A. cinerarius in northern Xinjiang |
24,509,994 |
17,980,439 |
73.36% |
|
22,494,958 |
16,293,434 |
72.43% |
|
|
25,445,678 |
18,795,261 |
73.86% |
|
|
Pupa in northern Xinjiang |
25,435,430 |
18,982,773 |
74.63% |
|
27,446,962 |
20,190,767 |
73.56% |
|
|
24,877,330 |
18,461,997 |
74.21% |
|
|
Pupa in southern Xinjiang |
21,376,667 |
15,486,208 |
72.44% |
|
23,025,654 |
16,652,142 |
72.32% |
|
|
23,578,029 |
17,082,915 |
72.45% |
Note: clean reads, clean reads number with paired-end; mapped reads, comparison of reads to unigene are referred to as mapped; count with paired-end; mapped ratio, the ratio of clean reads to mapped reads.
Table IV. Statistics of SSR types.
|
SSR Type |
Number |
|
Mono-nucleotide |
20,204 |
|
Di-nucleotide |
2,863 |
|
Tri-nucleotide |
2,033 |
|
Tetra-nucleotide |
78 |
|
Pentanucleotide |
11 |
|
Hexa-nucleotide |
31 |
|
Compound SSR |
2,495 |
|
Total |
27,715 |
Comparison of sample expression
As an aid to examining gene expression level distributions, the fragments per kilobase of transcript per million mapped reads (FPKM) (Trapnell et al., 2010) values were calculated as normalized expression estimates for each gene model in each sample. The reads gained by sequencing were compared with the Unigene library by Bowtie (Langmead et al., 2009). Then, RSEM software (Li and Colin, 2011) was utilized to estimate the level of expression. FPKM value is regarded as the measure of expression abundance of a Unigene. The formula to calculate FPKM is as follows:
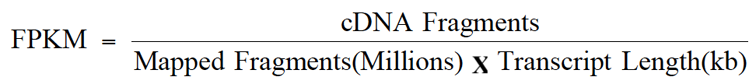
Where; cDNA fragments represent the number of fragments compared to a transcript (the number of paired-end reads); mapped fragments denote the total number of pieces compared to the transcript (106 for the unit); transcript length: the length of transcription (103 bases for the unit).
Table V. Analysis of SNP quantity.
|
Samples of A. cinerarius |
Homozygous SNP |
Heterozygous SNP/Proportion |
All SNP |
Mean proportion |
|
Male adult in southern Xinjiang |
105,231 |
57,520 (35.34%) |
162,751 |
34.95% |
|
104,177 |
55,004 (34.55%) |
159,181 |
||
|
104,532 |
56,221 (34.97%) |
160,753 |
||
|
Female adult in southern Xinjiang |
110,622 |
41,727 (27.39%) |
152,349 |
27.21% |
|
110,511 |
41,219 (27.17%) |
151,730 |
||
|
110,278 |
40,929 (27.07%) |
151,207 |
||
|
Male adult in northern Xinjiang |
89,526 |
75,841 (45.86%) |
165,367 |
45.70% |
|
89,006 |
74,033 (45.41%) |
163,039 |
||
|
89,103 |
75,418 (45.84%) |
164,521 |
||
|
Female adult in northern Xinjiang |
84,892 |
66,017 (43.75%) |
150,909 |
43.64% |
|
84,472 |
65,394 (43.63%) |
149,866 |
||
|
84,246 |
64,977 (43.54%) |
149,223 |
||
|
Pupa in northern Xinjiang |
9,202 |
39,135 (80.96%) |
48,337 |
82.18% |
|
8,190 |
41,295 (83.45%) |
49,485 |
||
|
8,822 |
40,583 (82.14%) |
49,405 |
||
|
Pupa in southern Xinjiang |
13,018 |
64,057 (83.1%) |
77,075 |
83.37% |
|
12,836 |
64,713 (83.45%) |
77,549 |
||
|
12,775 |
64,914 (83.56%) |
77,689 |
Under normal circumstances, the FPKM value of protein-coding genes sequenced across six orders of magnitude from 102 to 104. In the same Log Koc, different samples showed different densities, which indicated that the gene expression was different. The distribution of FPKM density in 18 samples is shown in Figure 1. In contrast to A. cinerarius pupae in southern Xinjiang, the group of pupae in northern Xinjiang were significantly different, whereas the differences among male adult A. cinerarius between south and north Xinjiang was steady and no differences were observed among female adult A. cinerarius between south and north Xinjiang.
Table VI. Functional annotation of Unigenes.
|
Annotated database |
Annotated number |
300 ≤ length < 1000 |
Length ≥ 1000 |
|
COG Annotation |
9,882 |
1,557 |
8,082 |
|
GO Annotation |
17,102 |
3,310 |
13,318 |
|
KEGG Annotation |
13,889 |
2,770 |
10,728 |
|
KOG Annotation |
20,355 |
3,404 |
16,449 |
|
Pfam Annotation |
23,001 |
4,071 |
18,502 |
|
Swissprot Annotation |
17,520 |
2,907 |
14,244 |
|
eggNOG Annotation |
28,954 |
5,831 |
22,307 |
|
NR Annotation |
29,563 |
5,971 |
22,782 |
|
All Annotated |
30,539 |
6,547 |
23,043 |
Notes: Annotated Databases, each functional database; Annotated Number, the number of Unigenes annotated by the database; 300≤length<1000, the number of annotated Unigenes whose length was ≥300 and <1000 bases; length≥1000, the number of annotated Unigenes whose length was >1000 bases.
Notes: The curves with different colors in the figure represent different samples. The abscissa of the points on the curve represents the LOD score of FPKM, and the ordinate of the points indicate the probability density.
Identification and selection of DEGs
Differentially expressed genes (DEGs) are defined as genes with significant differences in expression levels in different conditions. False discovery rate (FDR) served as a key indicator of differential expressed gene screening and it tends to reduce false positives resulting from independent statistical hypothesis testing on the expression values of a large number of genes. In the process of screening, the smaller FDR value and the larger difference multiple indicate a more significant difference in expression. A threshold for FDR of <0.01 and fold change (FC) of ≥2 were used to determine significant differences in gene expression. A total of 3,846 genes were found to be differentially expressed in a comparison between male adult A. cinerarius in southern and northern Xinjiang (Table VII). Among these, 2,127 genes were up-regulated and 1,719 genes were down-regulated. Between female adults of A. cinerarius in southern and northern Xinjiang, a total of 4,211 DEGs were detected with 2,267 up-regulated and 1,944 down-regulated genes. In contrast, the comparison of A. cinerarius larvae in southern and northern Xinjiang showed 25,946 differentially expressed genes with 11,351 up-regulated and 14,595 down-regulated genes.
Hierarchical cluster analysis of DEGs
Hierarchical clustering of the differentially expressed genes clustered the genes with the same or similar expression behavior. The result of gene clustering between samples showed significant differences between comparison. Cluster analysis showed that the expression profiles of
Table VII. Quantity statistics of DEGs.
|
DEG set comparison group |
All DEG |
up-regulated |
down-regulated |
|
Male adult |
3,846 |
2,127 |
1,719 |
|
Female adult |
4,211 |
2,267 |
1,944 |
|
Pupa |
25,946 |
11,351 |
14,595 |
Notes: DEG Set, Names of DEG sets of Apocheima cinerarius between the south and north of Xinjiang; All DEG, The number of differentially expressed genes; up-regulated, the quantity of up-regulated genes; down-regulated, the quantity of down-regulated genes.
Table VIII. Quantitative statistics of DEGs.
|
DEG set comparison group |
Annotated |
COG |
GO |
KEGG |
KOG |
Pfam |
Swiss-Prot |
Egg NOG |
NR |
|
male adult |
2,089 |
646 |
1,168 |
834 |
1,318 |
1,318 |
1,192 |
1,987 |
2,065 |
|
female adult |
2,420 |
750 |
1,322 |
893 |
1,501 |
1,818 |
1,417 |
2,282 |
2,352 |
|
pupa |
18,056 |
6,286 |
10,776 |
9,022 |
13,022 |
14,291 |
11,214 |
17,424 |
17,874 |
Notes: DEG Set, Name of differentially expressed gene set of A. cinerarius between the south and north of Xinjiang. Annotated; the number of differentially expressed genes in the annotation.
Note: Each column represents the mean expression value of the RNA-Seq obtained from three biological replicates in each sample, each row represents a differentially-expressed gene. The color represents the logarithm of base 2 of the FPKM value of the gene in the sample.
Note: The abscissa for GO classification, the ordinate for the percentage of genes in the left side and the number of genes in the right.
DEGs varied significantly among male adults, female adults and pupae of A. cinerarius in south and north of Xinjiang (Fig. 2).
Functional annotation of DEGs
The DEGs were annotated based on the expression quantity of genes in different samples. The number of genes annotated in each gene set is as follows (Table VIII): 2,089, 2,420, and 18,056 DEGs were annotated in the comparison of male adult, female adult, and pupa of A. cinerarius between south and north Xinjiang, respectively.
GO classification of DEGs
GO was used to classify the functions of the assembled transcripts and describe gene products in terms of their associated biological processes, cellular components, and molecular functions. The comparison of male adult, female adult and pupa of A. cinerarius between south and north Xinjiang yielded 1,168, 1,322, and 10,776 DEGs in the three categories (Table VIII), respectively. To better review GO classification, each GO term was further clustered to its parent term. The differentially expressed genes from the three comparison groups were grouped based on their expression. The results showed that the three largest biological processes were ‘Metabolic process’, ‘Cellular process’ and ‘Single-organism process’. ‘Cell parts’ and ‘Cells’ occupied the top two categories of cell components (Fig. 3). Meanwhile, most of the genes were classified into the molecular functions of ‘Binding’, and ‘Catalytic activity’. The results demonstrated that most of the sequenced genes were responsible for fundamental biological regulation and metabolism.
COG classification of DEGs
To further evaluate the completeness of our transcriptome library and the effectiveness, the annotated sequences for the genes involved in COG classifications were searched. In total, 646, and 750 DEGs had a COG classification in the comparison of male adult and female adult A. cinerarius between south and north Xinjiang (Table VIII), respectively. Both COG classification of DEGs were similar. Among the 25 COG categories, the cluster for ‘General function prediction’ represented the largest group (1778, 22.8%) followed by ‘Amino acid transport and metabolism,’ ‘Replication, recombination and repair,’ ‘Carbohydrate transport and metabolism,’ and ‘Inorganic ion transport and metabolism (Fig. 4A and 4B).
Moreover, 6,286 DEGs resulted in the comparison of A. cinerarius pupae between south and north Xinjiang (Fig. 4C). ‘General function prediction,’ ‘Replication, recombination and repair,’ and ‘transcription’ were the groups with the most genes in the following categories: ‘translation, ribosomal structure and biogenesis,’ ‘posttranslational modification, protein turnover, chaperones,’ ‘signal transduction mechanisms,’ and ‘amino acid transport and metabolism’.
Note: a, RNA processing and modification; b, Chromatin structure and dynamics; c, Energy production and conversion; d, Cell cycle control, cell division, chromosome partitioning; e, Amino acid transport and metabolism; f, Nucleotide transport and metabolism; g, Carbohydrate transport and metabolism; h, Coenzyme transport and metabolism; i, Lipid transport and metabolism; j, Translation, ribosomal structure and biogenesis; k, Transcription; l, Replication, recombination and repair; m, cell wall, membrane/envelope, biogenesis; n, cell motility; o, posttranslational modification, protein turnover chaperones; p, Inorganic ion transport and metabolism; q, Secondary metabolites biosynthesis, transport and catabolism; r, General function prediction only; s, Function unknown; t, Signal transduction mechanisms; u, Intracellular trafficking secretion and vesicular transport; v, Defense mechanisms; w, Extracellular structures; y, Nuclear structure; z, Cytoskeleton.
KEGG pathway analysis of DEGs
Pathway analysis can help understand the biological functions of specific genes. To estimate the functions of the differentially expressed genes in A. cinerarius between southern and northern Xinjiang, biological metabolic pathways were investigated by KEGG pathway analysis. The predicted pathways represented the majority of biochemical pathways including genetic information processing, cellular processes, metabolism and organism systems. The results showed that the pupa had the most significant difference when compared with male adult and female adult A. cinerarius. We identified a total of 834 DEGs in the comparison of male adult A. cinerarius between south and north Xinjiang. These pathways mainly included ‘Oxidative phosphorylation’ (40; 4.80%), ‘Protein processing in endoplasmic reticulum’ (22; 2.64%), ‘Purine metabolism’ (22; 2.64%), ‘Carbon metabolism’ (22; 2.64%) and ‘Spliceosome’ (20; 2.40%) (Fig. 5A).
Moreover, 893 DEGs was detected in the comparison of male adult A. cinerarius in the KEGG pathway. The pathway with the greatest numbers of unique genes was for proteins involved in ‘Ribosome’ (29; 3.25%), ‘Oxidative phosphorylation’ (27; 3.02%), ‘Peroxisome’ (25; 2.80%), ‘Lysosome’ (23; 2.58%), ‘Protein processing in endoplasmic reticulum’ (22; 2.46%), ‘Purine metabolism” (22; 2.46%) and ‘Biosynthesis of amino acids’ (22; 2.64%) (Fig. 5B).
In addition, 9,022 DEGs were observed in the comparison of A. cinerarius pupae in the KEGG pathways. The pathways with highest unigene representation were ‘Endoplasmic reticulum’ (250; 2.77%), ‘Ribosome’ (244; 2.7%) and ‘RNA transport’ (234; 2.59%), followed by ‘Purine metabolism’ (219; 2.43%), ‘Oxidative phosphorylation’ (208; 2.3%), and ‘Spliceosome’ (208; 2.3%) (Fig. 5C).
Enrichment analysis of KEGG pathway of DEGs
Enrichment factor is the ratio between the proportions of DEGs annotated to pathway and the scale of all genes noted in the pathway. The enrichment degree of pathway was analyzed by enrichment factor and the significance of enrichment was calculated from the Fisher’s exact test. The larger the enrichment factor the more significant enrichment level in the pathway. The calculation formula of enrichment factor is as follows:

To identify the degree of gene enrichment in the signal pathways of metabolism or significant enrichment, the DEGs were mapped to KEGG database. Twenty metabolic pathways in which the most common sequences annotated in the comparison of male adult A. cinerarius between south and north Xinjiang were (Fig. 6A): Ascorbate and aldarate metabolism, biosynthesis of unsaturated fatty acids, cysteine and methionine metabolism, and drug metabolism-other enzymes. Sequences annotated in the comparison of female adult A. cinerarius between south and north Xinjiang belonged mainly to 20 metabolic pathways (Fig. 6B) including alpha-linolenic acid metabolism, ascorbate and aldarate metabolism, biosynthesis of unsaturated fatty acids, and cardiac muscle contraction. Sequences annotated in the comparison of A. cinerarius pupa between south and north Xinjiang belonged to 20 metabolic pathways (Fig. 6C) including basal transcription factors, citrate cycle, dorso-ventral axis formation, and endocytosis.
Discussion
n Xinjiang, A. cinerarius is regarded as a general pest and is widely distributed in south and north Xinjiang. Both are more than 1,600 kilometers apart and the environmental conditions in the two regions are different. The differences in morphology, biology, and gene expression of A. cinerarius may be related to the geographical isolation and different geographical climate, soil type, soil temperature and humidity, illumination, precipitation, and vegetation, with vegetation likely contributing to a large extent to the differences in gene expression.
Our results showed that the method of paired-end sequencing used in this study increased the depth of sequencing and improved the efficiency and accuracy of de novo splicing (Fullwood et al., 2009), resulting in a higher integrity in the assembly. After bioinformatics analysis, 30,539 unigenes (43.38%) were successfully annotated and 39,858 unigenes (56.62%) remained unannotated. Two reasons could have contributed to this effect. On one hand, the length of unigene sequence was shorter, and the proportion of the length distribution under 500 nt was 30.9%, making it difficult to obtain homologous comparison, which increased the difficulty of the functional annotation of the gene; on the other hand, there was a temporary shortage of biological information in the genetic database, and some genes without robust expression may not be accurately annotated. All of the unigenes were annotated in the NR, Swiss-Prot, KOG, Pfam, eggNOG, KEGG, COG, and GO databases. The results of GO annotation showed that the differences among A. cinerarius in south and north Xinjiang were related to the courses of metabolic process, cellular process, single-organism process, cell part, cell, catalytic activity, and binding. COG results revealed that the distinction was bound to the processes of general function prediction only, amino acid transport and metabolism, replication and recombination, and repair. KEGG analysis explained that the difference was connected to the pathways of oxidative phosphorylation, protein processing in endoplasmic reticulum, and purine metabolism. These results allow further studies on the regularity of genetic structure in A. cinerarius populations, and also provide a foundation to strategize pest control.
Selecting a sufficient sample size and appropriate sampling methods is the key to improving the reliability of test results. General population sampling is conducted by random sampling and random selection of unrelated individuals in the group. The sample size selected in this study was insufficient, and the population quantity and the sample quantity should be expanded.
The research of genetic diversity was employed to clearly understand the origin and evolution of biodiversity, which provided a scientific basis for the genetic breeding and genetic improvement of animals and plants. Genetic diversity studies can be carried out at four different levels, namely, morphology, cytology, biochemistry, and molecules, and the genetic information of the species is revealed by different labeling techniques. Genetic variability was evaluated mainly based on molecular level analysis and morphology. The diversity of different geographic populations was further studied at the cellular level and molecular level (mitochondrial DNA and ribosomal gene sequences), particularly by studying the heredity of mitochondrial DNA, which is passed on maternal genes. Ribosomes gene sequence (rDNA) can reflect the genetic relationship of biological species and the degree of variation among biological species. In addition, genetic hybridization experiments are carried out in geographical populations. In this manner, the gene pool of A. cinerarius can be enriched and the scientific basis for its prevention and protection of forest resources can be improved.
Conclusions
In this study, we present a rapid and cost-effective method for transcriptome and DGE analysis using Illumina sequencing technology. In total, 2,089, 2,420, and 18,056 DEGs were obtained in a comparison of male adult, female adult, and pupa of A. cinerarius in different geographical regions. We have shown that climate differences in southern and northern Xinjiang may have induced significant changes in the gene expression of A. cinerarius. These findings contribute substantially to the existing sequence resources of A. cinerarius. Additionally, we have demonstrated the feasibility of using the Illumina sequencing-based DGE system for gene expression profiling, and we have provided new leads for functional studies of genes involved in A. cinerarius development. These results may be useful for the characterization of the precise molecular mechanisms underlying insecticide resistance in different life stages of A. cinerarius and will facilitate the development of rational approaches to improve the management of this pest and the development of new insecticides for control.
Acknowledgment
This work was supported by the Projects Subsidized Forestry Development (grant no. S2012354) and the Special Fund for the Construction of Prevention and Control System of the Pest of Forest Fruit (grant no. 2010120).
Statement of conflict of interest
The authors have declared no conflict of interest.
References
Altschul, S.F., Madden, T.L., Schäffer, A.A., Zhang, J., Zhang, Z., Miller, W. and Lipman, D.J., 1997. Gapped BLAST and PSI-BLAST: a new generation of protein database search programs. Nucl. Acids Res., 25: 3389-3402. https://doi.org/10.1093/nar/25.17.3389
Apweiler, R., Bairoch, A., Wu, C.H., Barker, W.C., Boeckmann, B., Ferro, S., Gasteiger, E., Huang, H., Lopez, R., Magrane, M., Martin, M.J., Natale, D.A., O’Donovan, C., Redaschi, N. and Yeh, L.S.L., 2004. UniProt: The Universal Protein knowledgebase. Nucl. Acids Res., 32: D115-119. https://doi.org/10.1093/nar/gkh131
Ashburner, M., Ball, C.A., Blake, J.A., Botstein, D., Butler, H., Cherry, J.M., Davis, A.P., Dolinski, K., Dwight, S.S., Eppig, J.T., Harris, M.A., Hill, D.P., Issel-Tarver, L., Kasarskis, A., Lewis, S., Matese, J.C., Richardson, J.E., Ringwald, M., Rubin, G.M. and Sherlock, G., 2000. Gene ontology: Tool for the unification of biology. Nature Genet., 25: 25-29. https://doi.org/10.1038/75556
Asmann, Y.W., Wallace, M.B. and Thompson, E.A., 2008. Transcriptome profiling using next-generation sequencing. Gastroenterology, 135: 1466-1468. https://doi.org/10.1053/j.gastro.2008.09.042
Bhatnagar-Mathur, P., Vadez, V. and Sharma, K.K., 2008. Transgenic approaches for abiotic stress tolerance in plants: retrospect and prospects. Pl. Cell Rep., 27: 411-424. https://doi.org/10.1007/s00299-007-0474-9
Boguski, M.S., Tolstoshev, C.M. and Bassett, D.E., 1994. Gene discovery in dbEST. Science, 265: 1993–1994. https://doi.org/10.1126/science.8091218
Chen, X., Hu, Y., Zheng, H., Cao, L., Niu, D., Yu, D., Sun, Y., Hu, S. and Hu, F. 2012. Transcriptome comparison between honey bee queen- and worker-destined larvae. Insect Biochem. mol. Biol., 42: 665-673. https://doi.org/10.1016/j.ibmb.2012.05.004
Chinnusamy, V., Zhu, J.H. and Zhu, J.K., 2007. Cold stress regulation of gene expression in plants. Trends Pl. Sci., 12: 444-451. https://doi.org/10.1016/j.tplants.2007.07.002
Deng, Y.Y., Li, J.Q., Wu, S.F., Zhu, Y.P., Chen, Y.W. and He, F.C., 2006. Integrated nr database in protein annotation system and its localization. Comput. Eng., 32: 71-74.
Denoeud, F., Aury, J.-M., Da Silva, C., Noel, B., Rogier, O., Delledonne, M., Morgante, M., Valle, G., Wincker, P., Scarpelli, C., Jaillon, O. and Artiguenave, F., 2008. Annotating genomes with massive-scale RNA sequencing. Genome Biol., 9: 1-12. https://doi.org/10.1186/gb-2008-9-12-r175
Dobin, A., Davis, C. A., Schlesinger, F., Drenkow, J., Zaleski, C., Jha, S., Batut, P., Chaisson, M. and Gingeras, T. R., 2013. Star: ultrafast universal RNA-seq aligner. Bioinformatics, 29:15-21. https://doi.org/10.1093/bioinformatics/bts635
Eddy, S.R., 1988. Profile hidden Markov models. Bioinformatics, 14: 755-763. https://doi.org/10.1093/bioinformatics/14.9.755
Filichkin, S.A., Priest, H.D., Givan, S.A., Shen, R., Bryant, D.W., Fox, S.E., Wong, W.K. and Mockler, T.C., 2010. Genome-wide mapping of alternative splicing in Arabidopsis thaliana. Genome Res., 20: 45-58. https://doi.org/10.1101/gr.093302.109
Finn, R.D., Bateman, A., Clements, J., Coggill, P., Eberhardt, R.Y., Eddy, S.R., Heger, A., Hetherington, K., Holm, L., Mistry, J., Sonnhammer, E.L.L., Tate, J. and Punta, M., 2014. Pfam: The protein families database. Nucl. Acids Res., 42: D222-230. https://doi.org/10.1093/nar/gkt1223
Fullwood, M.J., Wei, C.L., Liu, E.T. and Ruan, Y.J., 2009. Next-generation DNA sequencing of paired-end tags (PET) for transcriptome and genome analyses. Genome Res., 19: 521 -532. https://doi.org/10.1101/gr.074906.107
Furniss, R.L. and Carolin, V.M., 2015. Western forest insects. IN USDA For. Serv. Misc. Publ., 26: 145-146.
Grabherr, M.G., Haas, B.J., Yassour, M., Levin, J.Z., Thompson, D.A., Amit, I., Adiconis, X., Fan, L., Raychowdhury, R., Zeng, Q., Chen, Z., Mauceli, E., Hacohen, N., Gnirke, A., Rhind, N., di Palma, F., Birren, B.W., Nusbaum, C., Lindblad-Toh, K., Friedman, N. and Regev, A., 2011. Full-length transcriptome assembly from RNA-Seq data without a reference genome. Nature Biotechnol., 29: 644-652. https://doi.org/10.1038/nbt.1883
Gray, J., Dantas-Torres, F., Estrada-Pena, A. and Levin, M., 2015. Systematics and ecology of the brown dog tick, Rhipicephalus sanguineus. Ticks Tick-borne Dis., 6: 872. https://doi.org/10.1016/j.ttbdis.2015.06.011
Huerta-Cepas, J., Szklarczyk, D., Forslund, K., Cook, H., Heller, D., Walter, M.C., Rattei, T., Mende, D.R., Sunagawa, S., Kuhn, M., Jensen, L.J., von Mering, C. and Bork, P., 2015. eggNOG 4.5: a hierarchical orthology framework with improved functional annotations for eukaryotic, prokaryotic and viral sequences. Nucl. Acids Res., 44: D286-293. https://doi.org/10.1093/nar/gkv1248
Hurd, P.J. and Nelson, C.J., 2009. Advantages of next-generation sequencing versus the microarray in epigenetic research. Briefing Funct. Genom. Proteom., 8: 174-183. https://doi.org/10.1093/bfgp/elp013
Ives, W.G.H. and Wong, H.R., 1998. Tree and shrub onsects of the Prairie Provinces. Can. For. Ser., Northern For. Center, Inf. Rep., NOR-X-292: pp. 327.
Kanehisa, M., Goto, S., Kawashima, S., Okuno, Y. and Hattori, M., 2004. The KEGG resource for deciphering the genome. Nucl. Acids Res., 32: D277-280. https://doi.org/10.1093/nar/gkh063
Koonin, E.V., Fedorova, N.D., Jackson, J.D., Jacobs, A.R., Krylov, D.M., Makarova, K.S., Mazumder, R., Mekhedov, S.L., Nikolskaya, A.N., Rao, B.S., Rogozin, I.B., Smirnov, S., Sorokin, A.V., Sverdlov, A.V., Vasudevan, S., Wolf, Y.I., Yin, J.J. and Natale, D.A., 2004. A comprehensive evolutionary classification of proteins encoded in complete eukaryotic genomes. Genome Biol., 5: R7. https://doi.org/10.1186/gb-2004-5-2-r7
Langmead, B., Trapnell, C., Pop, M. and Salzberg, S.L., 2009. Ultrafast and memory-efficient alignment of short DNA sequences to the human genome. Genome Biol., 10: R25. https://doi.org/10.1186/gb-2009-10-3-r25
Levin, M.L., Studer, E., Killmaster, L., Zemtsova, G. and Mumcuoglu, K.Y., 2012. Crossbreeding between different geographical populations of the brown dog tick, Rhipicephalus sanguineus (Acari: Ixodidae). Exp. appl. Acarol., 58: 51-68. https://doi.org/10.1007/s10493-012-9561-x
Li, B. and Colin, N.D., 2011. RSEM: Accurate transcript quantification from RNA-Seq data with or without a reference genome. BMC Bioinform., 12: 323. https://doi.org/10.1186/1471-2105-12-323
Liu, S.X., Xue, D.Y., Cheng, R. and Han, H.X., 2014. The complete mitogenome of Apocheima cinerarius, (Lepidoptera: Geometridae: Ennominae) and comparison with that of other lepidopteran insects. Gene, 547: 136-144. https://doi.org/10.1016/j.gene.2014.06.044
Lockhart, D.J., Dong, H., Byrne, M.C., Follettie, M.T., Gallo, M.V., Chee, M.S., Mittmann, M., Wang, C., Kobayashi, M., Norton, H. and Brown, E.L., 1996. Expression monitoring by hybridization to high-density oligonucleotide arrays. Nature Biotechnol., 14: 1675-1680. https://doi.org/10.1038/nbt1296-1675
Lou, Y., Zhang, Y., Qiu, J.H., Gao, J.F., Wang, W.T., Xiao, J.Y., Chang, Q.C. and Wang, C.R., 2015. Sequence variability in four mitochondrial genes among pinworm Aspicularis tetraptera isolates from laboratory mice in four provinces, China. Mitochond. DNA, 26: 431-434. https://doi.org/10.3109/19401736.2013.855736
Maher, C.A., Kumar-Sinha, C., Cao, X., Kalyana-Sundaram, S., Han, B., Jing, X., Sam, L., Barrette, T., Palanisamy, N. and Chinnaiyan, A.M., 2009. Transcriptome sequencing to detect gene fusions in cancer. Nature, 458: 97-101. https://doi.org/10.1038/nature07638
Mardis, E.R., 2008. The impact of next-generation sequencing technology on genetics. Trends Genet., 24:142-149. https://doi.org/10.1016/j.tig.2007.12.006
McKenna, A., Hanna, M., Banks, E., Sivachenko, A., Cibulskis, K., Kernytsky, A., Garimella, K., Altshuler, D., Gabriel, S., Daly, M. and DePristo, M.A., 2010. The genome analysis toolkit: A MapReduce framework for analyzing next-generation DNA sequencing data. Genome Res., 20: 1297-1303. https://doi.org/10.1101/gr.107524.110
Millar, J.G., Giblin, M., Barton, D., Reynard, D.A., Neill, G.B. and Undrhill, E.W. 1990. Identification and field testing of female-produced sex pheromone components of the spring cankerworm, Paleacrita vernata Peck (Lepidoptera: Geometridae). J. chem. Ecol., 16: 3393-3409. https://doi.org/10.1007/BF00982106
Mortazavi, A., Williams, B.A., McCue, K., Schaeffer, L. and Wold, B., 2008. Mapping and quantifying mammalian transcriptomes by RNA-Seq. Nature Methods, 5: 621-628. https://doi.org/10.1038/nmeth.1226
Pan, Q., Shai, O., Lee, L.J., Frey, B.J. and Blencowe, B.J., 2008. Deep surveying of alternative splicing complexity in the human transcriptome by high-throughput sequencing. Nature Genet., 40: 1413-1415. https://doi.org/10.1038/ng.259
Qing, W., Adil, S. and Yan, W.B., 2016. Bionomics of Apocheima cinerarius Erschoff. Chinese J. Appl.Entomol., 53: 174-174. https://doi.org/10.7679/j.issn.2095-1353.2016.022
Schena, M., Shalon, D., Davis, R.W. and Brown, P.O., 1995. Quantitative monitoring of gene-expression patterns with a complementary DNA microarray. Science, 270: 467-470. https://doi.org/10.1126/science.270.5235.467
Severin, A.J., Woody, J.L., Bolon, Y.-T., Joseph, B., Diers, B.W., Farmer, A.D., Muehlbauer, G.J., Nelson, R.T., Grant, D., Specht, J.E., Graham, M.A., Cannon, S.B., May, G.D., Vance, C.P. and Shoemaker, R.C., 2010. RNA-Seq Atlas of Glycine max: A guide to the soybean transcriptome. BMC Pl. Biol., 10: 160. https://doi.org/10.1186/1471-2229-10-160
Tatusov, R.L., Galperin, M.Y., Natale, D.A. and Koonin, E.V., 2000. The COG database: A tool for genome-scale analysis of protein functions and evolution. Nucl. Acids Res., 28: 33-36. https://doi.org/10.1093/nar/28.1.33
Trapnell, C., Williams, B.A., Pertea, G., Mortazavi, A., Kwan, G., van Baren, M.J., Salzberg, S.L., Wold, B.J. and Pachter, L., 2010. Transcript assembly and quantification by RNA-Seq reveals unannotated transcripts and isoform switching during cell differentiation. Nat. Biotechnol., 28: 511-515. https://doi.org/10.1038/nbt.1621
Velculescu, V.E., Zhang, L., Vogelstein, B. and Kinzler, K.W., 1995. Serial analysis of gene expression. Science, 270: 484-487. https://doi.org/10.1126/science.270.5235.484
Wang, E.T., Sandberg, R., Luo, S., Khrebtukova, I., Zhang, L., Mayr, C., Kingsmore, S.F., Schroth, G.P. and Burge, C.B., 2008. Alternative isoform regulation in human tissue transcriptomes. Nature, 456: 470-476. https://doi.org/10.1038/nature07509
Wang, K.J. and Li, X.H., 2012. Genetic characterization and gene flow in different geographical-distance neighbouring natural populations of wild soybean (Glycine soja Sieb. and Zucc.) and implications for protection from GM soybeans. Euphytica, 186: 817-830. https://doi.org/10.1007/s10681-012-0621-4
Wang, Z., Gerstein, M. and Snyder, M., 2009. RNA-Seq: a revolutionary tool for transcriptomics. Nat. Rev. Genet., 10: 57-63. https://doi.org/10.1038/nrg2484
Wei, W.L., Qi, X.Q., Wang, L.H., Zhang, Y.X., Hua, W. and Li, D.H., Lv, H.X. and Zhang, X.R., 2011. Characterization of the sesame (Sesamum indicum L.) global transcriptome using Illumina paired-end sequencing and development of EST-SSR markers. BMC Genom., 12: 451. https://doi.org/10.1186/1471-2164-12-451
Xie, C., Mao, X., Huang, J., Ding, Y., Wu, J., Dong, S., Kong, L., Gao, G., Li, C.-Y. and Wei, L., 2011. KOBAS 2.0: a web server for annotation and identification of enriched pathways and diseases. Nucl. Acids Res., 39: W316-322. https://doi.org/10.1093/nar/gkr483
Xie, X.L. and Liu, R.H., 2014. Study on the occurrence rule and living habit of Apocheima cinerarius Erschoff. Auhui Agri. Sci. Bull., 20: 83-84. https://doi.org/10.16377/j.cnki.issn1007-7731.2014.12.027
Xu, Y., Zhou, W.W., Zhou, Y.J., Wu, J.X. and Zhou, X.P., 2012. Transcriptome and comparative gene expression analysis of Sogatella furcifera (horváth) in response to southern rice black-streaked dwarf virus. PLoS One, 7: e36238. https://doi.org/10.1371/journal.pone.0036238
Zhang, Z.L., Li, S.J., Li, S. and Wang, S.L., 2011. Artificial mass propagation techniques of Apocheima cinerarius NPV. For. Pest Dis., 30: 26-28.
To share on other social networks, click on any share button. What are these?


