
An Estimation of Technical Efficiency of Strawberry Production in District Charsadda Khyber Pakhtunkhwa


Research Article
An Estimation of Technical Efficiency of Strawberry Production in District Charsadda Khyber Pakhtunkhwa
Muhammad Tariq1*, Muhammad Khawar Hussain1, Zilakat Khan Malik2 and Noor Jehan1
1Department of Economics Abdul Wali Khan University Mardan, Pakistan; 2Department of Economics, University of Peshawar, Khyber Pakhtunkhwa, Pakistan.
Abstract | The study used a Stochastic Frontier Approach for measuring the technical efficiency of strawberry production at farm level. For this purpose data has been collected from 382 randomly selected strawberry producers of two purposively selected villages of district Charsadda. Out of 382 producers 176 were located in Tebana Dhere and 206 in Sarkai village. It is find out that 47% of land area was under the cultivation of strawberry with average production of 2898 kilogram per acre. The per acre average values of land preparation, NPK fertilizer, labor, seedling, farm yard manure and pesticides were recorded 6.00 hrs, 248 kgs, 143 man days, 24413 seedling, 1.48 trollies and 1.21 litres respectively. The results also showed that strawberry producers were having 81% of mean technical efficiency with minimum to maximum technical efficiency limits of 0.42% to 0.98% respectively. Moreover out of 382 the technical efficiency of 178 farmers was more than 90%. Furthermore, farmers with more years of schooling, greater age, smaller farm size, greater experience and obtained credit were having 82%, 83%, 83%, 87% and 84% technical efficiency respectively. The study results suggested that’ education, training and credit availability can play a significant role in increasing the output efficiency of strawberry farmers in the study area.
Received | March 29, 2017; Accepted | January 15, 2018; Published | February 10, 2018
*Correspondence | Muhammad Tariq, Department of Economics Abdul Wali Khan University Mardan, Pakistan; Email: tariq_noor@awkum.edu.pk
Citation | Tariq, M., M.K. Hussain, Z.K. Malik and N. Jehan. 2018. An estimation of technical efficiency of strawberry production in District Charsadda Khyber Pakhtunkhwa. Sarhad Journal of Agriculture, 34(1): 93-101.
DOI | http://dx.doi.org/10.17582/journal.sja/2018/34.1.93.101
Keywords | Technical efficiency, Stochastic Frontier Approach, Stawberry, Charsadda
Introduction
Strawberry fruits are considered a great source of vitamin C which strengthens the immune system, prevents blindness in older age, helps in fighting against cancer, boost up heart health, decrease joints inflammation, obesity and diabetes (Wysocki et al., 2012; Afrin et al., 2016). Amongst the entire berry bearing plants, strawberries are an important source of diet which contains calories, vitamins, fiber, phosphorus, calcium, iron, magnesium and potassium (Hakala et al., 2003). The vitamins which are found in strawberries include vitamins A, B1, B2 and C (Rejman and Makosz, 1994). Moreover, because of its high water content strawberry fruits are having a juicy and refreshing taste (Skupień and Oszmiański, 2007). Strawberry fruit is one of the important small fruit item and it has been grown in many countries of the world. Strawberries are mostly grown in Japan, Italy and United States of America. Specifically, California, Florida and Quebec are the major producers of strawberry in the world. According to 2013 estimations the worldwide annual consumption of strawberries was 1533000 tonnes (Depardieu et al., 2016). It is one of the richest sources of vitamin C. Hundred grams of strawberry contain about 90 gram of water, fats of 0.5 gram, ascorbic acid of 59 gram, carbohydrates of 8.4 gram and proteins of 0.07 gram. Strawberry is used in jellies, squashes and jams etc. (Galletta and Bringhurst, 1995).
In Pakistan, Strawberry fruit comes out during April to May. Because it needs low temperature so it is usually grown in sub-tropical and tropical regions of the country (Asad, 1997). Mardan, Charsadda, Lahore and Islamabad are the major strawberry producing areas and from these areas it is usually supply to the other parts of the country. The fruit maturity period is short and ranges from 30-40 days. Because of its greater perishable nature it is consumed right after picking it. Strawberry is a very delicate fruit and its deterioration chances are greater so it needs proper care for the purpose of transporting it to different markets (Amin, 1996).Generally the processing of strawberry and its yielding future in Pakistan is too much bright and shinning particular in Khyber Pakhtunkhwa and it is because of this reason strawberry gives the highest economic returns to the farmers in the country (SMEDA, 2009). Mulching and irrigation can play a significant role in increasing the quality and quantity of strawberry production (Blick et al; 2010).Pakistan can export it to the major world economies like UK, France, Italy, Germany and Europe. Because of its potential market strawberry processing, cultivation and exporting is highly bright and shinning in Pakistan (Aslam and Rasool, 2012). However, strawberry yield varies from 3000 to 5000 kilograms across different farms in Pakistan. Considerable gap in yield of research station and farmers field indicates underutilization of resources because of managerial capabilities (SMEDA, 2009). Khan (2003) concluded that strawberry yield varies because of differences in socioeconomic characteristic of farmers, where farmers with more experience and education obtained high yield.
Previous studies showed that average production of strawberry is not up to the mark. And only a limited number of studies focused on the cost and revenue estimation of strawberry production (Khan, 2003), strawberry production and marketing potential (Asad, 1997), comparative advantage of strawberry production (Sadiq, 2003), future prospects of strawberry production (Mabood, 1994), progress and prospects of strawberry production (Amin,1996) and economic effectiveness of cultivating strawberry (Ahmed, 1992). Moreover, study conducted by Sindh Development Fund in 2009 indicated huge gap in production of strawberry between farmers field and research stations. The wide gap in yield across different farms and low productivity because of difference in managerial abilities indicates the existence of technical inefficiency. Measures of technical efficiency are of great importance in making strategies to enhance productivity, especially where farmers are facing low level of efficiencies. Productivity can be enhanced by use the same inputs and technology in efficient way by improvement in managerial practices, education and skill development. Specifically, education, quality seeds, pesticides and fertilizers to obtained a greater level of production at farm level (Fatima et al., 2016).
The present study has been undertaken with two main objectives. First, it explored the factors which are affecting the production of strawberry fruits in district Charsadda. Second, it also measured the technical efficiency of strawberries production of farmers. This study is important from several aspects. First, it focused on the technical efficiency of strawberries farming in the area of Charsadda which is the leading producer in Khyber Pakhtunkhwa. The identification of factors and measurement of technical efficiency of strawberries can work as a guide line for the farmers and agriculture policy makers regarding the supply and demand management in the whole province and country. Moreover, computation of the technical efficiency of strawberry at farm level can be helpful for the farmers in understanding the level of technical efficiency at different areas and efficiency gap. Furthermore, the study also identified education, training and credit availability as important determinants of strawberry production. This could be helpful for the provincial government in channelization of funds towards farmers training, education and credit schemes.
Materials and Methods
The following section shows information about the data, sample size, sampling method and methodology of the study. The details are as follows.
Sample size and sampling method
Charsadda was the universe of the study. Because most of the strawberry farmers were cultivating in Sarkai and Tebana Dhere villages of the district. Hence, the study was limited to these two villages. The total number of strawberry growers in both the villages were 890, out of which 480 were in village Sarkai and 410 were in Tebana Dhere . A sample size of 382 was selected from both the villages by using the following normal approximation formula (Walpole, 1982).
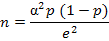
Where, “n” shows the sample size, “𝞪” confidence level,”p”stands for proportion of sample respondents in the ith village and “e” margin of error
After putting the numerical values in the formula, the following sample size has been obtained.
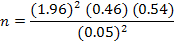

Then the sample size of 382 has been divided between the two villages by using the following proportional allocation method (Cochran, 1977).
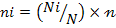
Where;
ni: Stands for the number of strawberry farmers selected from ith village; Ni: Shows the total number of strawberry farmers in the ith village; N: Represents the total number of strawberry farmers in the study area; n: Total sample size.
All the data from the farmers has been collected through a well designed questionnaire consisting of all the important information.
Theoretical framework
The level of technical efficiency of a particular firm can be determined by various factors including farmers’ education, training, farm size, labour and experience etc. And the measurement of a firm technical efficiency is based on the deviations of observed output from the potential output. In other words the ratio of the actual production to potential production define the level of efficiency firms (Farrell, 1957; John, 1980; Greene, 1993).
In the literature two approaches are mostly used for measuring the technical efficiency i.e. Data Envelopment Analysis (DEA) and Stochastic Frontier Analysis (SFA). The DEA is a non-parametric linear programming approach without any functional restrictions which do not take into account random error component. In contrast, the SFA is a parametric approach, involves the estimation of a stochastic production frontier in which the output of a firm is a function of a set of inputs, inefficiency and random error. Because the SFA measures the random error and inefficiency this gives huge edge to it over DEA. The SFA approach seems to be superior to the DEA because in real life the farmers always operate under uncertainty (Ali and Jan, 2016).
The purpose of stochastic frontier analysis is the prediction of the inefficiency effects. The most common output-oriented measure of technical efficiency is the ratio of observed output qi(exp(Xi´β + vi-ui)) to the corresponding stochastic frontier output (exp(Xi´β + vi)) and its formulation can be written as:
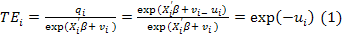
Equation (1) shows the measurement of the output of a firm relative to the output that could be produced by a fully-efficient firm using the same input vector. This measure of technical efficiency takes a value between zero and one. If the technical efficiency value is closer to one, the firm will be called technically efficient and if it is closer to zero then it will be inefficient.
The first step in predicting the technical efficiency is to estimate the parameters of the stochastic production frontier model. The stochastic frontier production model is proposed by Aigner et al. (1977). The functional form of their model was as follows.
Where;
i= 1, 2………N and e = vi+ui.
Yi : Output produced by the ith firm; ƒ(xi; β): Suitable production function of vector xi of inputs for the ith firm and vector β of unknown parameters. ei : Error term made up of two components vi and ui, where vi is a random error having zero mean, which is associated with random factors such as measurement errors in production and weather on which the farmer does not have control and independent of ui. On other hand ui is a non-negative random variable associated with firm-specific factors and associated with technical inefficiency of the farm and ranges between zero and one.
Empirical model
The stochastic frontier function can be estimated through both Cobb-Douglas production function and Trans log production function. Before the estimation generalized likelihood ratio test has been used to know whether Cobb-Douglas production function or Trans log production function is appropriate for the estimation of stochastic frontier function. For this purpose the following generalized likelihood ratio test has been used.

Equation 3 shows the generalized likelihood ratio test (LR) in functional form. Where LHO and LH1are the values of likelihood function for null and alternate hypotheses HO and H1 respectively. The test statistic used follows the asymptotic Chi-square distribution, where degree of freedom is equal to differences between number of parameters between restricted and unrestricted models.
The results of the LR ratio supported the Cobb Douglas production function for the estimation of stochastic frontier function. Hence, Cobb Douglas production function has been used for the estimation. Cobb-Douglass production function is considered the baseline for model building in all studies which focused on estimation of production in any sector of the economy.
For the empirical estimation of the results, the following augmented form of the Cobb- Douglas production has been used.
lnY= α. + α1 lnX1+ α2 lnX2+ α3 lnX3+ α4 lnX4+ α5 lnX5+ α6 lnX6+ α7 lnX7+ α8 lnX8+ α9 Dm+ ei…………(4)
Whereas;
lnY: Natural log of Output obtained by ith farmer per acre; lnX1: Natural log of liters of pesticide used per acre; lnX2: Natural log of kilograms of NPK per acre; lnX3:Natural log of FYM used per acre if value of FYM is greater than zero, value of zero is assigned if use of FYM is zero; lnX4: Natural log of Labor days per acre; lnX5: Natural log of Land preparation hours per acre (include tractor and bullock hours); lnX6: Natural log of number of Seedlings per acre; lnX7: Natural log of No of irrigations per acre; lnX8: Natural log of acres of area under strawberry; Dm: Dummy variable for FYM (0 if FYM >1 and 1 if FYM =0).
ei = vi+ui capturing the effect of both pure random shock and inefficiency factors respectively.
Where;
vi = Random variable having normal distribution that is (vi~ N (0, σ2vi)) resembles the noise effects which means this include those variables which are not under the control of farmers and measure the deviation from the production frontier. There lies two conditions either its value is positive or negative. Where positive value shows that the firm production is more than that of efficient frontier and negative value shows the opposite result. ui means inefficiency effects which is due to the farmer’s own fault which means they are under the control of farmers and it also estimate the deviation from production frontier, the changes in such factors brings decrease in farm production in contrast to efficient production frontier. Where vi is normal distribution and ui is half normal distribution. ui is a function of farm and farmer specific abilities (Battee and Collie, 1993). To capture the factors affecting the efficiency the following equation 5 has been developed.

Where;
Z1: Experience of farmer in strawberry cultivation in years; Z2: Year of schooling; Z3: Total farm size in acres; Z4: Dummy of credit variable (1=yes and 0=No); The maximum likelihood estimates of stochastic production frontier and inefficiency models are estimated by Frontier 4.1 computer program.
Results and Discussion
The following section shows information about the socio-economic characteristics and estimation results of the study. The details are as follows:
Socioeconomic characteristics of strawberry farmers
For knowing the socio-economic status of the farmers various questions have been asked from them. It was noted that the land area in district Charsadda has been covered by different types of crops, strawberry, sugarcane, wheat, tomato, potato cauliflower etc. However, amongst all the crops, strawberry, sugarcane and wheat covered most of the area with 47%, 36% and 17% shares respectively. The farmers were growing the strawberries in two seasons i.e. October to November and June to July every year. Similarly, the per acre average production of strawberry, sugarcane and wheat were 1.43, 1.12 and 0.5 respectively. This information has been given in Table 1.
Table 1: Farmers Information about the share of agriculture crops.
| Crop | Unit | Mean | Percent | S.D |
| Strawberry | Per Acre | 1.43 | 47 | 0.59 |
| Sugarcane | Per Acre | 1.12 | 36 | 0.53 |
| Wheat | Per Acre | 0.5 | 17 | 0.23 |
| Total | Per Acre | 3.06 | 100 |
1.58 |
Source: Author’s computation from the field data, 2016.
Table 2: Farmers information regarding per acre inputs and output.
| Variables | Mean | Max. | Min. | S. Deviation |
| Output (KG) | 2898 | 5341 | 1376 | 1022 |
| Land Preparation (Hrs) | 6.00 | 12.00 | 4.00 | 3.36 |
| NKP (kg) | 248 | 370 | 123 | 94 |
| Labour (Man days) | 143 | 245 | 123 | 42 |
| Seedings (Numbers) | 24413 | 28832 | 21949 | 1691 |
| FYM (Trollies) | 1.48 | 5 | 0 | 1.31 |
| Pesticides (Liters) | 1.21 | 2.89 | 0.32 | 0.58 |
| Experience (Years) | 12.7 | 28 | 5 | 4.8 |
| Age (Years) | 45 | 61 | 21 | 7.23 |
|
Education (Years) |
5 | 12 | 0 | 4 |
| Credit (Percent) | 43 | - | - | - |
| Total Farm Size (Acre) | 3.0709 | 5.9 | 1 |
1.58 |
Source: Author’s computation from the field data, 2016.
Similarly, the farmers were also asked about strawberry production and inputs used for it on per acre basis. The information provided by the strawberry farmers has been placed in Table 2. It was find out that the total per acre average strawberry production in the area was 2898 kilograms. And for per acre average production the farmers were using 6 hrs for land preparation, 143 man days of labour, 24413 number of seedings, 348 kg NPK fertilizer, 1.48 trollies for farm yard manure, 1.21 liters pesticides, 12.7 years experience, 45 years age, 5 years education, 43% credit.
Moreover, out of the total 382 strawberries farmers, 162 were cultivating strawberry fruits at land area less than 2 acre and 255 more than 2 acre. The mean age of farmers were found to be 45 years, which vary from min of 21 to max of 61 years of age. Similarly, the average experience of the farmers noted 12.7 years with a minimum and maximum experience of 5 to 28 years respectively. Furthermore, 43% farmers were availing credits from different sources while 57% were having no access to any type of credit facility.
Estimation results
The present section shows the estimation results. The calculated values of the log likelihood ratio were -56.85 and -75.28 for both Trans log and Cobb Douglas production functions. These values were used in the Likelihood test statistic as follows.
LR= [-2(- 75.28+ 56.85) =36.86]…… (6)
The obtained value from the likelihood function was 36.86 which was less than the critical of 43.77. So the null hypothesis of Cobb-Douglas production was more appropriate for the estimation of stochastic frontier function was accepted.
The joint estimation results of the stochastic frontier model and technical inefficiency model has been presented in Table 3. The results of stochastic frontier function estimated through Cobb Douglas production function.
The Cobb Douglas production function results showed that pesticide NPK, land prep showed a positive and significant relationship with output. Where, area turned negatively significant. However, all other variables including FYM, labor, seeding, irrigation and Dummy FYM remained insignificant.
Similarly, to find out the factors determining the farmers’ inefficiency the following results given in Table 3 has been estimated.
The results shows that years of schooling, experience and credit shows negative sign with technical inefficiency which resembles that with the increase in amount of these variables, it will bring down the farmer’s inefficiency level down and make them more technical efficient. The fourth variable which is farm size shows positive relationship with technical inefficiency. The positive sign resembles that if increase in farm size is brought, it will leads the farmers towards technical inefficiency and productivity level will fall.
Parameters of σs2and γ given in Table 3 are for noise effect (vii) and inefficiency effect (ui) and level of significance
Table 3: Joint estimation results of stochastic production frontier model and inefficiency model.
| Models | Variables | Parameters | Coefficients Values | t value | P-Values |
| Stochastic Frontier Model | Intercept |
α0 |
4.799** |
2.05 | 0.023 |
| Ln Pesticide |
α1 |
0.073* |
1.84 | 0.095 | |
| Ln NPK |
α 2 |
0.309*** |
3.86 | 0.003 | |
| Ln FYM |
α3 |
0.005 | 0.21 | 0.256 | |
| Ln Labor |
α 4 |
0.034 | 0.42 | 0.985 | |
| Ln land prep |
α5 |
0.336*** |
3.88 | 0.001 | |
| Ln Seedling |
α 6 |
0.070 | 0.30 | 0.589 | |
| Ln Irrigation |
α 7 |
0.045 | 1.13 | 0.634 | |
| Ln Area |
α 8 |
-0.047** |
-2.27 | 0.043 | |
| Dummy FYM |
α 9 |
0.008 | 0.27 | 0.852 | |
| Technical Inefficiency Model | Intercept |
β0 |
0.426*** |
2.76 | 0.004 |
| Years of schooling |
β1 |
-0.056*** |
-2.94 | 0.001 | |
| Farm size |
β2 |
0.210** |
3.31 | 0.035 | |
| Credit |
β3 |
-0.177* |
-1.80 | 0.072 | |
| Experience |
β4 |
-0.031*** |
-4.92 | 0.006 | |
| Variance Measures | Sigma Squared |
σs2 |
0.044*** |
3.60 | 0.004 |
| Gamma |
γ |
0.958** |
4.28 | 0.015 | |
|
R-Squared: 0.91 Adj. R-Squared: 0.89 F Statistic: 563.34 Prob. F Statistic: 0.000 |
|||||
Note: ***, **and * shows 1%, 5% and 10% level of significance.
Table 4: Distribution of farmers on basis of socioeconomic characteristics and level of technical efficiency.
| Socioeconomic Characteristics of Farmers | Status | No of Farmers | Average Level of Technical Efficiency |
| Age (Years) | Below 40 | 111 | 0.75 |
| Above 40 | 271 | 0.83 | |
| Education Level | Primary | 244 | 0.80 |
| Middle | 55 | 0.81 | |
| High | 83 | 0.82 | |
| Cultivated Area | Less than 2 acre Cultivated Area | 162 | 0.83 |
| More than 2 acre Cultivated Area | 220 | 0.79 | |
| Experience (Years) | Less than 12 years Experience | 155 | 0.74 |
| More than12 years Experience | 227 | 0.87 | |
| Credit | Yes | 162 | 0.84 |
| No | 220 |
0.78 |
Source: Author’s computation from the field data, 2016.
is 1%. The 0.95 value for γ shows the difference in management which strongly effects the production of strawberry growers.
The R-Squared value is 0.91 showing that the independent variables explained 91% percent variation in the dependent variable.
Similarly Table 4 shows the results for the role of role of socio-economic characteristics of the farmers in the determination of technical efficiency. Table 5 shows that average level of technical efficiency was 0.83 for farmers whose ages were greater than 40 and 0.75 for farmers whose ages were less than 40. Similarly, the average levels of technical efficiency were 0.82, 0.81 and 0.80 for farmers having high, middle and primary level of education respectively. Moreover, the farmers cultivating strawberries at less than two acre of land were having 0.83 average level of technical efficiency and 0.79 for farmers having more than two acre cultivated land area. Farmers having more than 12 years experience were having 0.87 average level of technical efficiency. And those farmers whose experience was less than 12 years were having 0.74 average level of technical efficiency. Furthermore, farmers who were having credit facility were having 0.84 average level of technical efficiency. And those farmers who could not have access to any credit facility were having 0.78 average level of technical efficiency. Overall the results showed that farmers age, educational level, cultivated land area, experience and credit affecting their average level of technical efficiency in the study area.
Table 5: Distribution of strawberry farmers on basis of technical efficiency.
| Technical Efficiency | Percentage | No of Farmers |
| <0.60 | 10.00 | 39 |
| 0.60 – 0.69 | 27.39 | 106 |
| 0.70 – 0.79 | 03.35 | 13 |
| 0.80 – 0.89 | 13.17 | 51 |
| >0.90 | 45.99 | 178 |
| Max | 98 | -- |
| Min | 42 | -- |
| Mean | 81 | -- |
| Efficiency Gap | 19 |
-- |
Source: Author’s computation from the field data, 2016.
Moreover, to know the efficiency gap of all strawberry farmers, they were categorized into different groups. This information has been given in Table 5 as under. The results showed that out of 382 farmers 39 were having less than 0.60 level of technical efficiency, 106 farmers 0.60 to 0.69 technical efficiency level, 13 farmers technical efficiency was in the range of 0.70 to 0.79, 51 farmers technical efficiency was in between 0.80 to 0.89 and 178 farmers were having technical efficiency level greater than 0.90. Similarly, the mean technical efficiency of all farmers were 81% with minimum and maximum ranges of 42% and 98%. The efficiency gap of the farmers was 19% which was computed by subtracting the mean efficiency level from the efficiency optimum value of 1. The gap in efficiency level shows that the resources are underutilized by those strawberry farmers who are facing less level of efficiency. The increased in yield can be brought by using the resources more efficiently.
Furthermore, Table 6 shows the computation of the technical efficiency levels on per acre scale for all strawberry farmers. The farmers have been categorized into two groups on the basis of technical efficiency level. One group of the farmers were those whose technical efficiency level was below 90% and other group consisting of those farmers whose technical efficiency level was greater than 90%. T-test has been used for the comparison of both groups. The results showed clear difference between the two groups’ yields, land preparation, NPK, seedling, labor, FYM, pesticides, experience, age, education, credit and farm size. It was find out that those farmers whose technical efficiency was less than 90% their per acre output was 2714kgs, per acre average tractor hours were 8.89, per acre average fertilizer utilization was 276kgs and per acre average labor was 161 man days. In contrast those farmers whose technical efficiency level greater than 90% their per acre output was 3153kgs, per acre average tractor hours were 7.36 hrs, per acre average fertilizer utilization was 247kgs and per acre average labor was 145 man days respectively. The t-test supported these all these results. These findings showed that there was a significant difference between output and inputs efficiencies between the two groups of farmers divided on basis of 90% technical efficiency scale. However, the coefficients of the variables farm yard manure, seeding and pesticides remained insignificant for both the groups showing no significant differences between both groups on basis of these variables. In Table 6, the information regarding the socio-economic characteristics of strawberry growers has also been given. The findings revealed that credit, age and experience are playing a significant in making one group more than 90% technical efficient and other below than 90% technical efficient. However, farm size and education remained insignificant.
Table 6: Comparison of farmers on per acre technical efficiency levels.
| Variables | Technical Efficiency < 90 % | Technical Efficiency ≥ 90% | |||
| S.D | Mean | S.D | Mean | t-value | |
| Yield(Kg) | 787 | 2714 | 1126 | 3153 |
-3.35*** |
| Land prep(Hours) | 2.96 | 8.89 | 3.58 | 7.36 |
2.55** |
| NPK(Kg) | 89 | 276 | 97 | 247 |
1.70* |
| Labor (Man days) | 1.28 | 161 | 43.45 | 145 |
2.12** |
| Seedlings(Numbers) | 1484 | 24484 | 1870 | 25291 | 0.96 |
| FYM(Trollies) | 1.28 | 1.73 | 1.34 | 1.45 | 1.16 |
| Pesticides(Liters) | 0.56 | 1.28 | 0.60 | 1.10 | 0.94 |
| Experience(Years) | 4.32 | 12 | 4.2 | 16 |
-5.26*** |
| Age(Years) | 7.33 | 42 | 5.96 | 48 |
-4.68*** |
| Education(Years) | 3.92 | 5 | 4.70 | 4 | 0.86 |
| Credit(Percent) | 0.46 | 31 | 0.50 | 55 |
-2.67*** |
| Farm size(Acre) | 1.47 | 3.28 | 1.68 | 2.95 |
1.49 |
Note: ***, **and * shows 1%, 5% and 10% level of significance.
Conclusions and Reccomendations
The study used a Stochastic Frontier Approach for measuring the technical efficiency of strawberry production at farm level in district Charsadda. The results showed that 47% of land area was under the cultivation of strawberry with average production of 2898 kilogram per acre. The per acre average values of land preparation, NPK fertilizer, labor, seedling, farm yard manure and pesticides were recorded 6.00 hrs, 248 kgs, 143 man days, 24413 seedling, 1.48 trollies and 1.21 litres respectively. The results also showed that strawberry producers were having 81% of mean technical efficiency with minimum to maximum technical efficiency limits of 0.42% to 0.98% respectively. Moreover out of 382 the technical efficiency of 178 farmers was more than 90%. Furthermore, it is also found out that strawberry farmers with more years of schooling, greater age, smaller farm size, greater experience and obtained credit were comparatively technical efficiency. The findings of the study suggested that education, training opportunities and credit facilitiescan play a significant role in increasing the output efficiency of strawberry farmers in district Charsadda.
Author’s Contribution
Muhammad Tariq developed the idea and wrote the article. Muhammad Khawar Hussain developed the questionnaire and collected data. Zilakat Khan Malik helped in the data analysis and manuscript editing. Noor Jehan contributed in the literature review, citations and references style.
References
Afrin, S., M. Gasparrini, T.Y.F. Hernandez, P.R. Rodriguez, B. Mezzetti, A.V. Lopez, F. Giampieri and M. Battino 2016. Promising health benefits of the strawberry: a focus on clinical studies. J. Agric. Food Chem. 64 (22): 4435-4449. https://doi.org/10.1021/acs.jafc.6b00857
Ahmed, S. 1992. Determining the economic effectiveness of cultivating straweberry. Prog. F. 2(6):24-28.
Aigner, D., C.A.K. Lovell and P. Schmidt. 1977. Formulation and estimation of stochastic frontier production function models. J. Econ. 6:21-37. https://doi.org/10.1016/0304-4076(77)90052-5
Ali, A. and A.U. Jan 2016. Analysis of technical efficiency of sugarcane crop in khyber pakhtunkhwa: a stochastic frontier approach. Sarhad J. Agric. 33 (1): 69-79. https://doi.org/10.17582/journal.sja/2017.33.1.69.79
Amin. 1996. Progress and prospects of strawberry production in NWFP. Annual Report Agriculture Research Station North Mingora, Swat. 212:4-7.
Asad. 1997. Strawberry production and marketing potentials. Advisory Leaflet of MFVDP.30:1-2.
Aslam, M. and S. Rasool. 2012. Potential of strawberry’s export from Pakistan. http://pkeconomists.com/potential-fstrawberrys-export-from-pakistan
Battese, G.E. and T.J. Coelli. 1995. A model for technical inefficiency effects in a stochastic frontier production function for panel data. Emp. Econ. 20: 325-332.
Blick, A.P., M.V.E. Grossmann and F. Yamashita. 2010. Biodegradable mulch films for strawberry production. P. Test. 29 (4): 471-476. https://doi.org/10.1016/j.polymertesting.2017.01.025
Cocharn, W.G. 1977. Sampling techniques. 3rd Edition, New York Jhonwiley and Sons.
Coelli, T.J., D.S.P Rao, C.J. O’Donell and G.E. Battese. 1998. An introduction to efficiency and productivity analysis. Springer Science + Business Media, Inc., 233 Spring Street, New York, NY 10013, USA. https://doi.org/10.1007/978-1-4615-5493-6
Depardieu, C., V. Premont, C. Boily and J. Caron. 2016. Sawdust and bark-based substrates for soilless strawberry production: irrigation and electrical conductivity management. Plos. One J. 11(4).
Farrel, M.J. 1957. The measurement of productive efficiency. J. Roy. Stat. Series. 120:253-290. https://doi.org/10.2307/2343100
Fatima, H., L. Almas and B. Yasmin. 2016. Allocative efficiency and profitability analysis of high-tech cotton melon multiple cropping system in Punjab, Pakistan. Sarhad J. Agric. 33 (1): 117-126. https://doi.org/10.17582/journal.sja/2017.33.1.117.126
Food and Agriculture Organization 2010. Top five strawberry producing countries. FAO Statistics 2010-11. FAO, Rome.
Galleta, S. and L.V. Bringhurst. 1995. Small fruit culture and nutritional value. The AV Publishing USA. 5: 357-361.
Government of Pakistan. 2011. Fruits, vegetable and condiments statistics, 2010-11. Ministry of Food, Agriculture and Livestock, Economic Wing, Islamabad.
Government of Sindh. 2009. Strawberry Production in Khairpur. Sindh Developmental Fund, Pakistan.
Greene, W. H. 1993. Frontier production functions. EC-93-20. Stern School of Business, New York University.
Hakala, M., A. Lapvetelainen, R. Houpalahti, H. Kallio and R. Tahvonen 2003. Effects of varieties and cultivations conditions on the composition of strawberries. J. Food Comp. Anal. 16: 67-80. https://doi.org/10.1016/S0889-1575(02)00165-5
John, M. 1980. Technical efficiency and economic performance: some evidence from Ghana. 32(2): 319-339.
Khan, H. 2003. Estimating returns and cost of strawberry production in District Charsadda and Mardan. Agriculture Economics, KPK Agriculture University, Peshawar, Pakistan.
Mabood. 1994. The future prospects of strawberry production in Pakistan. Advisory Leaflet. 17(2).
Rejman, A. and E. Makosz. 1994. Szkotkarstwo roslin sadowniczych. Plantress Krakow, pp. 3-270.
Sadiq, G. and M. Ishaq. 2009. Comparative advantage of strawberry production in subtropical areas of NWFP. Pak. J. Life Soc. Sci. 7(1):59-65.
Skupien K. and J. Oszmianski 2007. Influence of titanium treatment on antioxidant content and antioxidant activity of strawberries. Acta Sci. Pol. 6(4): 83-94.
Small and Medium Enterprise Developmental Athourity. 2009. Economic Profile of Charsadda, Pakistan.
Walpole, R.E. 1982. Introduction to statistics. The University of California, 2nd Edition.
Wysocki, K., T. Banaszkiewicz and J. Kopytowski. 2012. Factors affecting the chemical composition of strawberry fruits. Pol. J. Nat. Sci. 27(1): 5-13.
To share on other social networks, click on any share button. What are these?


