

Efficacy of Ultrasound Microbubble-HGF Complex for Treating Hepatic Fibrosis and its Relation with Perfusion Weighted Imaging


Efficacy of Ultrasound Microbubble-HGF Complex for Treating Hepatic Fibrosis and its Relation with Perfusion Weighted Imaging
Shou-Hong Zhang1*, Ying Zhang1, Kun-Ming Wen2, Wei Wu3 and Wen-Yan Li3

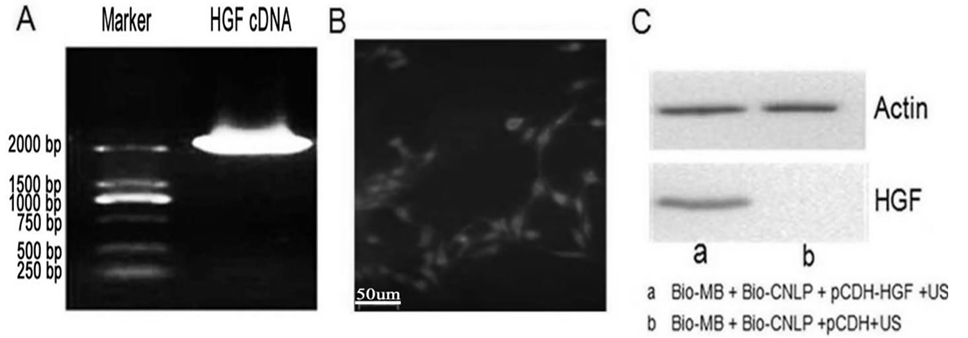
The construction of HGF expression vector and preparation of Bio-MB+Bio-CNLP. The HGF cDNAs were generated by PCR amplification and the expected ~2200 bp bands are shown (A), After transfection, the HGF expression was examined (B), in HSC-T6 by IF-IC andin L02 by Western blot (C). As a negative control, L02 cells transfected with blank pCDH vector had no detectable HGF bands.
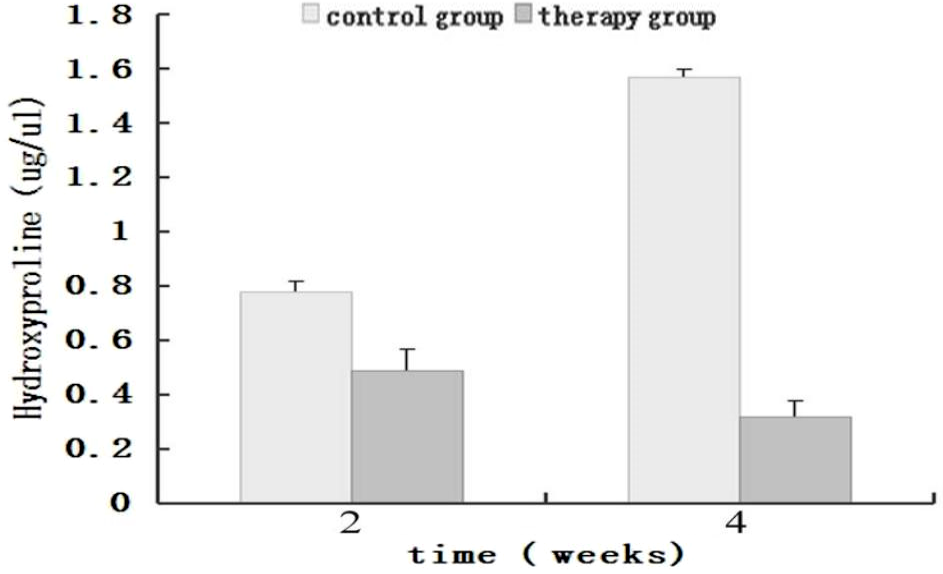
Hydroxyproline Content.

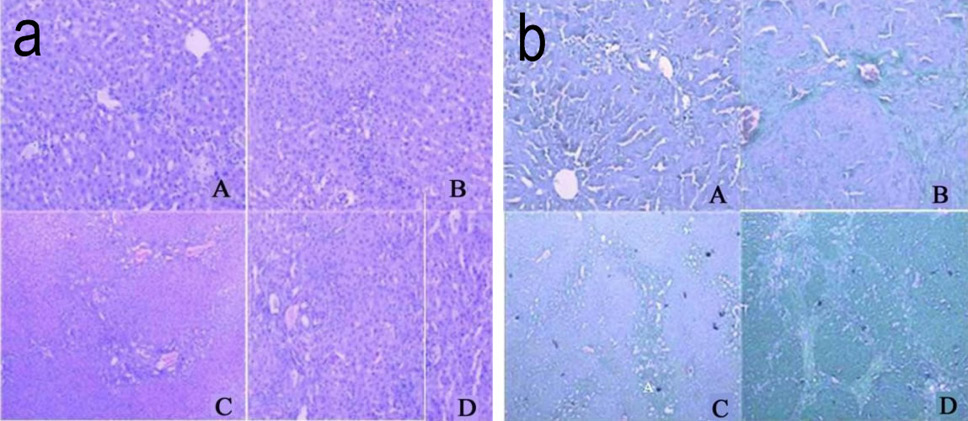
a. Hematoxylin/Eosin staining of liver tissue. A) stage 1 of liver fibrosis; B) stage 2 of liver fibrosis; C) stage 3 of liver fibrosis; D) stage 4 of liver fibrosis; b. Masson’s trichrome staining of hepatic tissues. A) stage 1 of liver fibrosis; B) stage 2 of liver fibrosis; C) stage 3 of liver fibrosis; D) stage 4 of liver fibrosis.

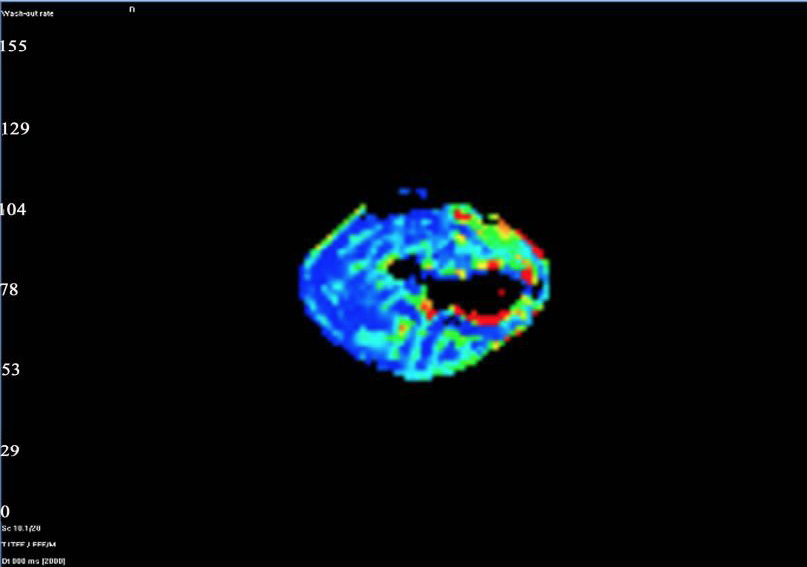
The liver of rats underwent bile duct ligation (BDL) were examined by MR-PWI.

Time-signal intensity curve (TIC) of hepatic fibrosis. a. TIC analysis of S0 stage hepatic fibrosis. The red line represents the perfusion curve of the abdominal aorta; the green line represents perfusion curve of the portal vein; and the blue line represents perfusion curve of the liver parenchyma. b. TIC analysis of S4 stage hepatic fibrosis. The red line represents the perfusion curve of the abdominal aorta; the blue line represents perfusion curve of the portal vein; and the green line represents perfusion curve of the liver parenchyma.


