

Dose Dependent Effect of Kisspeptin-10 Administration on Spermatogenesis and Hypothalamic Pituitary Gonadal Axis in Prepubertal Rats


Dose Dependent Effect of Kisspeptin-10 Administration on Spermatogenesis and Hypothalamic Pituitary Gonadal Axis in Prepubertal Rats
Faiqah Ramzan1,2,*, Irfan Zia Qureshi2 and Muhammad Haris Ramzan3

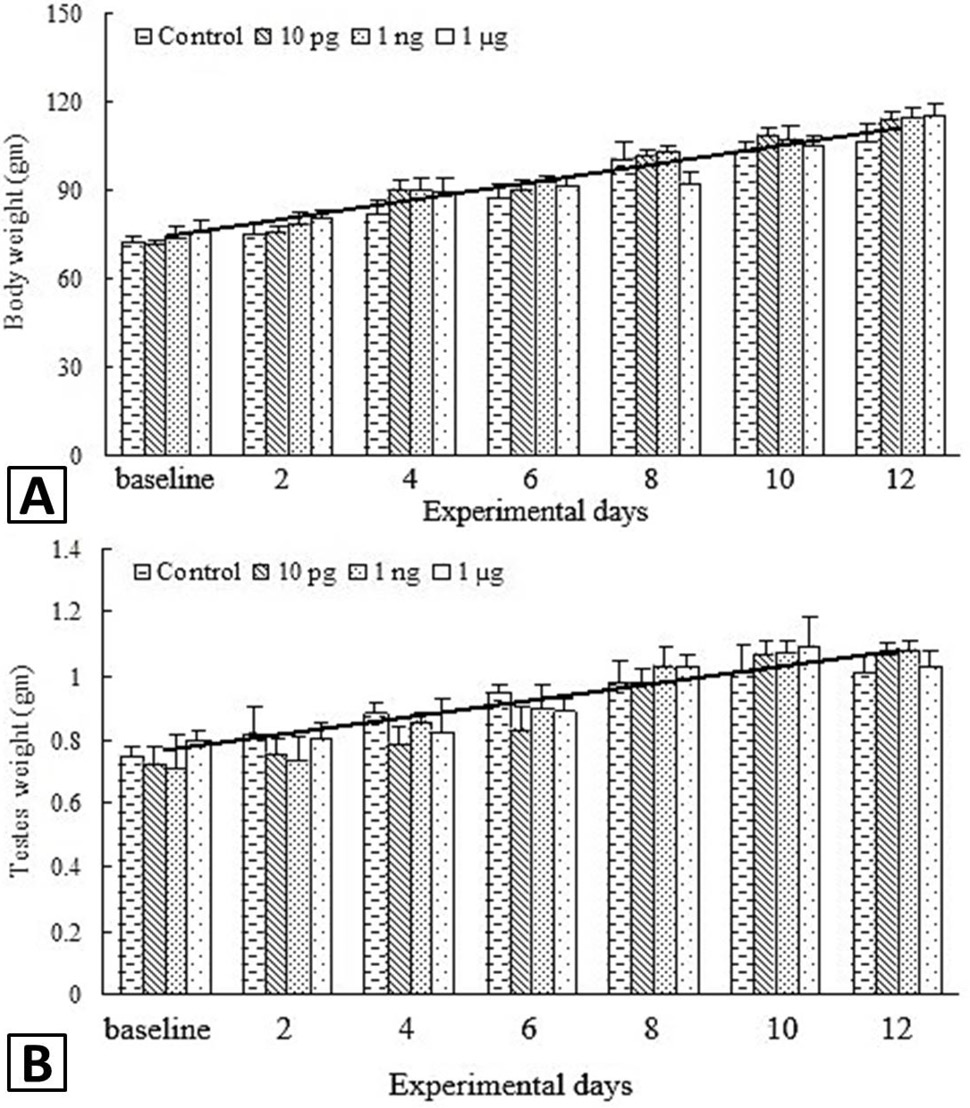
Body weight (A) and testis weight (B) after 2, 4, 6, 8, 10 and 12 days of alone kisspeptin treatment (10ρg, 1ηg, and 1µg doses). No difference was observed at any dose or treatment day. The trend line shows a linear increase in body weight and testis weight throughout the experimental days irrespective of the treatment. Trend line is shown only for 1µg dose. Values are expressed as mean ± SE (n=7).
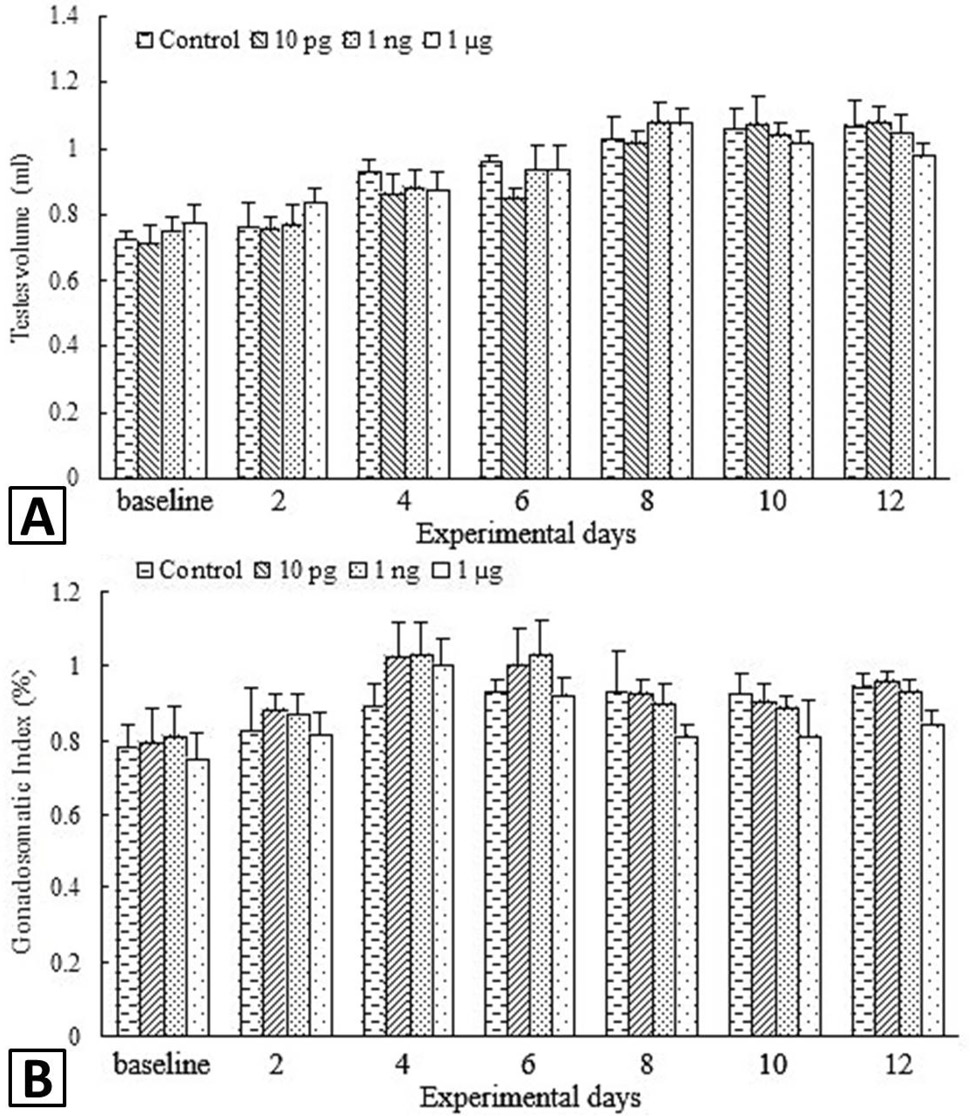
Testis volume (A) and gonadosomatic index (%) (B) after 2, 4, 6, 8, 10 and 12 days of alone kisspeptin treatment (10ρg, 1ηg, 1µg doses). No significant effect was observed at any of the treatment doses on testis volume and gonadosomatic index (%). Values are expressed as mean ± SE (n=7).
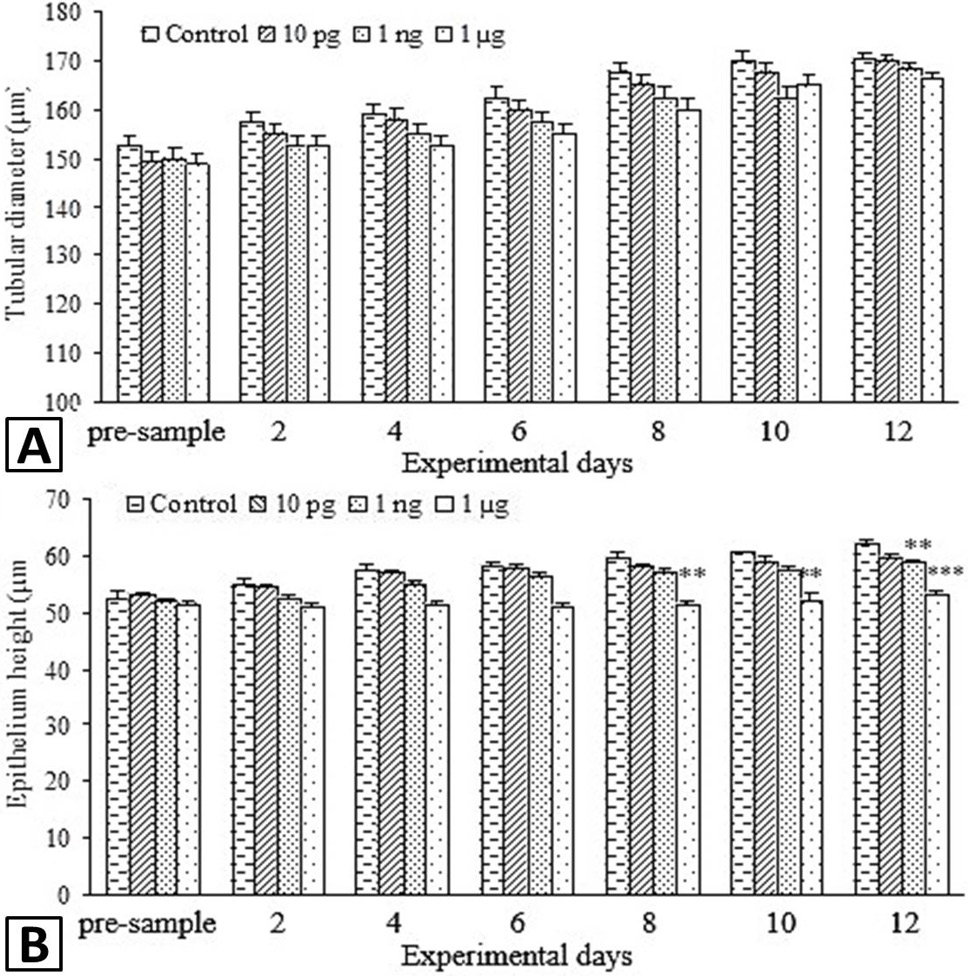
Seminiferous tubular diameter (µm) (A) and epithelium height (µm) (B) after 2, 4, 6, 8, 10 and 12 days of alone kisspeptin treatment (10ρg, 1ηg, 1µg doses). Kisspeptin (1µg) significantly decreased epithelium height after 8, 10 and 12 days treatment, 1ηg dose significantly decreased epithelium height after 12 days treatment while no effect was observed with 10ρg dose. Values are expressed as mean ± SE (n=7). **p< 0.01, ***p< 0.001.

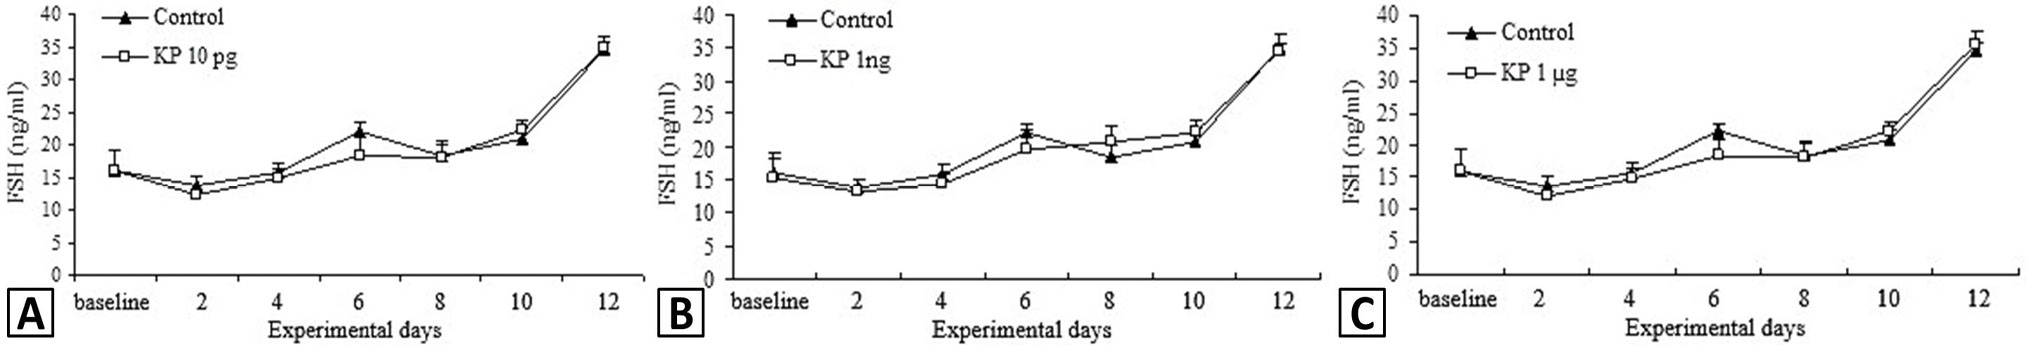
Plasma FSH concentration following treatment with 10ρg (A), 1ηg (B) and 1µg (C) doses after 2, 4, 6, 8, 10 and 12 days of alone kisspeptin treatment. FSH levels remained unaltered throughout the experiment. Values are expressed as mean ± SE (n=7).

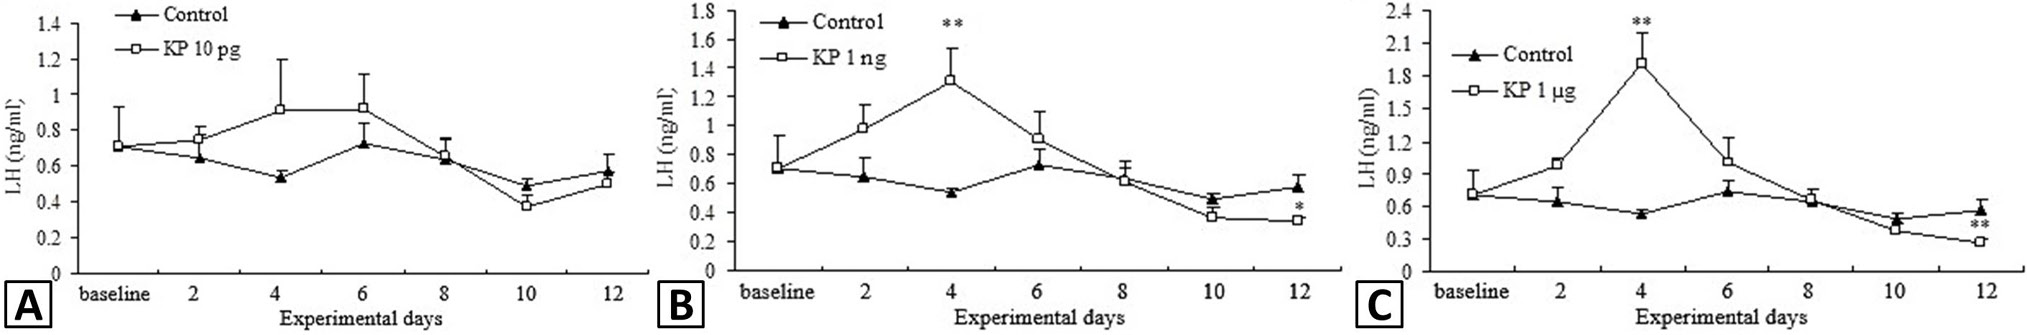
Plasma LH concentration following treatment with 10ρg (A), 1ηg (B) and 1µg (C) doses after 2, 4, 6, 8, 10 and 12 days of alone kisspeptin treatment. LH levels increased significantly after 4 days of treatment at 1ηg and 1µg doses but decreased afterwards. The decrease was significant after 12 days of treatment. The levels remained unaltered at 10ρg dose as compared to control throughout the experiment. Values are expressed as mean ± SE (n=7). *p<0.05, **p<0.01.
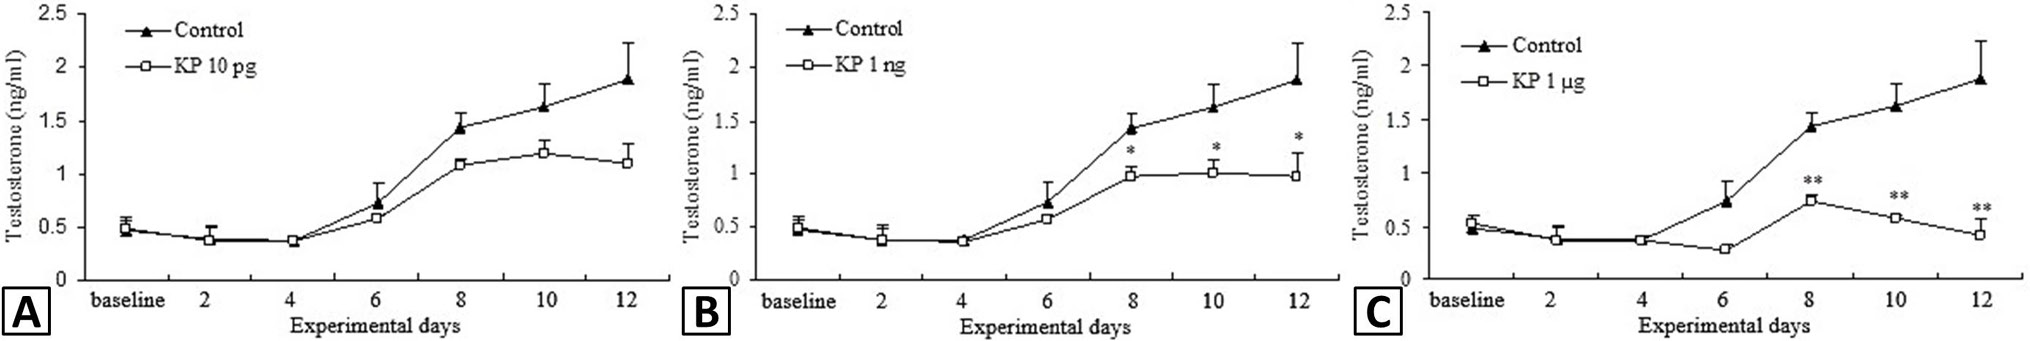
Plasma testosterone concentration following treatment with 10ρg (A), 1ηg (B) and 1µg (C) doses after 2, 4, 6, 8, 10 and 12 days of kisspeptin treatment. Testosterone concentrations remained unaltered until 4 days of treatment but decreased significantly thereafter. Values are expressed as mean ± SE (n=7). *p < 0.05, **p < 0.01.
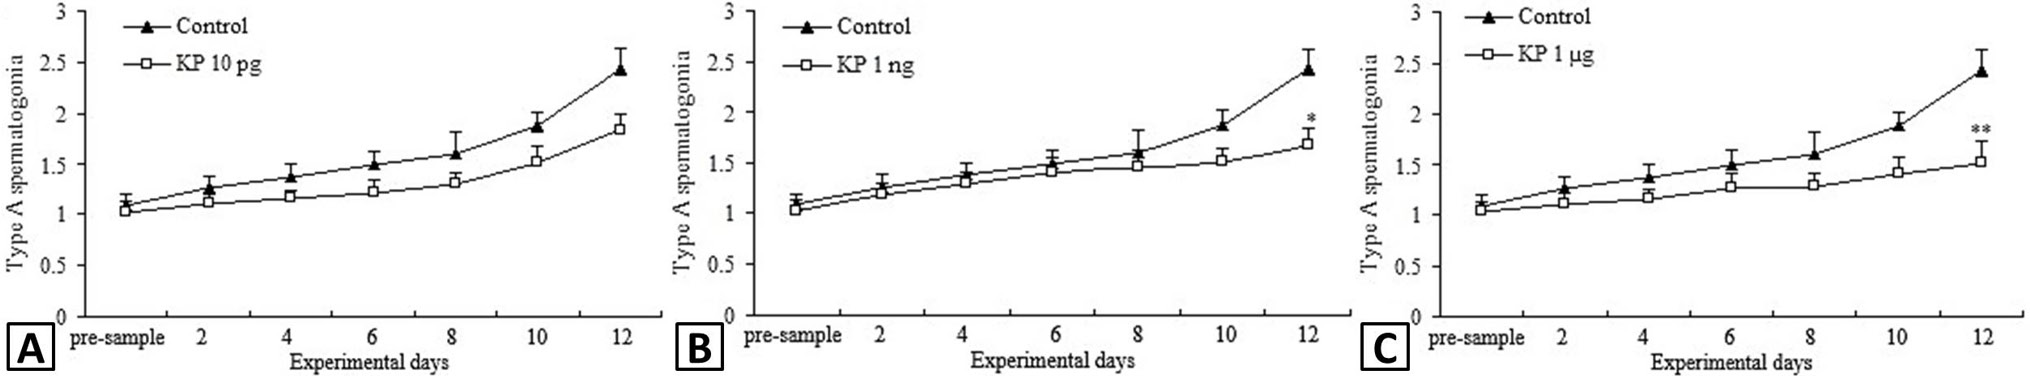
Number of type A spermatogonia following 10ρg (A), 1ηg (B) and 1µg (C) doses after 2, 4, 6, 8, 10 and 12 days of alone kisspeptin treatment. Type A spermatogonia decreased significantly in 1ηg and 1µg treatment groups only after 12 days of treatment. Values are expressed as mean ± SE (n=7). *p< 0.05, **p < 0.01.

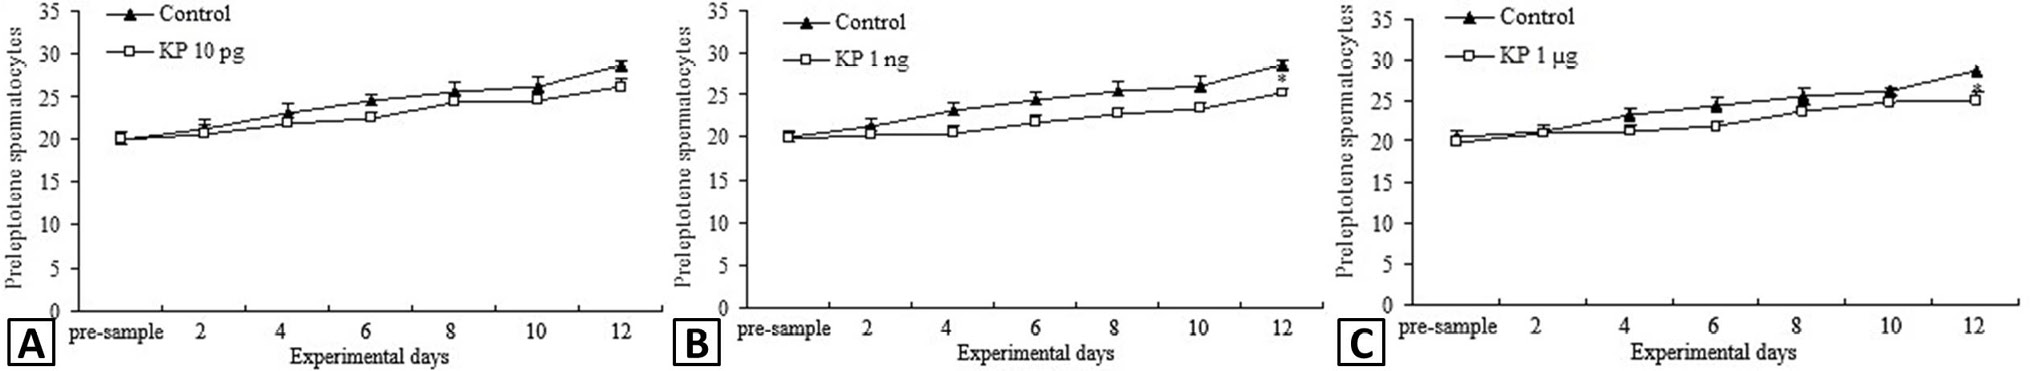
Number of preleptotene spermatocytes following 10ρg (A), 1ηg (B) and 1µg (C) doses after 2, 4, 6, 8, 10 and 12 days of alone kisspeptin treatment. Preleptotene spermatocytes decreased significantly only after 12 days of treatment at 1ηg and 1µg treatment doses only. They remained unaltered at 10ρg dose. Values are expressed as mean ± SE (n=7). *p < 0.05.

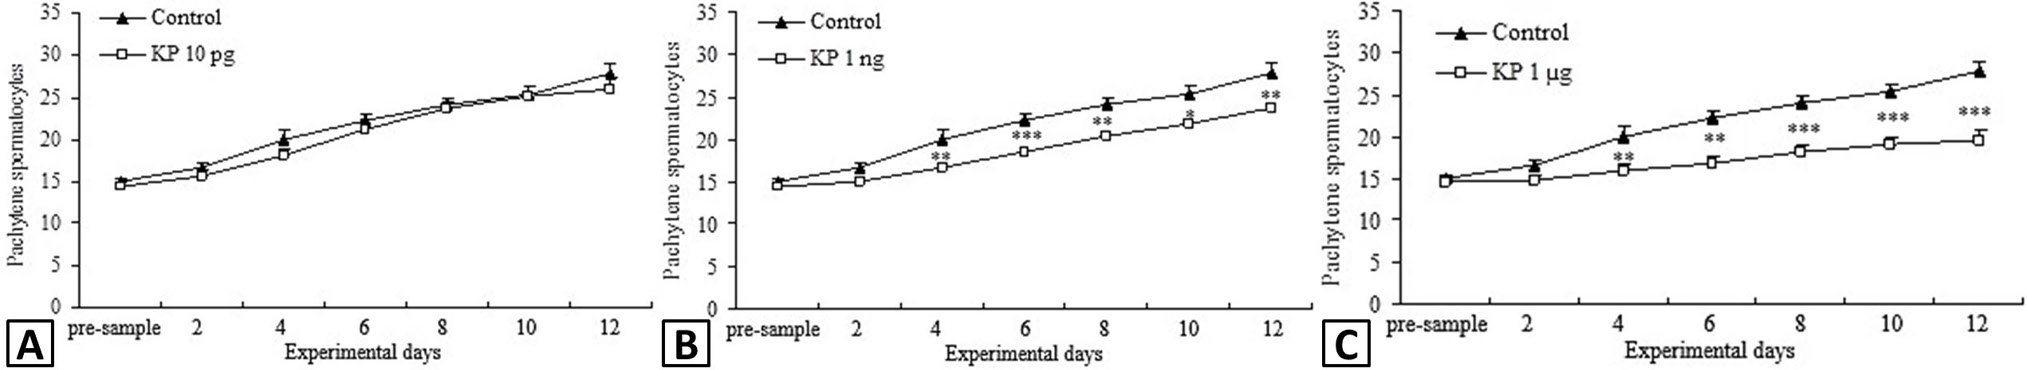
Number of pachytene spermatocytes following 10ρg (A), 1ηg (B) and 1µg (C) doses after 2, 4, 6, 8, 10 and 12 days of alone kisspeptin treatment. Significant decrease occurred in pachytene spermatocytes at 1ηg and 1µg kisspeptin doses after 4 days of treatment, which continued to 12 days. No effect was observed at 10ρg kisspeptin dose throughout the experiment. Values are expressed as mean ± SE (n=7). *p< 0.05, **p< 0.01, ***p < 0.001.
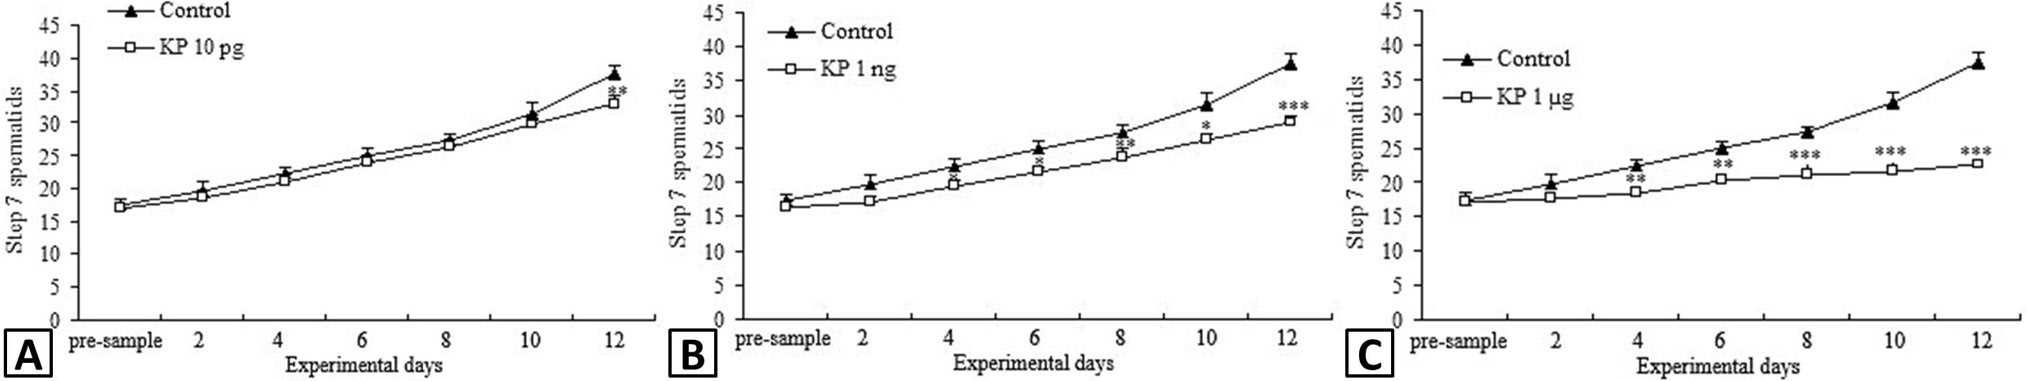
Number of step 7 spermatids following 10ρg (A), 1ηg (B) and 1µg (C) doses after 2, 4, 6, 8, 10 and 12 days of alone kisspeptin treatment. Step 7 spermatids decreased significantly in 1ηg and 1µg treatment groups after 4 days of treatment and thereafter, decreased gradually up to 12 days. 10ρg dose of kisspeptin caused a decrease in step 7 spermatids only after 12 days of treatment. Values are expressed as mean ± SE (n=7). *p < 0.05, **p < 0.01, ***p< 0.001.

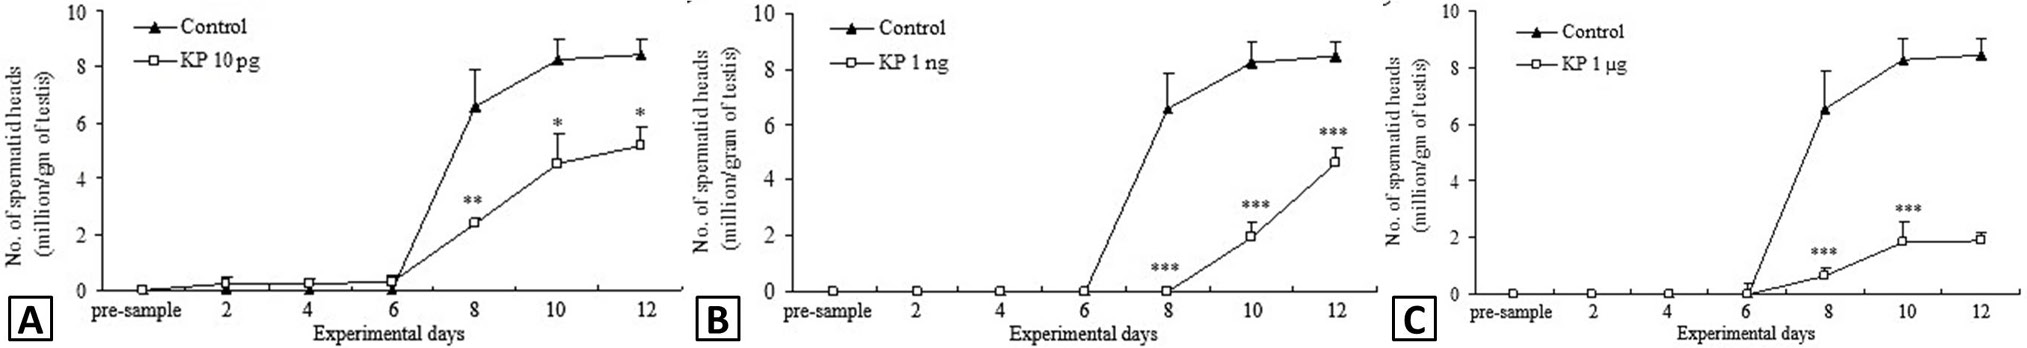
Number of elongated spermatid heads per gram of testis following 10ρg (A), 1ηg (B) and 1µg (C) doses after 2, 4, 6, 8, 10 and 12 days of alone kisspeptin treatment. A few elongated spermatids were observed before 41 days i.e. at 6 days of kisspeptin treatment. Elongated spermatids decreased significantly at all doses. Values are expressed as mean ± SE (n=7). *p < 0.05, **p< 0.01, ***p< 0.001.

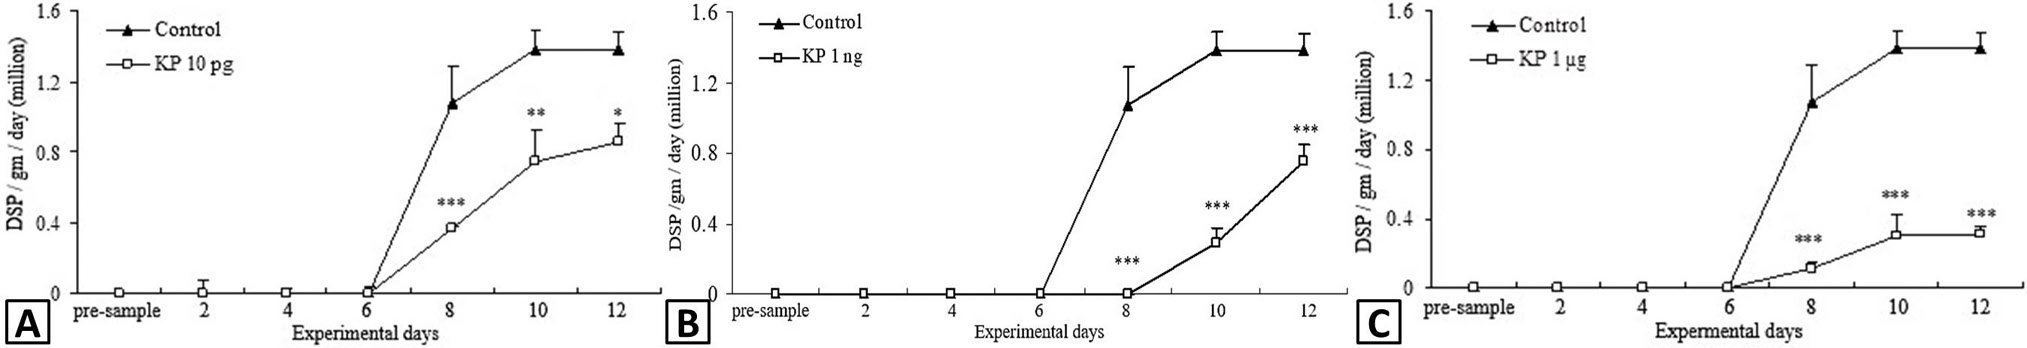
Daily sperm production per gram of testis per day following 10ρg (A), 1ηg (B) and 1µg (C) doses after 2, 4, 6, 8, 10 and 12 days of kisspeptin treatment. Daily sperm production decreased significantly at all kisspeptin doses after 8, 10 and 12 days of treatment. Values are expressed as mean ± SE (n=7). *p<0.05, **p<0.01, ***p<0.001.


